Figure 6:
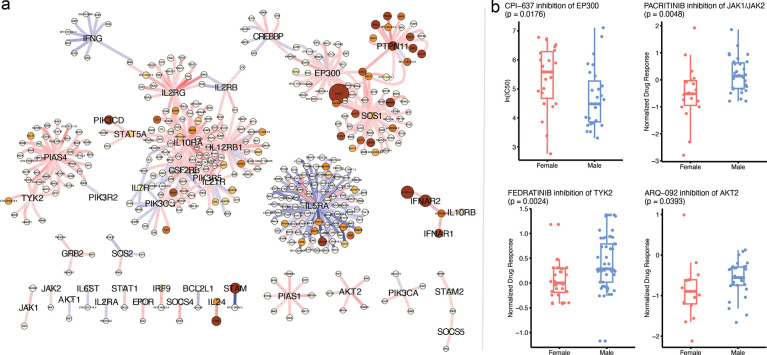
Probing the leading genes of the JAK/STAT signaling pathway for sex differences. Panel a shows the top 500 edges of the differential network centered on the n2v2r leading genes of the JAK/STAT pathway as returned by GSEApy, shown here with larger fonts. Red edges mean greater co-expression in females, and blue edges greater in males. The size of the nodes is the absolute degree difference. Nodes are colored according to the adjusted p-value from differential gene expression analysis with DESeq2: white is not significant, yellow to red is significant between 0.1 and 0. Panel b shows significant sex-biased drug responses (lower more sensitive) by inhibiting JAK/STAT genes in LUAD cell lines that are not differential in node degree and gene expression. The EP300 is from the GDSC repository, the rest from PRISM.

