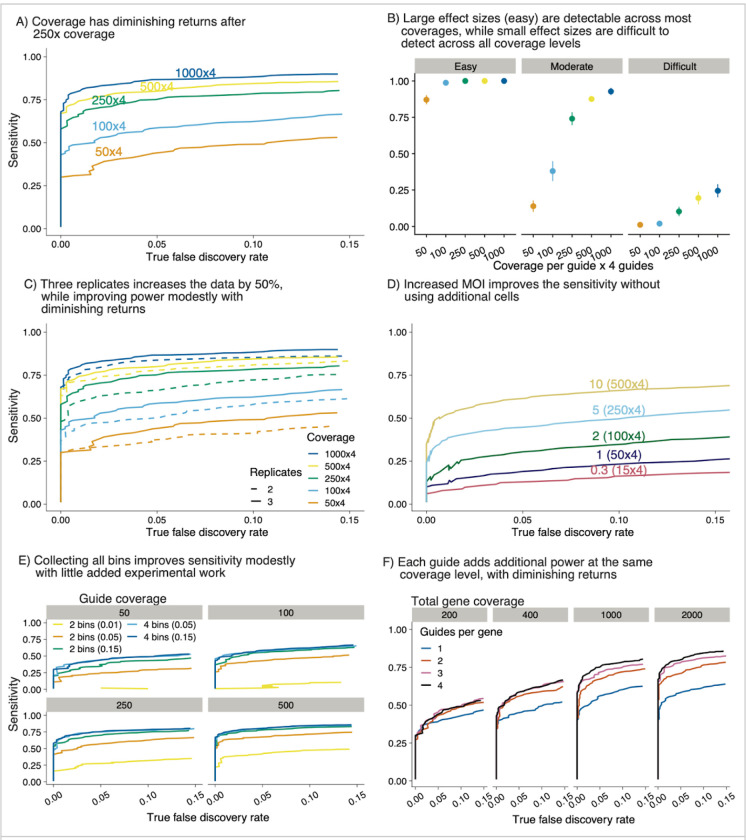
Figure 4: Waterbear simulations suggest high sensitivity is maintained at low cell counts and high MOI.
A) As gRNA coverage increases, sensitivity approaches saturation. In this simulation there are 4 gRNAs per gene, 1,000 genes, and 10% of all genes have an effect. Each line indicates the coverage at the gRNA level. B) Sensitivity of (A) broken down by the size of effect that the gRNA perturbation has on the marker expression levels. C) Comparison of 2 replicates versus 3 under the same conditions as (A). D) Effect of different MOIs on sensitivity. In this example we simulated 50,000 cells. E) Waterbear can be used with data from all 4 bins or by imputing unobserved middle bins (2 bin mode). Sensitivity assessed at 4 coverage levels. F) Effective coverage at the gene level stratified by the number of gRNAs. Each line indicates a different gRNA configuration and each subpanel indicates a fixed total gene level coverage.

