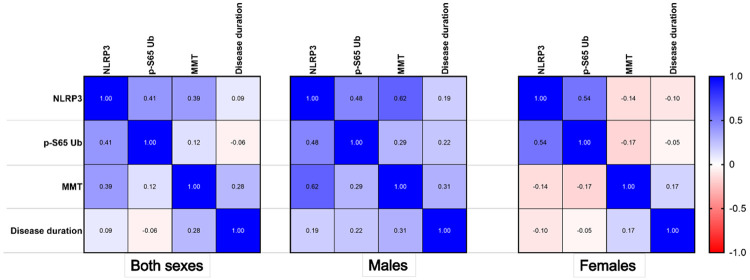
Figure 4: Correlation of NLRP3 inflammasome activation with altered mitophagy and muscle weakness.
Pearson correlation plot demonstrating correlation coefficient values for the NLRP3 RNA level, p-S65-Ub level, manual muscle testing (MMT) score and disease duration, by sex.
Both sexes: NLRP3 and p-S65-Ub, p = 0.059; NLRP3 and MMT score, p = 0.072; NLRP3 and disease duration, p = 0.543; p-S65-Ub and MMT score, p = 0.58; p-S65-Ub and disease duration, p = 0.699.
Males: NLRP3 and p-S65-Ub, p = 0.116; NLRP3 and MMT score, p = 0.032; NLRP3 and disease duration, p = 0.699; p-S65-Ub and MMT score, p = 0.359; p-S65-Ub and disease duration, p = 0.49.
Females: NLRP3 and p-S65-Ub, p = 0.106; NLRP3 and MMT score, p = 0.706; NLRP3 and disease duration, p-=0.781); p-S65-Ub and MMT score, p = 0.642; p-S65-Ub and disease duration, p = 0.898.

