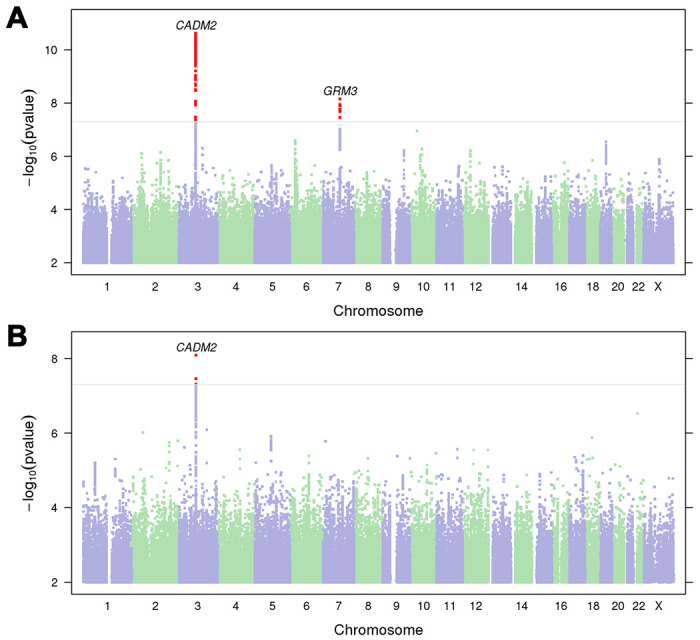
Figure 1.

Manhattan plots of A) lifetime cannabis use (N=131,895) and B) frequency of cannabis use (N=73,374). The horizontal line represents the significance threshold (p=5.00E-08). Nearest protein-coding genes (<1Mb) to significant loci (red dots) are labelled. For quantile-quantile plots and locus zoom plots, see Supplementary Fig. 2–4.
