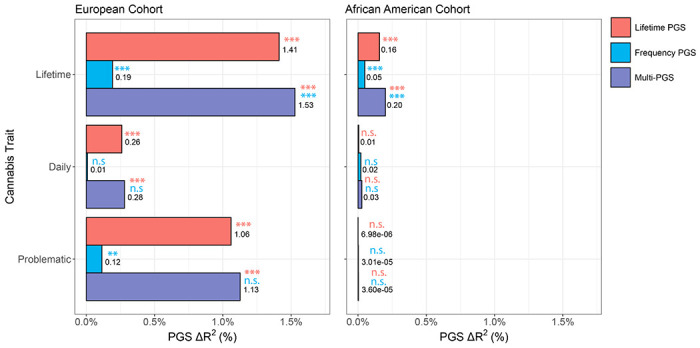
Figure 4.

Percent proportion of lifetime, daily, and problematic cannabis use variance attributable to lifetime cannabis use PGS, frequency of cannabis use PGS, or both (joint-PGS) in European and African AoU cohorts. Bonferroni-corrected significance of PGS contribution for single- and joint-PGS models (see Table 1, Supplementary Tables 15–16) shown above data label in its corresponding legend color (n.s. p>0.05, *p<0.05, **p<0.01, **p<0.001).
