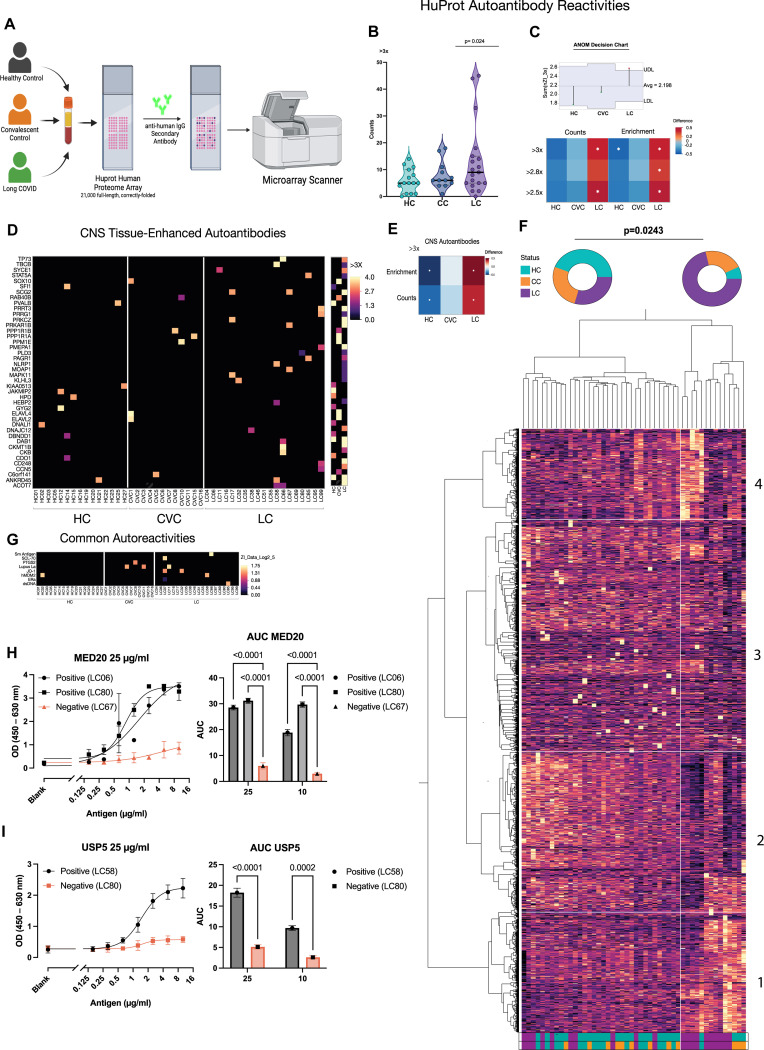
Figure 3. Individuals with Long COVID demonstrate elevated autoantibody reactivity including to CNS tissues.
A. Plasma from participants were incubated with HuProt microarray and probed with a secondary antibody against human IgG, positive targets were identified using an microarray scanner. B. Number of HuProt-derived auto-reactivities for each person within each group starting at a HuProt intensity threshold of >3x the mean of controls. Model was run using negative binomial (NB) regression with longlink function. Dispersion-adjusted incidence rate ratio for each group was compared to the overall mean using analysis of Means (ANOM), with significance adjustment using the Nelson method. Each point denotes the count of HuProt positive hits for an individual. C. Heatmap depicting the incidence rate ratios derived from negative binomial regression for each group at HuProt thresholds between 2–3x the signal intensity of the control mean, as in A. Asterisks denote significance from the adjusted overall mean using NB-derived ANOM with significance adjustment using the Nelson method. D. Heatmap depicting HuProt autoantibody reactivity to CNS starting at HuProt scores of >=3x. Each column represents a single participant and each row represents a single protein. E. Heatmap depicting the incidence rate ratio difference between each respective group and the mean of all groups using Poisson Regression with ANOM analysis followed by Nelson correction. Asterisks denote significance. F. Heatmap showing unsupervised cluster analysis for HuProt autoantibody reactivity. G. Heatmap depicting HuProt autoantibody reactivity to common antigens by group starting at HuProt scores of >=2.8x. H-I. ELISA and Area Uder Curve (AUC) analysis for top hit targets identified by Huprot.

