Abstract
Photoaffinity probes are routinely utilized to identify proteins that interact with small molecules. However, despite this common usage, resolving the specific sites of these interactions remains a challenge. Here, we developed a chemoproteomic workflow to determine precise protein binding sites of photoaffinity probes in cells. Deconvolution of features unique to probe-modified peptides, such as their tendency to produce chimeric spectra, facilitated the development of predictive models to confidently determine labeled sites. This yielded an expansive map of small molecule binding sites on endogenous proteins and enabled the integration with multiplexed quantitation, increasing the throughput and dimensionality of experiments. Finally, using structural information, we characterized diverse binding sites across the proteome, providing direct evidence of their tractability to small molecules. Together, our findings reveal new knowledge for the analysis of photoaffinity probes and provide a robust method for high-resolution mapping of reversible small molecule interactions en masse in native systems.
Editor summary:
A chemoproteomic workflow was developed to determine the interaction sites of photoaffinity probes in cells, enabling the identification of diverse binding pockets and providing evidence of their tractability to small molecule action.
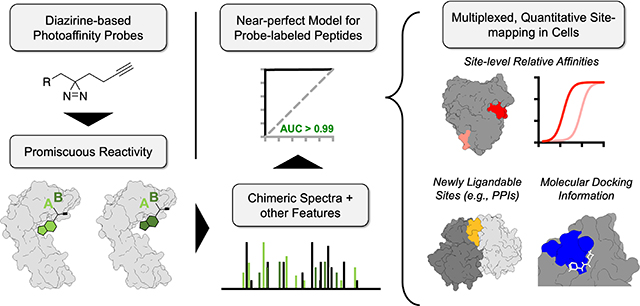
Graphical Abstract
Introduction
Determining precisely where small molecules interact with proteins provides critical insight into the mechanism of action (MoA) of bioactive compounds, aids in the optimization of potency and selectivity of compound leads, and, more broadly, yields information about the tractability of proteins to small-molecule modulation1. Formal structural techniques, such as nuclear magnetic resonance (NMR)2 and X-ray crystallography3, have been extensively utilized for such goals. While these approaches have proven successful, they are limited to well-behaved, purifiable targets. Further, they are unable to fully recapitulate the interactions of small molecules with proteins in an endogenous environment where dynamic factors such as localization, post-translational modifications (PTMs)4, protein-protein interactions (PPIs)5,6, and binding to allosteric modulators7–9, not only impact protein function and structure, but also their ligandability (i.e. the capacity for small molecule binding). Finally, conventional structure-based methods do not capture the proteome-wide interactions of small molecules nor enable the broader discovery of novel ligandable sites on proteins.
To address these gaps, various chemoproteomic methods have been developed for the proteome-wide mapping of small molecule-protein interactions directly in native systems10–14. These methods have been routinely applied for covalent compounds that target nucleophilic amino acid side chains10,15. To preserve the interactions of non-covalent small molecules with protein targets, photoaffinity labeling is frequently utilized16–18. Here, photoreactive groups are appended to a compound of interest and, upon exposure of probe-treated samples to ultraviolet (UV) light, create highly reactive intermediates that form covalent bonds with nearby proteins. Though a variety of photoreactive groups can be utilized, diazirines are particularly attractive due to their high reactivity as well as their minimal size, which reduces the chance that the photoreactive group will alter the physicochemical properties or proteomic interactions of a compound of interest16,19,20. As a result, diazirine-based probes have been widely implemented to map the protein interactions of small molecules16,17, including approved drugs21,22, screening hits23–25, drug-like fragments26,27, natural products28 and other small molecules17,29–32 underpinning their significant and broad impact in biological studies.
We previously evaluated several diazirine-based photoreactive groups for chemoproteomic applications19 and found that, while utilizing multiple diazirine-based enrichment tags can maximize the detection probability of a target protein, dialkyl diazirine-based tags13 provided the highest levels of proteomic reactivity with minimized background interactions. Further, we11,12,21 and others31–33 have shown that dialkyl diazirines can be used to identify the probe site-of-labeling (SoL) and approximate ligand binding pockets. However, despite their increasing usage to map small molecule binding sites, an incomplete understanding of the mass spectrometry (MS)-based acquisition and analysis of probe-labeled peptides has impeded comprehensive site-determination for diazirine-based probes.
Though recent studies have been aimed at elucidating the labeling preferences of diazirines with amino acids, both in vitro33 and in situ34, significant challenges remain that encumber their broad usage for site determination. First, the low abundance of probe-labeled peptides reduces the likelihood of being detected and selected for analysis during proteomic experiments. Second, co-fragmentation of probe adducts with peptide backbones changes the mass of the adduct and creates additional, unassignable fragment ions in experimental MS2 spectra, both of which negatively impact matches to in silico predicted spectra35. Further, the false discovery rate (FDR), or the estimated proportion of peptides that are incorrectly assigned in a proteomics experiment, for modified peptides can differ from unmodified peptides at a given score threshold36. Finally, the promiscuous insertion of diazirines33,34 necessitates that every location on a peptide sequence be considered for adduction in proteomic searches, drastically increasing search space, resulting in extended analysis times, increased potential for false positives and reduced numbers of total identifications37,38. To address some of these challenges, recent studies have utilized orthogonally cleavable, isotopically encoded enrichment tags to increase the confidence of adducted peptides through the detection of an isotopic signature19,26,27,34,39. However, such approaches can increase proteome complexity at the MS1 level40,41, reduce the precursor abundance derived from a single labeled peptide, or require manual, subjective verification of identified peptides39.
To expand the utility of photoaffinity probes in identifying small molecule binding sites on endogenous proteins in cells, we sought to improve the spectral analysis of probe-labeled peptides. We found that probe-labeled peptides have a propensity to generate chimeric spectra resulting from the co-elution and co-isolation of peptides with identical sequences and molecular weight but labeled on distinct amino acid residues. Utilizing this knowledge, along with other features of probe-labeled peptides, we constructed probability models to predict whether a spectrum corresponds to a probe-labeled peptide. These models were used to provide increased coverage and confidence of labeling locations and enabled the integration of photoaffinity probe SoL experiments with tandem mass tag (TMT)-based quantitative proteomics. We constructed proteome-wide, site-specific, concentration profiles for photoaffinity probes directly in live cells and confirmed several of these interactions through orthogonal methods. Leveraging this aggregate binding site data, we utilized experimental and predicted structures to map thousands of small molecule binding pockets, many of which have no reported ligands, across the native proteome. Finally, we integrated this information with molecular docking to generate predictive binding modes for 80+ interactions, highlighting the utility of this methodology to inform ligand design.
Results
Benchmarking of diazirine-based chemoproteomic analyses
We first sought to benchmark diazirine-based chemoproteomic analyses using conventional workflows19,26,27,34,42,43. For these studies, we chose to use fully-functionalized fragment (FFF) probes26,44 due to their broad protein interactions, providing a rich dataset for analysis. FFF probes consist of 1) a fragment molecular recognition group, 2) a photoreactive diazirine group, and 3) a biorthogonal alkyne handle. A control probe (1) was used to account for background interactions of the diazirine tag while seven diverse FFF probes (2 - 8) were used to capture protein targets (Figure 1a). A workflow using these probes to identify enriched proteins is depicted in Fig. 1b (hereafter “whole protein” samples). Proteins with a fold-change ≥5 over the control probe and a p-value of <0.05 are operationally considered enriched. To isolate probe-labeled peptides, a cleavable enrichment tag19,45 is used to release modified peptides that remain bound to the streptavidin beads following trypsin digestion (hereafter, site-of-labeling, or “SoL”, samples; Fig. 1c). To ensure high-confidence assignments, duplicate samples are prepared in parallel, “clicked” with previously developed isotopically labeled ‘light’ (L) and ‘heavy’ (H; +6.0138 Da), acid-cleavable dialkyldiphenylsilane azide tags19, and pooled prior to MS analysis (Fig. 1c, Supplementary Dataset 1). With these tags, probe-labeling events are required to have identical peptides detected with both the L and H tag, providing increased confidence in their assignment.
Figure 1.
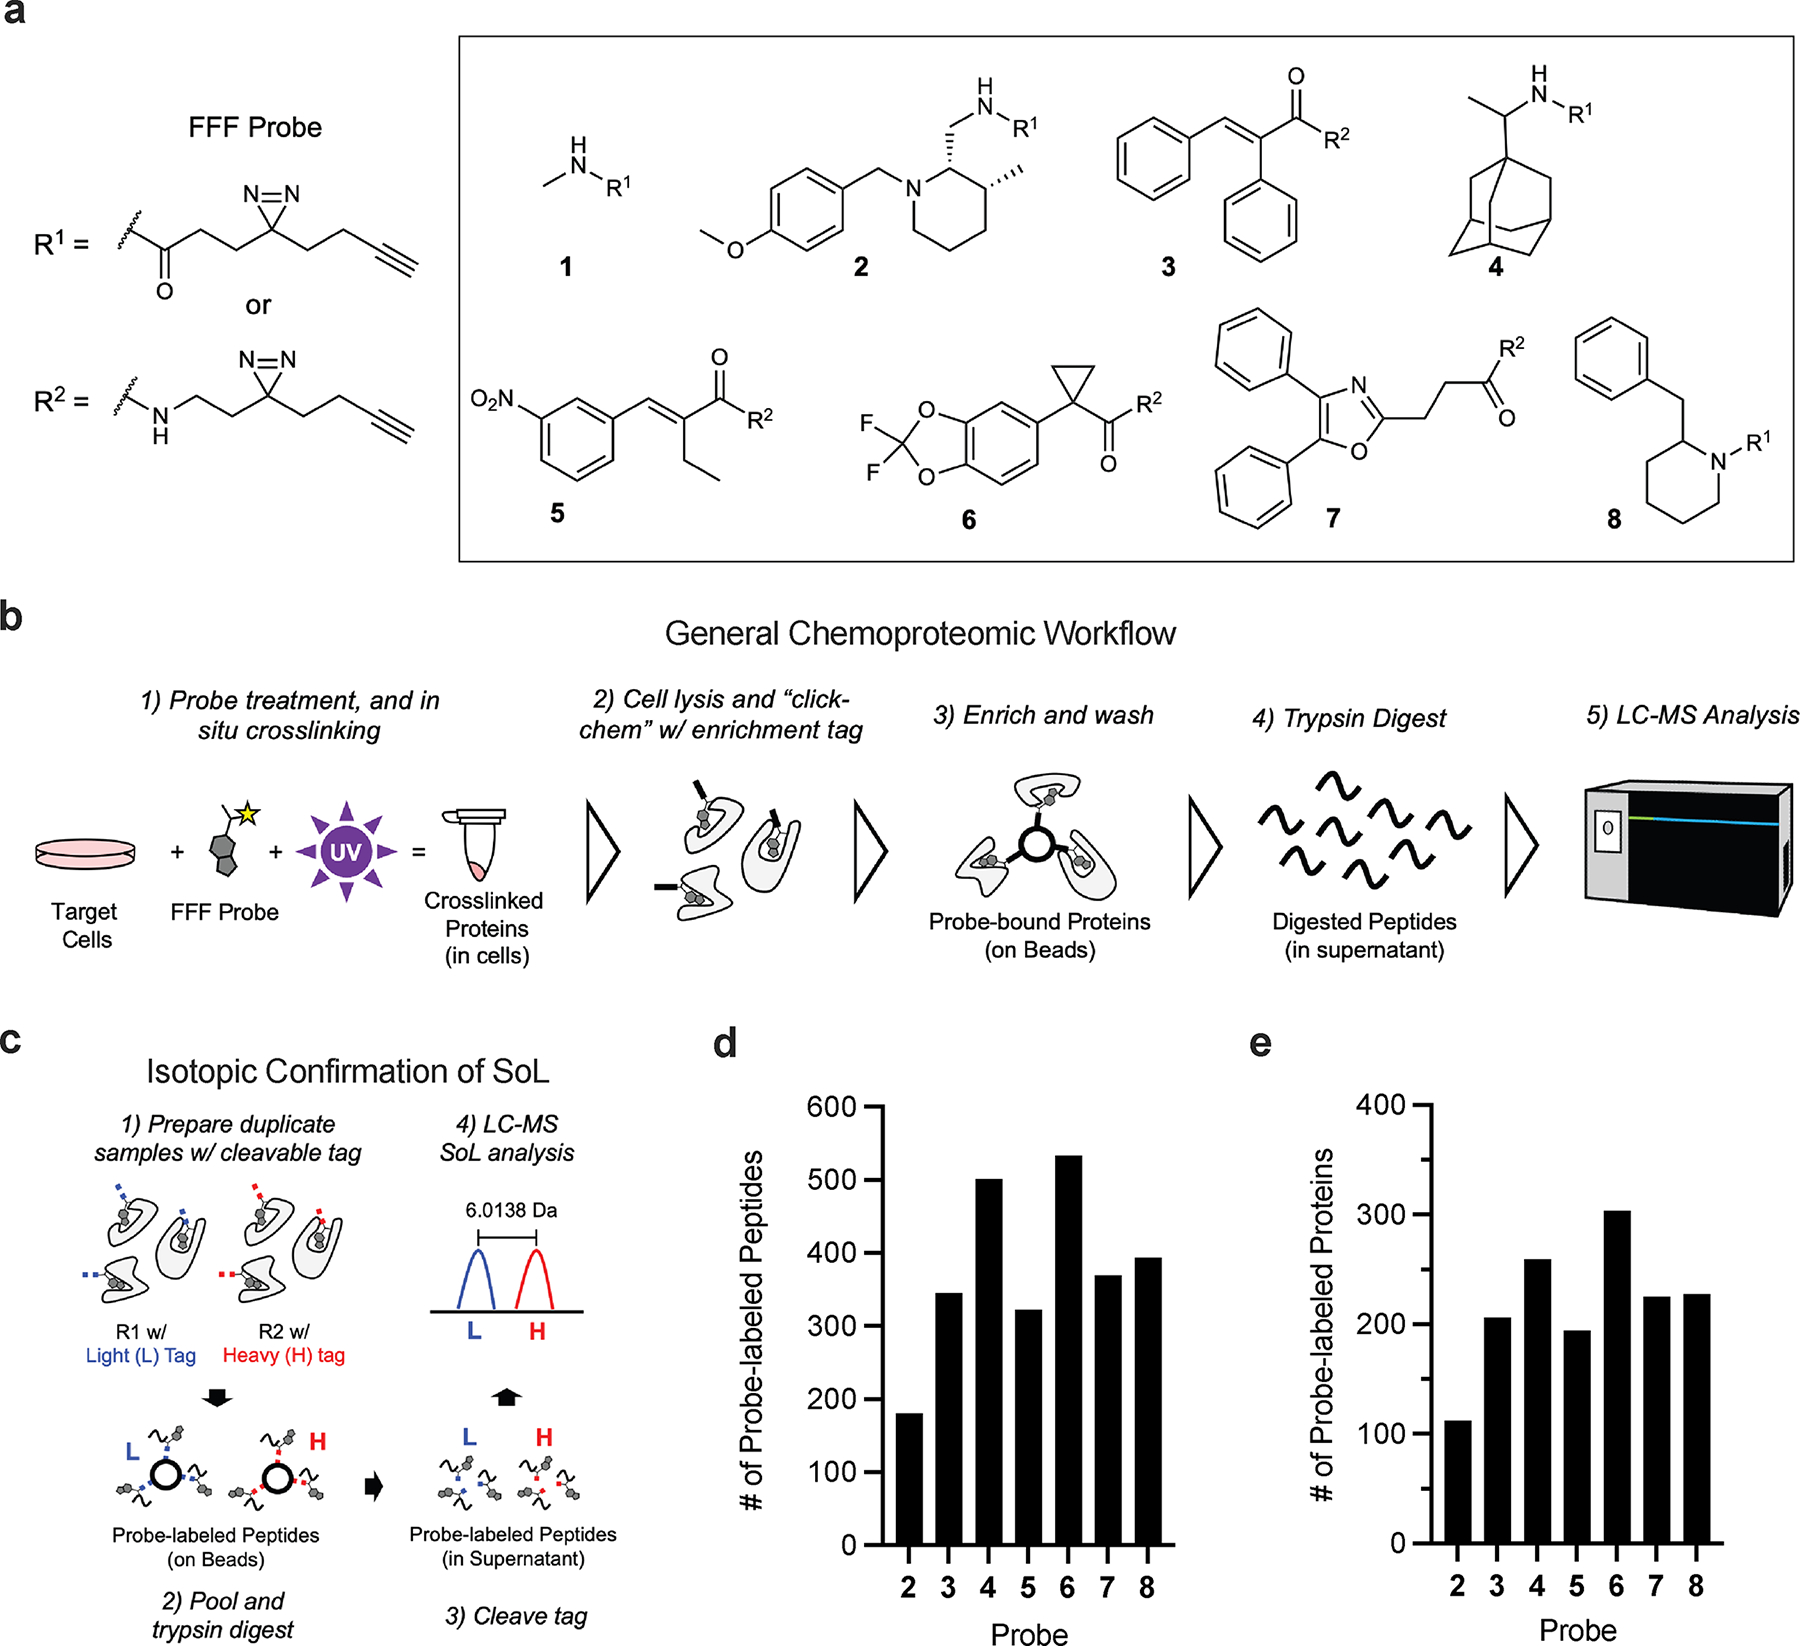
Overview and benchmarking of chemoproteomic site of labeling (SoL) analysis of photoaffinity probes. (a) Structures of fully functionalized fragment (FFF) probes. (b) Schematic of general chemoproteomic workflow and (c) of isotopic confirmation of photoaffinity probe SoL. Briefly, cells are treated with an FFF probe before being crosslinked under UV light. Cells are then lysed and a biotin enrichment tag is appended to crosslinked proteins via copper-catalyzed azide-alkyne cycloaddition (CuAAC) “click” chemistry. Following the click reaction, captured proteins are enriched via streptavidin beads and digested with trypsin. Digested peptides are then labeled with TMT reagents and pooled for multiplexed, quantitative proteomic analysis. Reporter ion signals for proteins in FFF probe-treated samples are compared to the methyl probe-treated samples to determine relative enrichment levels at the total protein level. Probe-labeled peptides (d) and proteins (e) detected in benchmarking SoL workflow.
Whole protein level samples possessed excellent within-replicate correlation across all FFF probes (Supplementary Figure 1a, Supplementary Dataset 1) and substantially higher protein enrichment relative to control 1 samples (Supplementary Fig. 1b, Supplementary Dataset 1). We found FFF probes enriched a diverse array of protein targets (Supplementary Fig. 1c, Supplementary Dataset 1). Despite a subset of proteins showing broad interactions across many probes, the majority (>90%) showed a preference of enrichment by one or a subset of probes (Supplementary Fig. 1d–k), demonstrating unique binding preferences imparted by the fragment group. From these enriched targets, we were able to identify ~200 – 600 probe-labeled peptides (Fig. 1d, Supplementary Dataset 1), which mapped to ~100 – 300 proteins (Fig. 1e), per FFF probe (SoL level), consistent with previously reported investigations19,26,27,34.
Probe-labeled peptides generate chimeric MS2 spectra
During these studies, we noted that the spectra of probe-labeled peptides possessed features distinct from the spectra of unlabeled peptides. Most striking was the difference in identification scores (ie. delta score) between the first and second ranked peptide sequence (or probe location) assigned to a spectrum (Fig. 2a). This suggested that multiple peptides are present in spectra assigned to probe-labeled peptides (i.e., they are “chimeric”). Chimeric spectra are the result of co-eluting, co-isolating peptides from complex mixtures46. We hypothesized that, given the promiscuous nature of diazirine insertion into amino acid residues33,34, SoL experiments would generate populations of nearly identical peptides, differing only in the amino acid crosslinked by the probe. Many of these peptides would be expected to co-elute and co-isolate due to similar hydrophobicity and identical molecular weights, respectively. Standard proteomic search algorithms do not take chimeric spectra into account as typically one peptide sequence is ultimately assigned to a given spectrum47. However, when multiple peptides were allowed to be assigned to a single spectrum (“multiPSM” search; see Methods section), we observed a substantial increase in the total number of peptide-spectrum matches (PSMs) assigned to spectra containing probe-labeled peptides (Fig. 2b), while the number of PSMs assigned to spectra containing unlabeled peptides remained constant (Supplementary Fig. 2a). Moreover, nearly all the additional PSMs (>99% across all probes) were identical in peptide sequence to the original assignments for respective spectra, but with the probe localized to a different residue (Fig. 2c).
Figure 2.
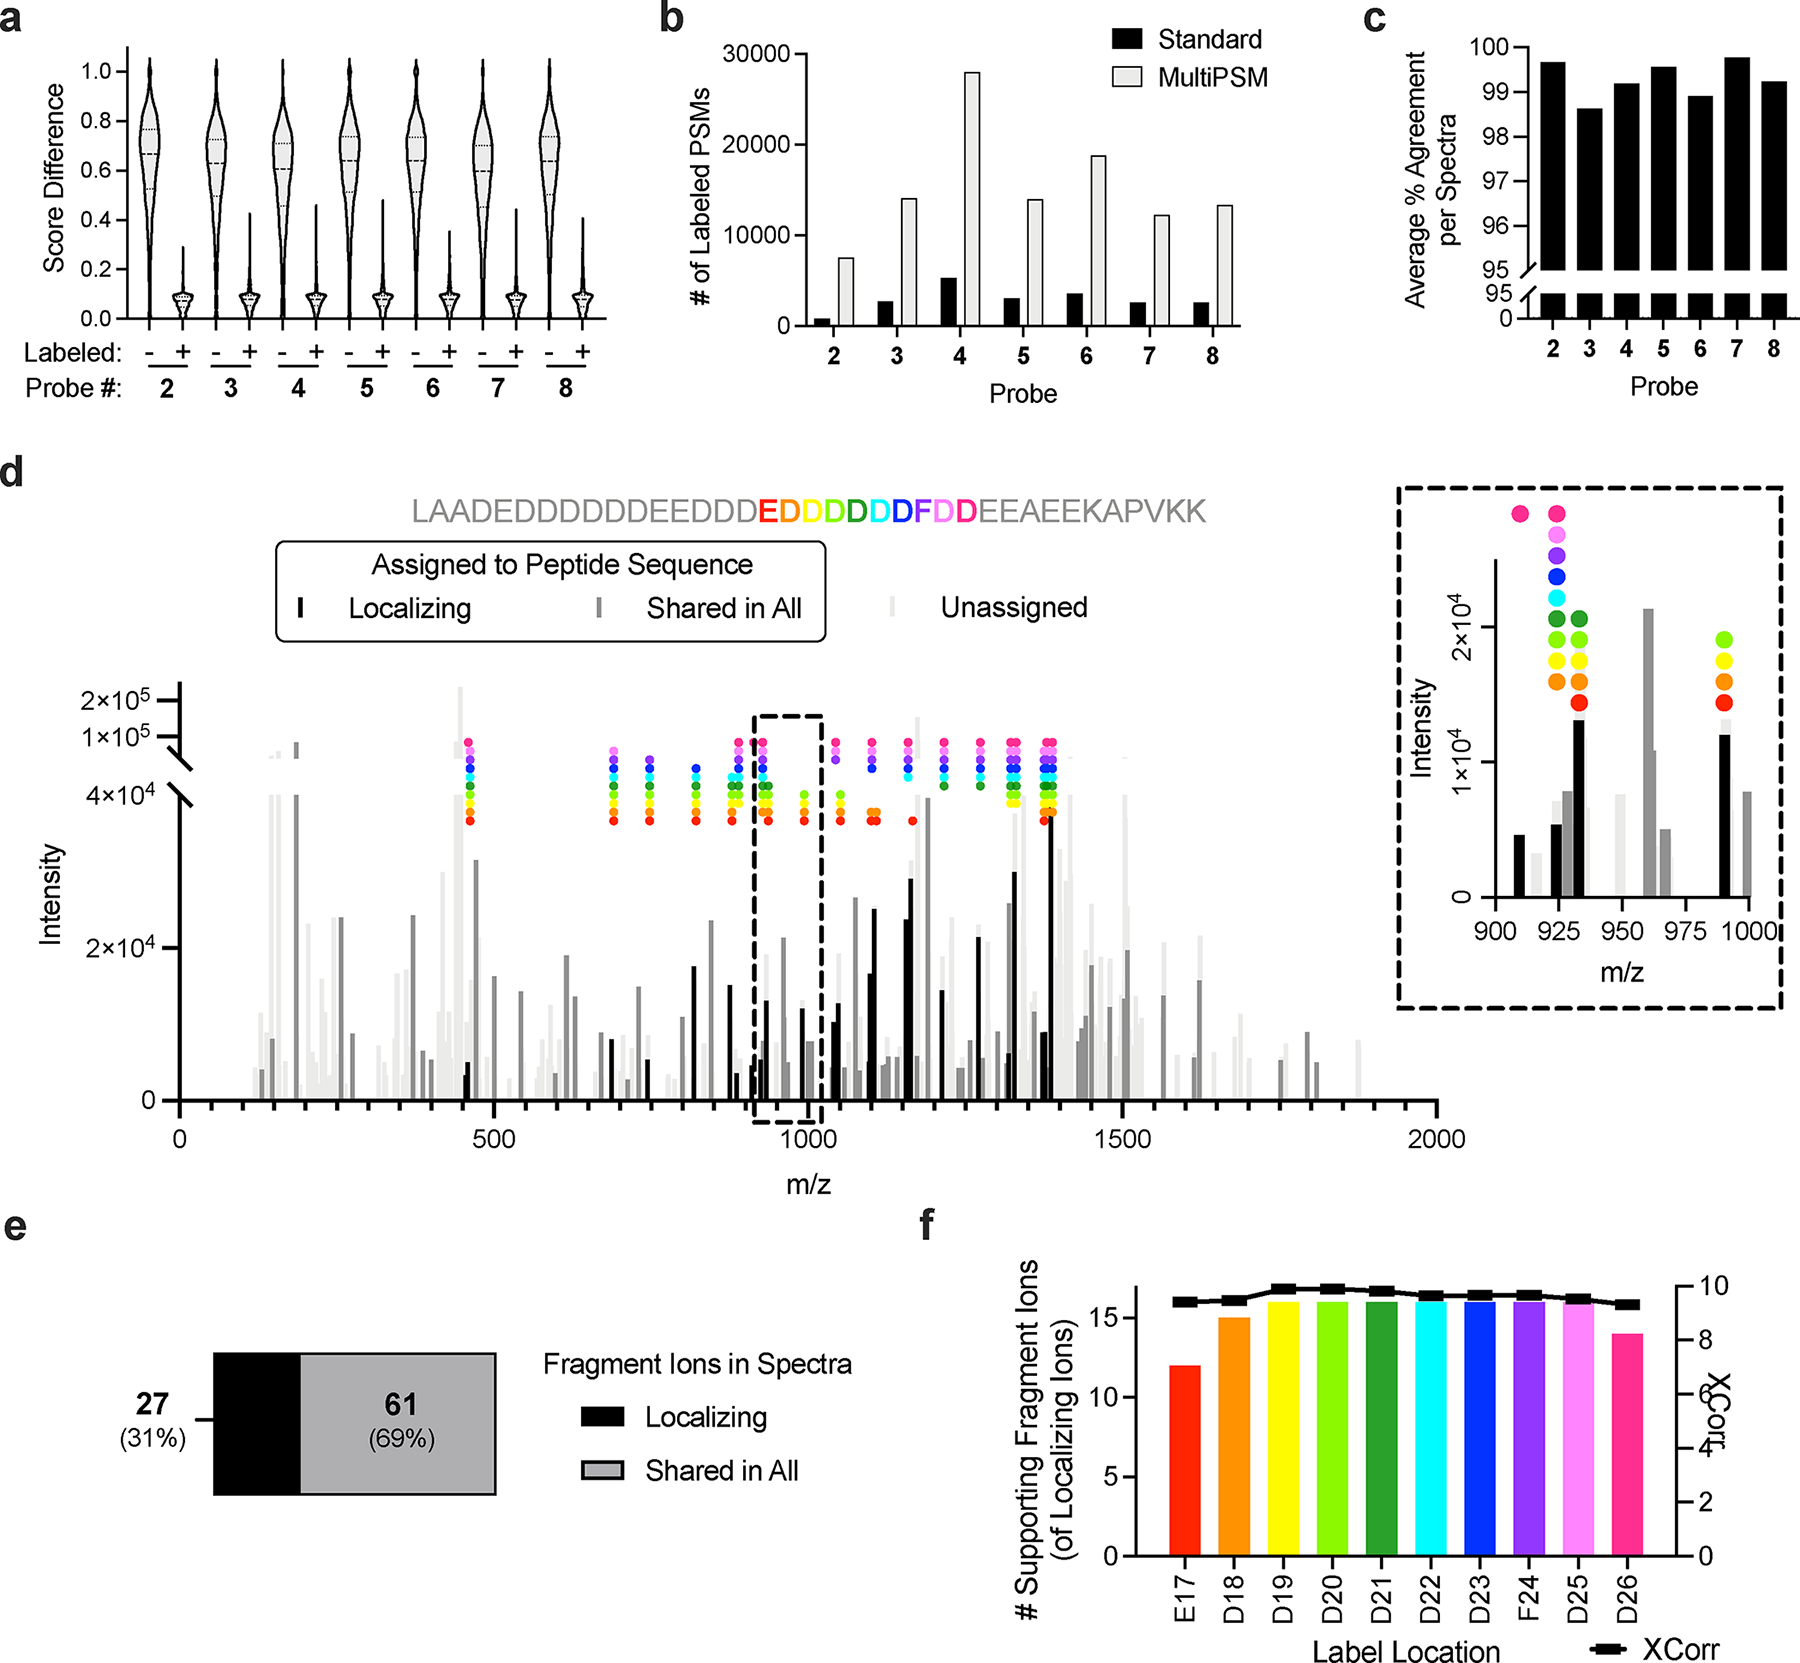
Photoaffinity probe labeled peptides generate chimeric spectra. (a) Score differences between first and second ranked PSMs for spectra assigned to labeled and unlabeled peptides. (b) Labeled PSMs detected in standard and multiPSM proteomic searches. (c) Sequence agreement of peptides assigned to same spectra in multiPSM proteomic searches. (d) Example of a highly chimeric spectra containing at least ten label sites. Probe label sites and corresponding supporting fragment ions are indicated with identical colors. Inset shows zoomed region of 900 – 1000 m/z. (e) Proportion of fragment ions in chimeric spectra that correspond to a particular probe location or are shared in all locations. (f) Number of supporting fragment ions and XCorr values for each label location within the example chimeric spectra.
To better understand the scope of these chimeric spectra, we extracted a series of examples, ranging from highly chimeric (containing ten label locations, Fig. 2d) to less chimeric spectra (containing only two label locations, Supplementary Fig. 3a). We observed that while most of the fragment ions were shared across all label locations, a substantial fraction of fragment ions emanate from distinct label locations (Fig. 2e, Supplementary Fig. 3a–h). Importantly, the assigned locations have similar numbers of supporting, localizing ions and XCorr values (Fig. 2f, Supplementary Fig. 3a–h), providing high confidence for each labeled site. Notably, we found that the multiPSM search captured the majority (>85% across all probes) of sites reported by conventional PTM localization tools (eg. ptmRS48), but also provided evidence for thousands of additional sites (Supplementary Note 149,50; Extended Data Fig. 1a–c). Finally, with this more comprehensive view of probe-label locations, we examined the relative diazirine reactivity across all amino acids. In line with previous investigations of peptides in vitro33 and proteins in situ34, a preference for glutamic acid was observed (Supplementary Fig. 2b–c). However, this preference was found to be reduced in the multi-PSM search (Supplementary Fig. 2d), suggesting that searches that only consider the highest ranked PSM assigned to a given spectra, rather than all high-ranking PSMs, may introduce biases.
Modeling the probabilities of probe-labeled peptides
Given this prevalence of chimeric spectra, we sought to utilize this information to generate a predictive model for the probability that a spectrum contains a probe-labeled peptide. Toward this end, we systematically compared spectral features of high-confidence, probe-labeled peptides to unlabeled peptides (Extended Data Fig. 2a). As expected, delta score and number of PSMs assigned to a spectrum were highly predictive of probe-labeled peptides (Fig. 3a, Extended Data Fig. 2a). In addition, retention time (RT) was also found to be a predictive feature (Fig. 3a, Extended Data Fig. 2a), presumably due to the increased hydrophobicity of peptides containing the FFF probe modifications. Across all probes, the delta score parameter was the most predictive with number of PSMs and RT possessing slightly less predictive power (Fig 3a). Using these features as input, we generated a near-perfect predictive model for identifying spectra containing probe-labeled peptides (Fig. 3a, Extended Data Fig. 2b, Supplementary Fig. 4–7). Importantly, the predictive models generated for each FFF probe were accurate when applied to any other probe dataset (Extended Data Fig. 2c), indicating the models are generalizable. Finally, to ensure that this methodology is compatible with other proteomic search engines, we analyzed a subset of our data with MSFragger51. Critically, we were able to derive similar predictive features and identified similar levels of probe-labeled peptides (Extended Data Fig. 3) indicating this strategy can be integrated with multiple proteomic analysis pipelines.
Figure 3.
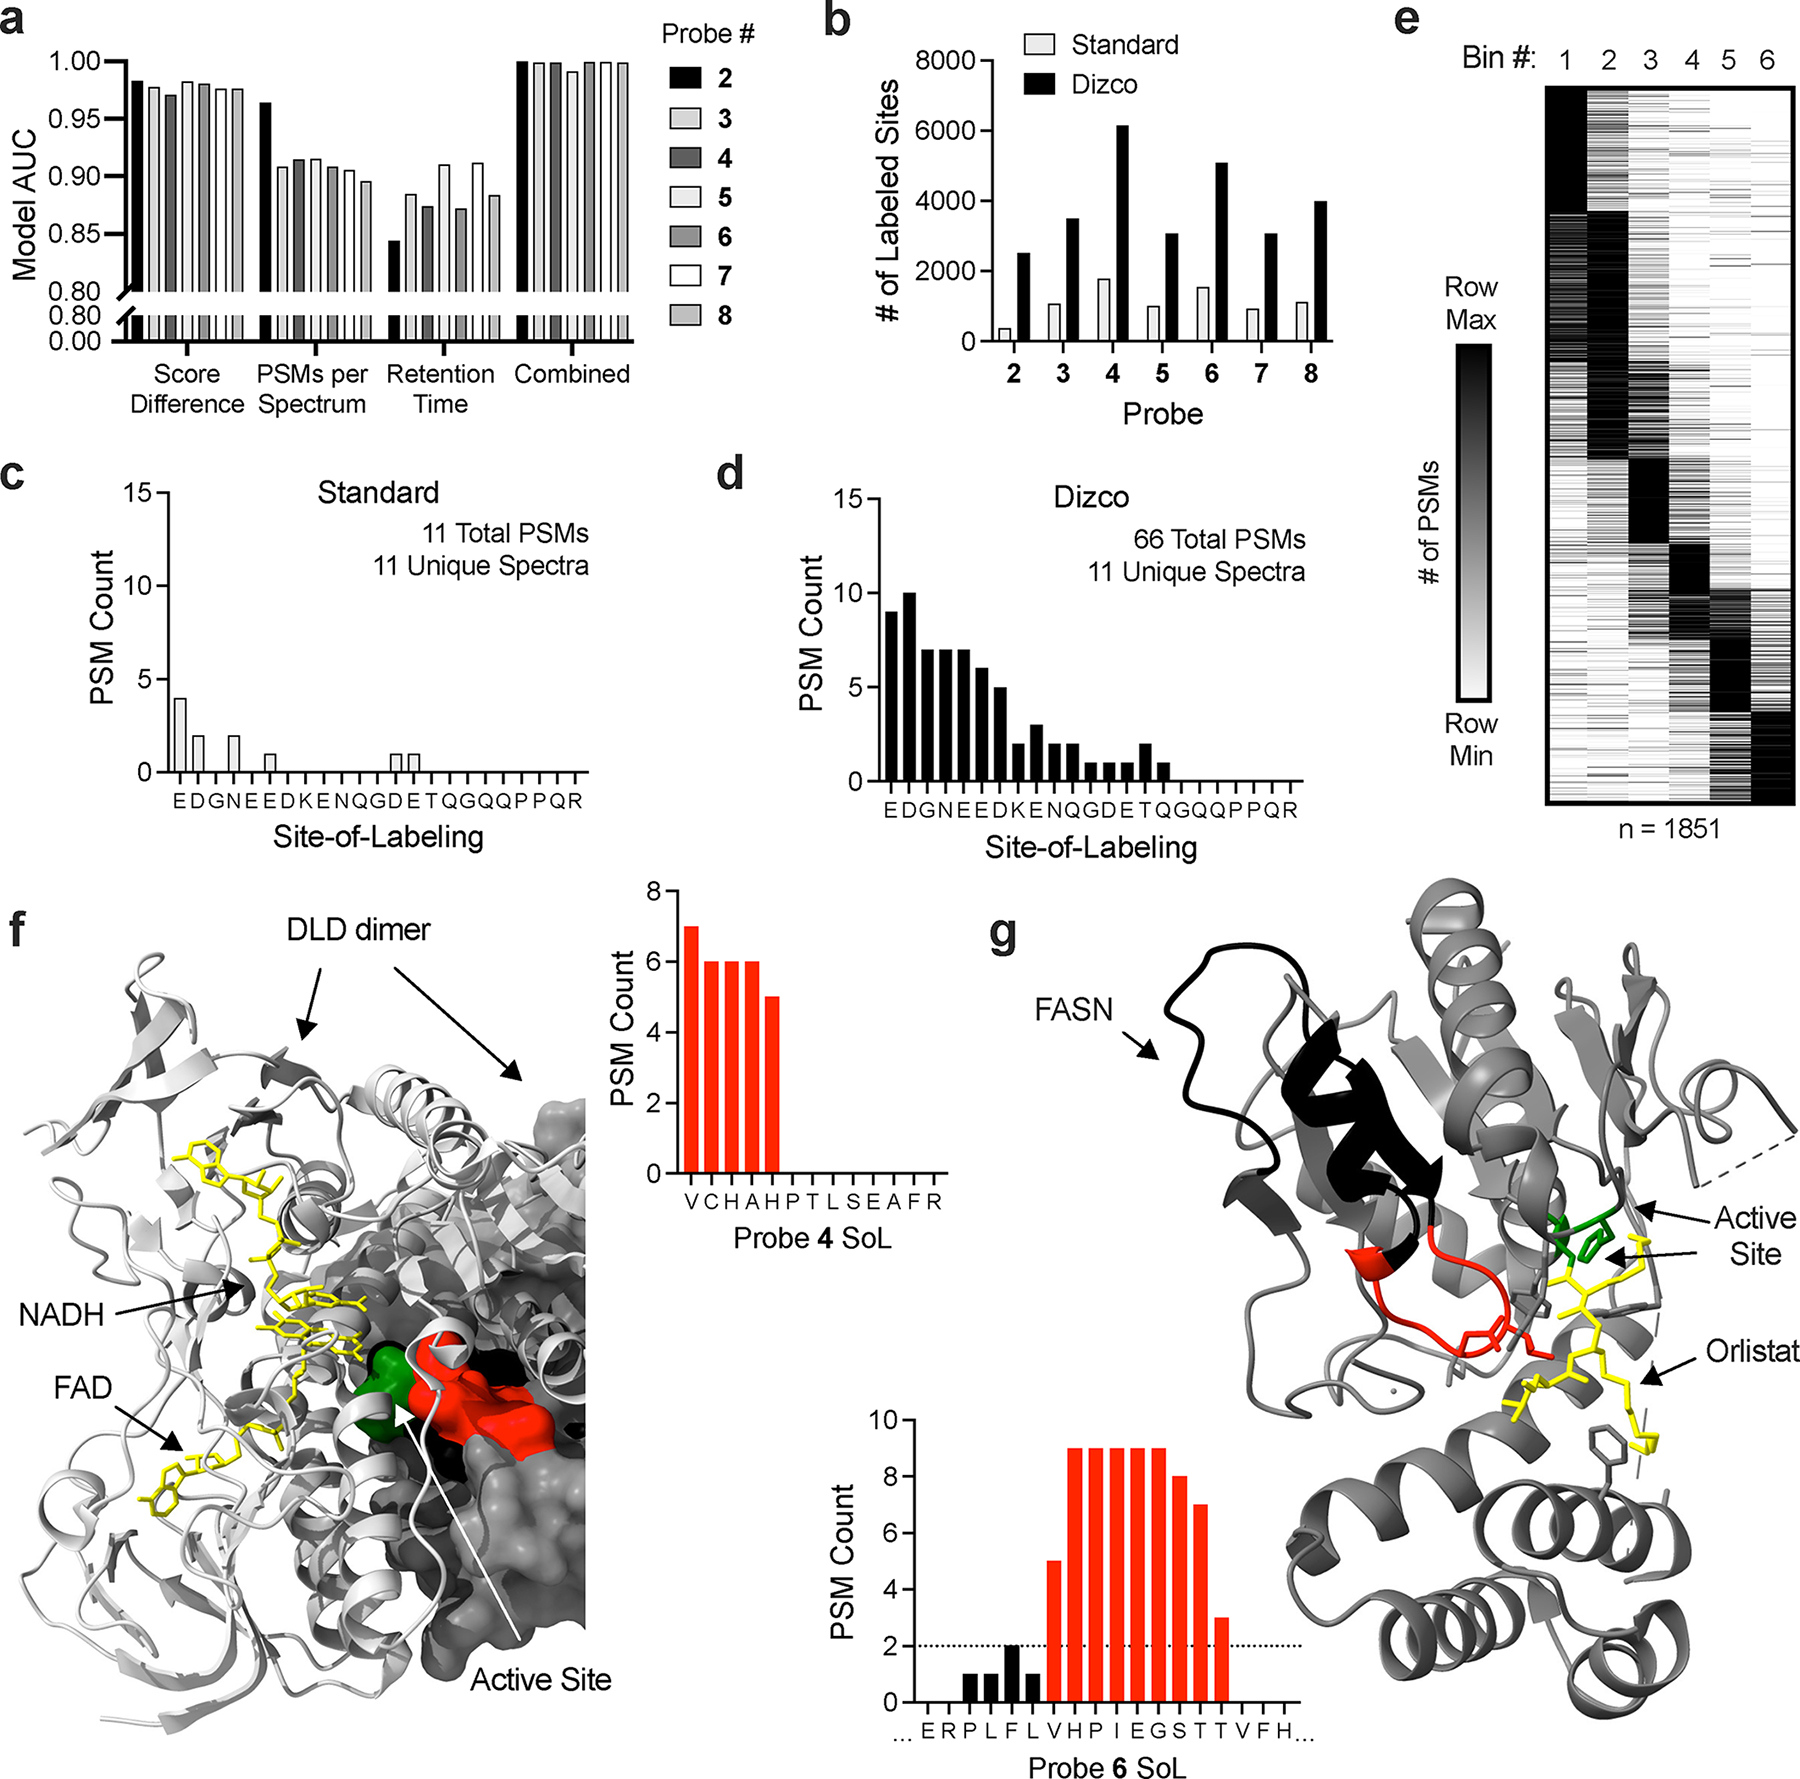
Dizco workflow increases depth of SoL experiments and confidence of label locations. (a) Predictive capabilities of individual model features and combined final models for each probe. (b) Number of labeled sites detected in standard and Dizco workflows. (c-d) Example of a peptide label distribution detected by the standard (c) and Dizco (d) workflows. (e) Clustered heatmap of peptide label locations from the Dizco workflow binned into six bins across peptide sequences. (f-g) Examples of high-confidence sites detected in the Dizco workflow. For all structures, labeled peptide residues are colored red and the remainder of each peptide is colored black. Active/other indicated sites are colored green and co-resolved ligands are colored yellow. (f) DLD probe label site overlapping with active and ligand binding sites (PDB: 1ZMD). (g) FASN probe label site overlapping with active site and inhibitor binding sites (PDB: 2PX6).
Overview of enhanced SoL workflow
Equipped with a better understanding of spectral features corresponding to photoaffinity probe-labeled peptides, we developed a new analysis pipeline to robustly identify probe labeled sites, dubbed Dizco (Diazirine probe-labeled-peptide discoverer). The Dizco workflow retains information on multiple label sites found within chimeric spectra and uses the modeling described above to provide automated, objective confidence measures in probe-labeled peptides. Analysis using the Dizco workflow resulted in >3X more probe labeled residues across all probes (Fig. 3b, Supplementary Dataset 1) and yields a more complete picture of label locations when compared to standard proteomic analyses. Specifically, standard proteomic analyses typically provide sparse labeling information leading to an uncertainty in which residues are adducted (Fig. 3c). In contrast, the Dizco workflow yields a distribution of labeling events over peptide sequences (Fig. 3d), providing a higher resolution measurement of labeling localization. Notably, labeled sites were not randomly distributed across peptide sequences (Fig. 3e), but restricted to a single region for each peptide, consistent with probes engaging proteins in specific binding modes. For example, we observed labeling proximal to the active site of dihydrolipoamide dehydrogenase (DLD; Fig. 3f), a known site accessible to small molecules, as well as fatty acid synthase (FASN; Fig. 3g), where labeling was localized to the Orlistat binding cleft, but not on distal regions of the peptide. Additional examples of probe labeling distributions that overlap known ligand binding sites and/or clear pockets are provided (Supplementary Fig. 8a–k).
Multiplexed binding-site mapping in cells
Though the use of isotopically encoded enrichment tags provides increased confidence in probe-labeled sites, we recognized their limited throughput prevents deeper exploration across different probes or conditions (for example, cell types or probe concentrations) and that, with the increased confidence provided by the Dizco workflow, they become unnecessary. Therefore, we sought integrate the Dizco workflow with TMT-based quantitative proteomics to improve quantitation, throughput, and labeled peptide detection across multiple samples52 (Fig. 4a). Mirroring the benchmarking experiments, photoaffinity probe-labeled peptides identified in the TMT experiment exhibited all the expected spectral features: delta score, number of PSMs and retention time biases (Supplementary Fig. 9a–c). Further, the model trained using isotopically paired peptides from benchmarking experiments possesses similar predictive ability when applied to either the benchmarking (Fig. 3b) or TMT data (Supplementary Fig. 9d–e), indicating that, once the model has been trained, it can be applied to a variety of experiments using distinct sample preparation, LC-MS methods, and quantitative workflows. Overall, we observed highly correlated quantitation at both the whole protein (Supplementary Fig. 9f, Supplementary Dataset 1) and SoL levels (Supplementary Fig. 9g, Supplementary Dataset 1).
Figure 4.
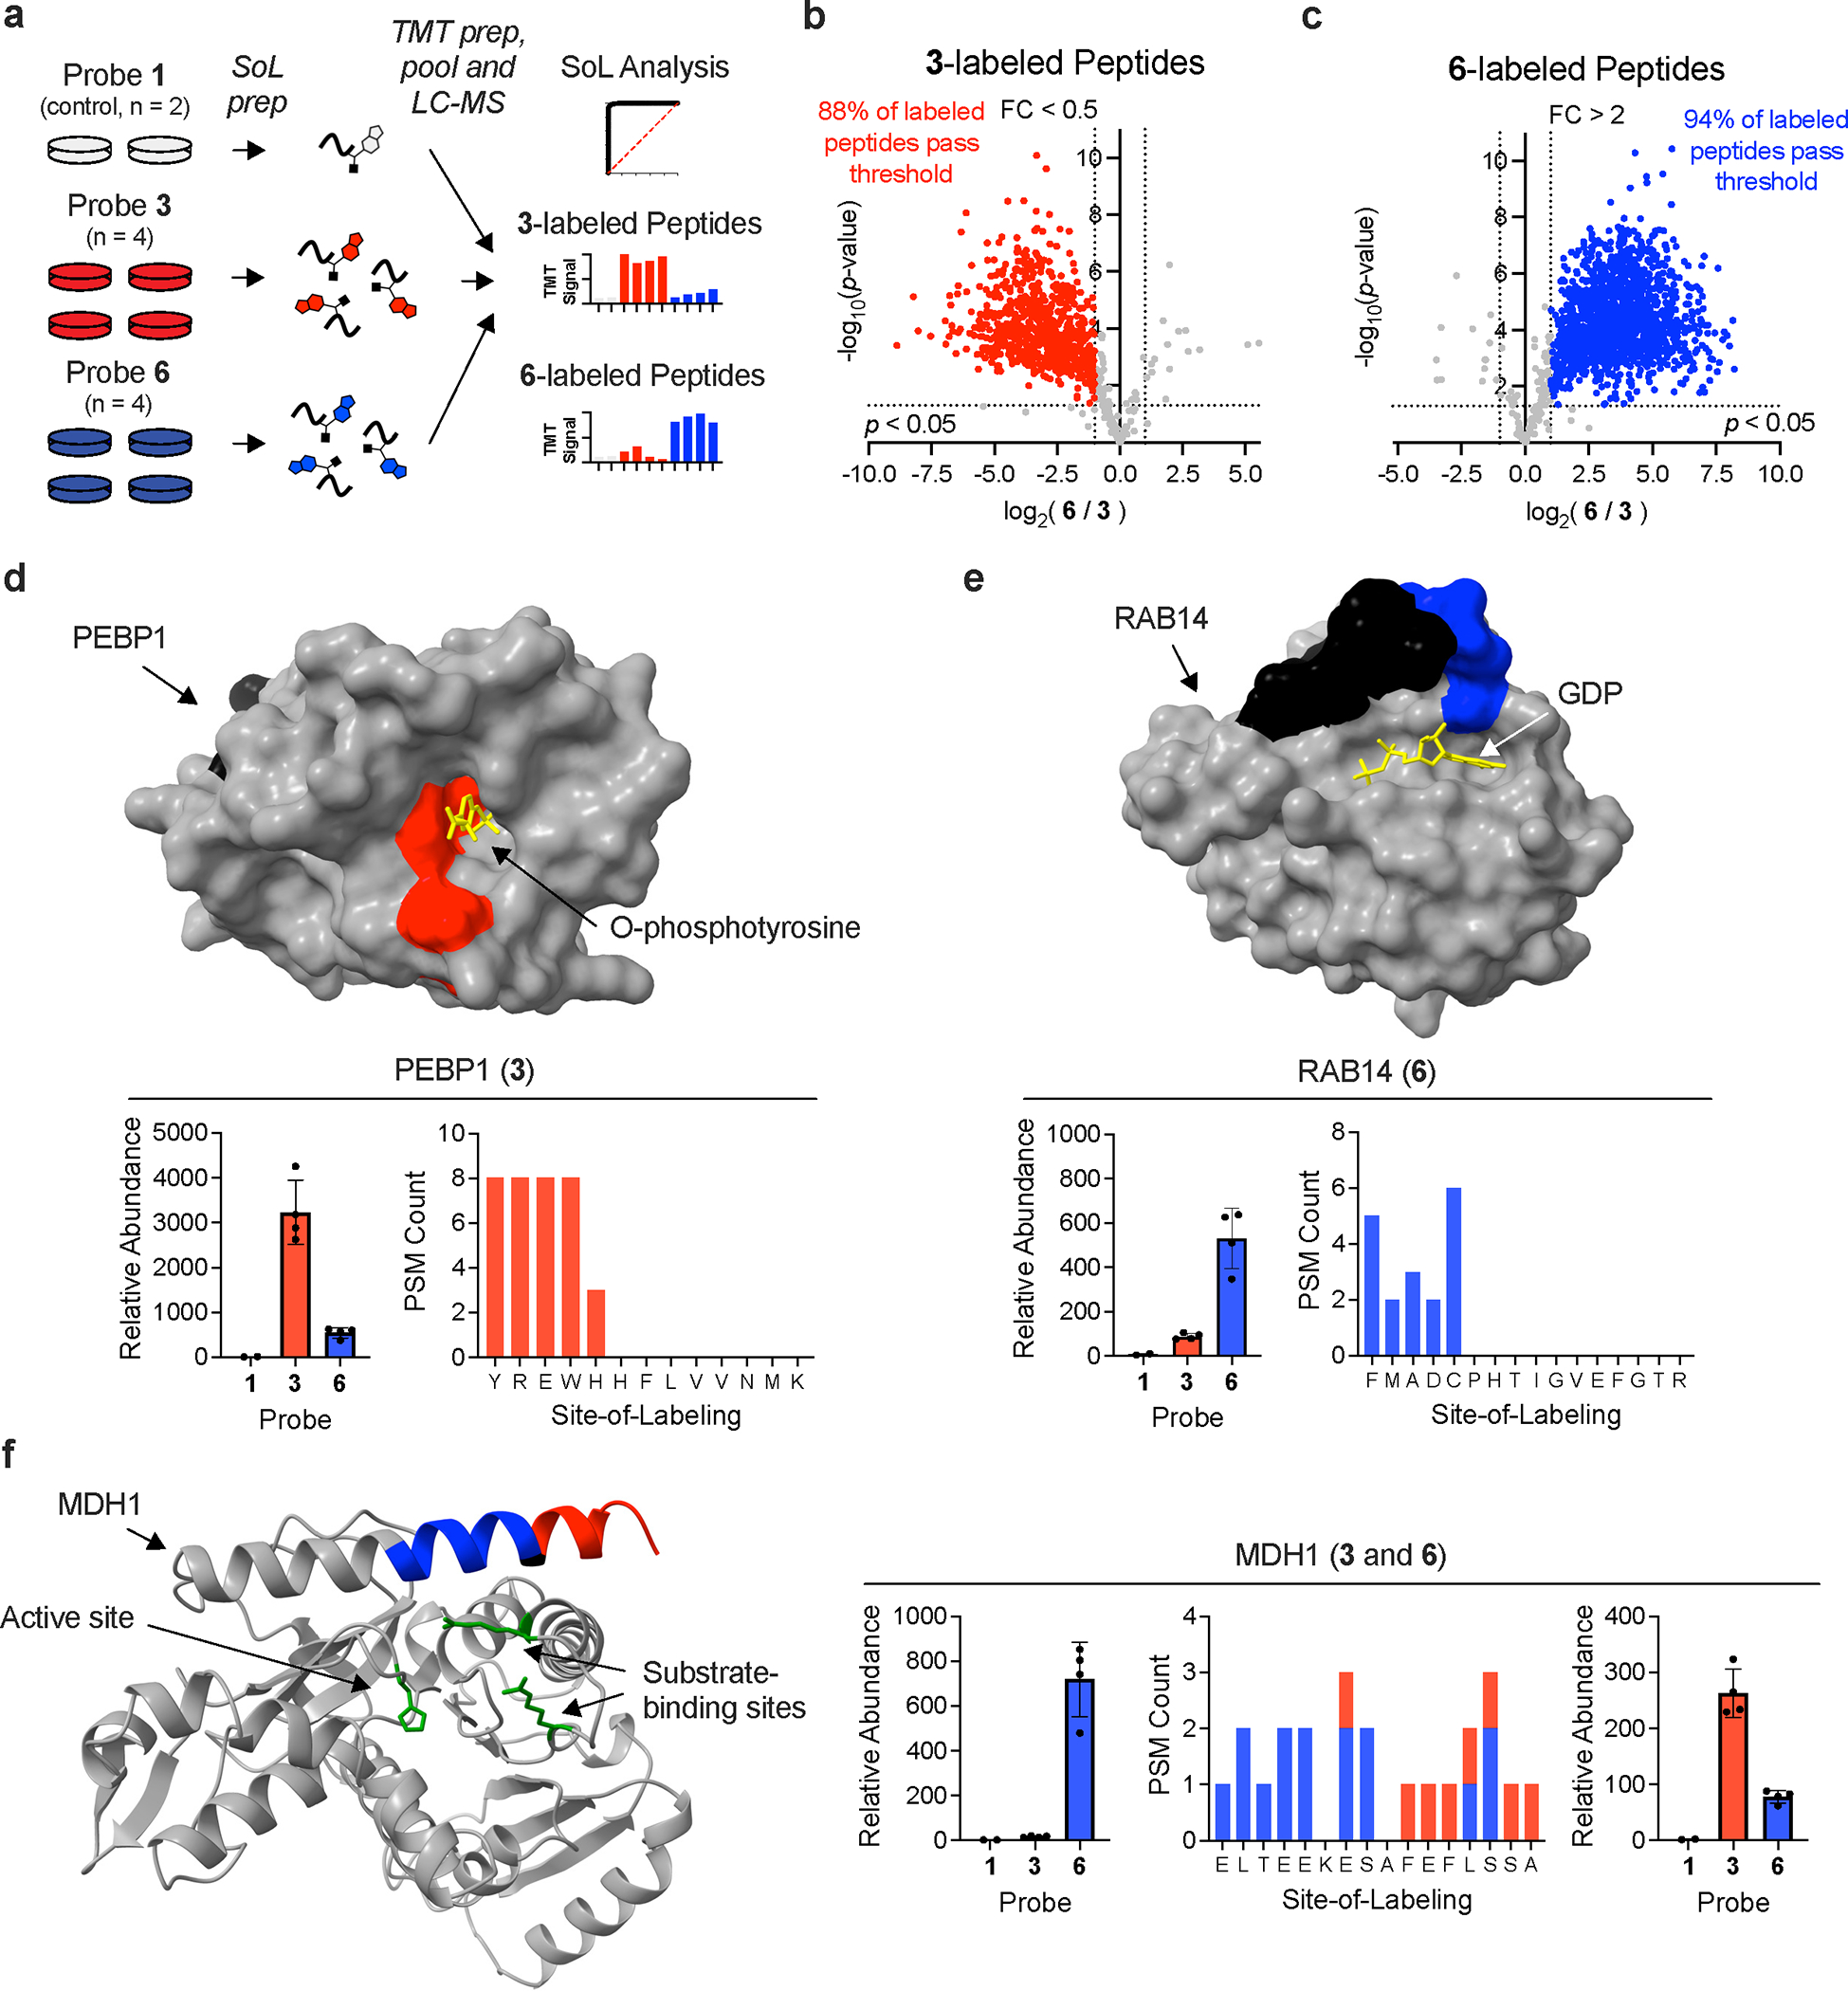
Integration of SoL with multiplexed, quantitative proteomics. (a) Schematic of TMT SoL pilot experiment workflow. (b-c) Volcano plots of peptides labeled with probe 3 (b) and 6 (c). The vertical dashed line corresponds to a fold change of two and the horizontal line corresponds to a p-value of 0.05. Significance was determined using a two-tailed Student’s t-test. Results were analyzed from n = 4 independent biological replicates for FFF probes 3 and 6. Colored circles correspond to probe labeled peptides passing both specified thresholds. (d-f) For all plots, peptide residues labeled by probes are colored red (for probe 3) and blue (for probe 6) and the remainder of each peptide is colored black. Active/other indicated sites are colored green and co-resolved ligands are colored yellow. (d) PEBP1 probe label sites overlapping with O-phosphotyrosine pocket (PDB: 2QYQ). (e) RAB14 probe label sites proximal to GDP binding pocket (PDB: 1Z0F). (f) MDH1 probe label sites proximal to active and substrate binding sites (AF-P40925-F1-model_v2). Error bars for all plots represent the mean −/+ the standard deviation.
We reasoned that the mixture of probe 3 and probe 6-labeled peptides would allow us to assess the accuracy in quantifying peptides from SoL experiments, as modified peptides should have the highest abundance in the channels containing those probes (Fig. 4a). Indeed, we observed this to be the case (Supplementary Fig. 9h–i), and further, a direct comparison of peptides labeled with different probes demonstrated that most peptides are highly enriched (> 85–90% peptides at > 2-fold change and p-value < 0.05) in the expected samples (Fig. 4b–c). Together, these results indicate reliable quantitation of photoaffinity probe-labeled peptides in multiplexed proteomic workflows. Examples of identified sites (Supplementary Dataset 1) include the phospho-tyrosine binding pocket of PEBP153 (Fig. 4d) and the GDP binding pocket of RAB1454 (Fig. 4e), again indicating the detection of sites known to bind endogenous ligands. Interestingly, we also detected peptides of the same sequence but different label distributions for different probes (for example on MDH1, near the substrate binding/active site; Fig. 4f), suggesting that the probes interact with the same binding pocket, but in different orientations depending on the diversifying group.
We next reasoned that the integration of SoL experiments with TMT would afford an efficient means to assess the relative engagement of probe-protein interactions with binding-site level resolution across a concentration range (Fig. 5). Towards this end, we profiled probes 3 and 8, as well as two sets of enantiomeric probe pairs, (R)/(S)-9 and (R)/(S)-10 (Fig. 5a) at multiple concentrations (Supplementary Dataset 1). We previously demonstrated that stereochemically paired probes improve confidence in probe-protein interactions and better reflect true binding preferences due to their matched physicochemical properties27. Once again, we observed excellent agreement between replicates for both 3 and 8 (Supplementary Fig. 10a–d) as well as enantiomeric probes (R)/(S)-9 and (R)/(S)-10 (Supplementary Fig. 10e–h), a clear concentration dependency in expected channels (Supplementary Fig. 11a–h) and high correlation across data levels (Supplementary Fig. 11i–m). Finally, the initial predictive model trained on isotopically confirmed peptides called peptide label status with high-accuracy (Supplementary Fig. 11n–t, Supplementary Dataset 1).
Figure 5.
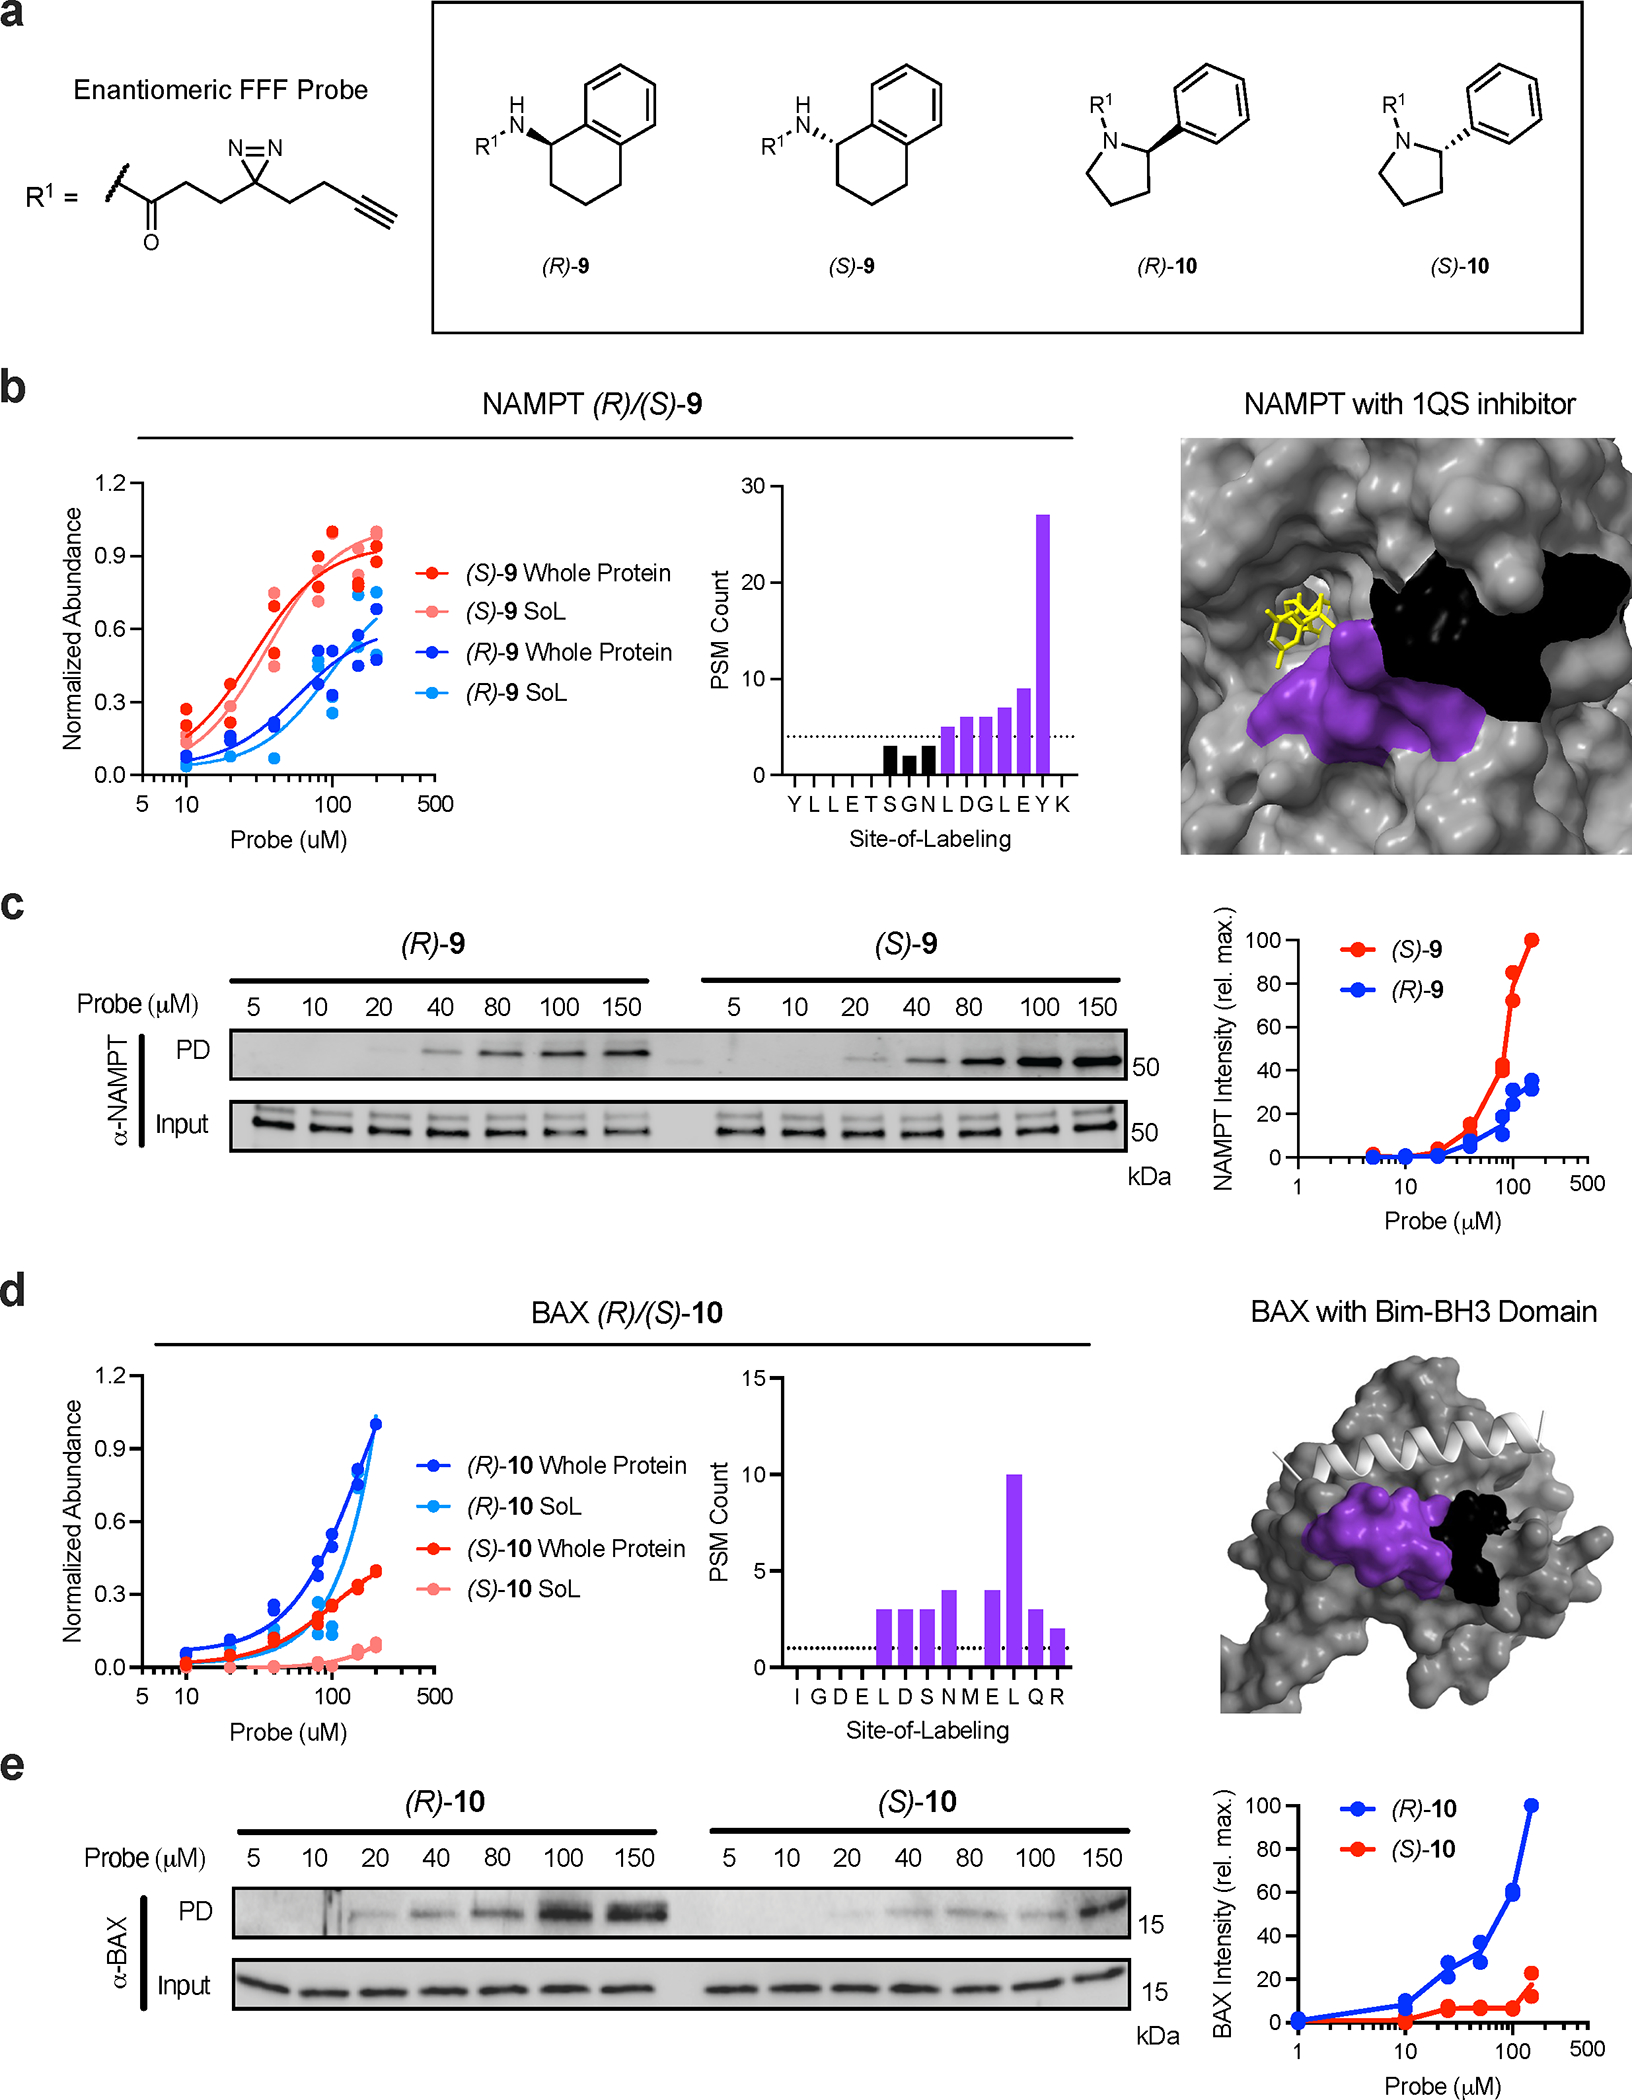
Proteome-wide, site-specific, concentration-dependent, probe-protein interaction profiles. For proteomic experiments, cells were treated with seven different concentrations (10, 20, 40, 80, 100, 150, 200 μM) of FFF probes before being UV crosslinked and processed as indicated in Fig 4a. For all structures, the primary peptide residues labeled by probes are colored purple and the remainder of each peptide is colored black. Co-resolved ligands are colored yellow and other proteins are colored silver. (a) Structures of enantiomeric FFF probes used in the TMT dose experiments. (b) NAMPT concentration plot and probe label site overlapping with known inhibitor (PDB: 4KFO). (c) Immunoblot analysis and quantification of NAMPT stereoselective probe binding. (d) BAX concentration plot and probe label site proximal to the active site (PDB: 4ZIE). (e) Immunoblot analysis and quantification of BAX stereoselective probe binding. Each immunoblot displayed is representative of two independent experiments. (PD = pulldown)
We identified sites with varying relative engagement for all probes (Fig. 5, Supplementary Fig. 12, Supplementary Dataset 1) indicating that differential enrichments are driven by each molecular recognition group. Examples include NAMPT (Fig. 5b; stereoselective for (S)-9 over (R)-9) overlapping with an known inhibitor binding site55, BAX (Fig. 5d; stereoselective for (S)-10 over (R)-10) proximal to the Bim-BH3 binding site56 and GSTM3 (Extended Data Fig. 4a; stereoselective for (R)-9 over (S)-9) proximal to the substrate-binding site (Uniprot annotation). Additional examples of binding sites displaying differential relative engagement curves are provided both 3 and 8 (Supplementary Fig. 12a–h) and enantiomeric probes (Supplementary Fig. 12i–p). We also detected instances of proteins with multiple sites engaged by the same probe for example probe 3 (Extended Data Fig. 5a–f) and probe 8 (Extended Data Fig. 5g–i), that vary in their relative affinities – information that is lost at the whole protein level due to an effective pooling of the signal from all probe-protein interactions.
To validate these differential interactions, we performed probe pulldown experiments and eluted the enriched proteins for analysis via immunoblot. As expected, each target displayed dose-dependent labeling with respective probes (Fig. 5c, e, and Extended Data Fig. 4b) that reflected stereo-preferences observed in proteomics experiments. In addition, we demonstrated dose-dependent, stereoselective blockade of target protein enrichment with excess cognate, non-photoreactive, enantiomeric competitor molecules (for NAMPT and GSTM3; Extended Data Fig. 4c–d). We also sought to verify the binding to target proteins using an orthogonal biophysical measurement that does not require photoactivation, cellular thermal shift assay (CETSA)57. Here, we examined multiple interactions (ACAT2, EPHX1 and PMPCA), and observed marked stabilization by treatment with corresponding probes over an applied temperature gradient (Extended Data Fig. 6a, d, g). Notably, we observed the thermal stabilization to be concentration-dependent (Extended Data Fig. 6b, e, h) and within the approximate range measured in corresponding MS-based studies (Extended Data Fig. 6c, f). Collectively, these data confirm that differences in probe-binding site interactions measured in the Dizco workflow are reflective of authentic binding events.
Global knowledge-based analysis of ligandable binding sites
Together, the datasets herein contain 3603 unique labeled peptides across 1669 proteins derived from experiments performed directly in live cells (Supplementary Dataset 1), representing the largest single database of reversible small molecule ligandability profiling to our knowledge. Only a small fraction of enriched proteins (15%) and identified labeled sites (26%) have annotated ligands in the DrugBank database (Fig. 6a) and span a diverse array of protein functional classes (Fig. 6b). To further assess the potential of the identified sites to accommodate small molecules, we set out to comprehensively align our binding site data with protein structures. With the advent of accurate structure prediction algorithms (e.g., AlphaFold (AF)58,59), we reasoned that integrating predicted protein structures with our dataset could provide critical context for the identified sites. Overall, we mapped 3291 peptides to 1500 protein structures, and, as observed in our preliminary assessment of selected probe-proteins interactions with PDB structures (Supplementary Fig. 8a–k, Supplementary Dataset 1), many labeling events overlapped known ligand binding sites and/or clear pockets in AF structures (Supplementary Fig. 13a–k), supporting their assignment as small molecule binding pockets.
Figure 6.
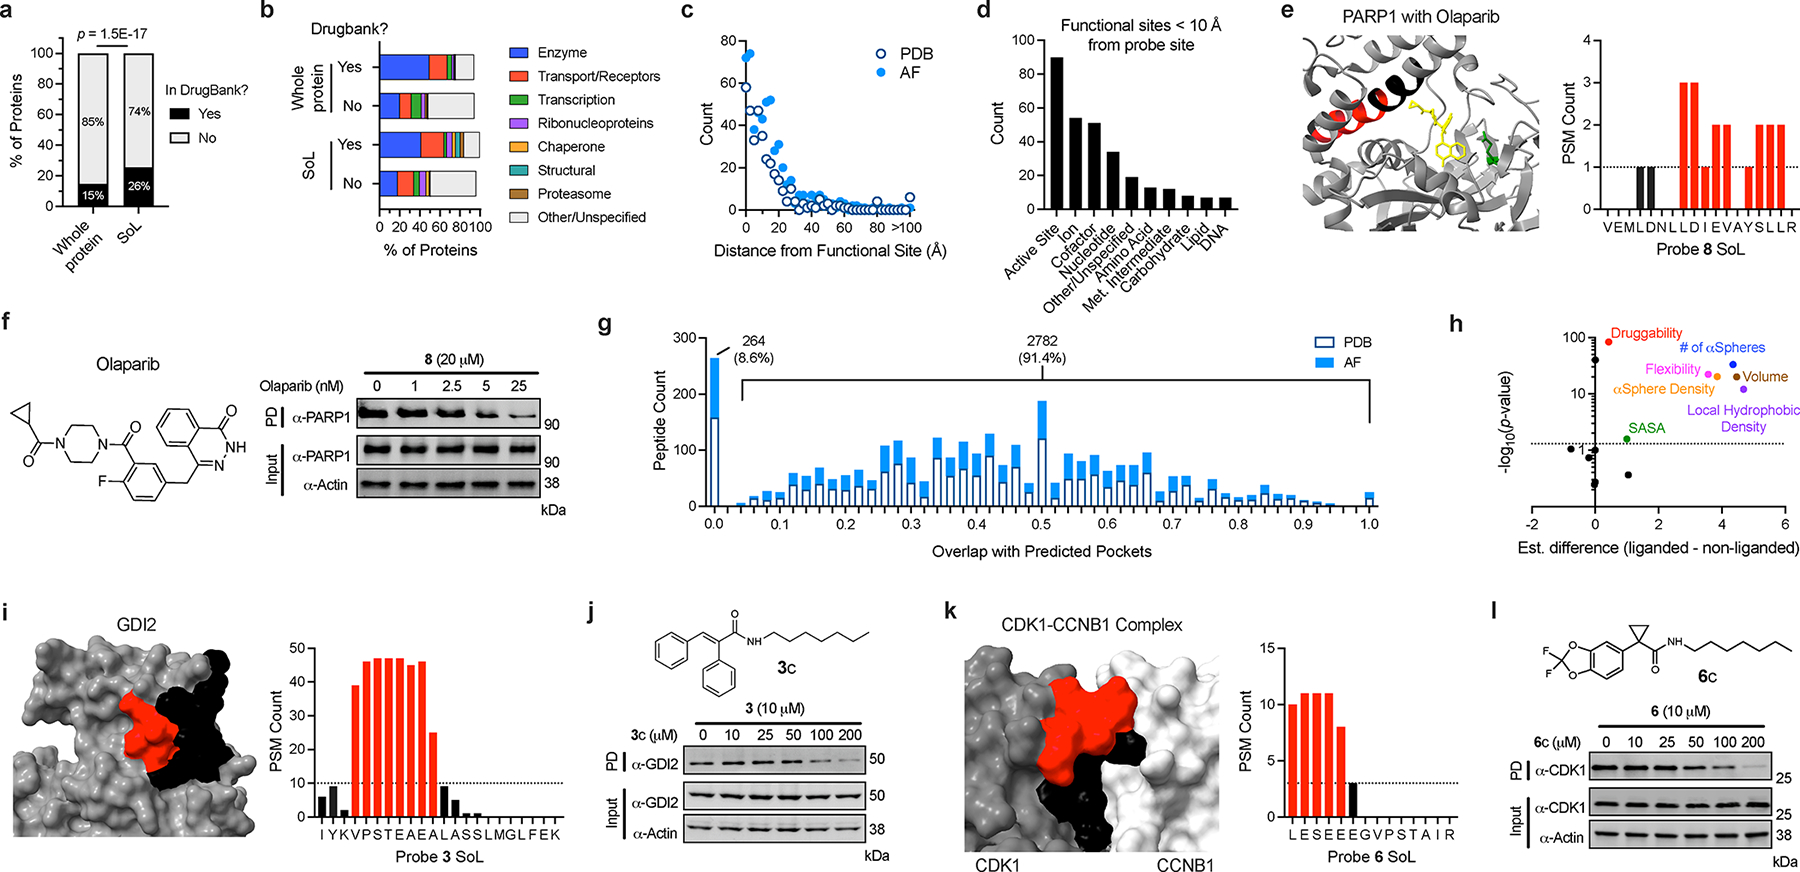
Global knowledge-based analysis of ligandable binding sites. (a) Categorization of probe targets based on their presence in Drugbank. Significance was determined using a Chi-squared test. (b) Categorization of probe targets based on their protein class. (c) Distances of functional sites from probe-modified peptides mapped to PDB and AF structures. (d) Categorization of functional sites found proximal to probe-modified peptides (Met. = Metabolic). For all structure plots, peptide residues labeled by probes are colored red and the remainder of each peptide is colored black. Active/other indicated sites are colored green and co-resolved ligands are colored yellow. (e) PARP1 probe 8 label sites overlapping with Olaparib-binding site (PDB: 7KK4). (f) Immunoblot analysis and quantification of competitive blockade of probe 8-PARP1 interaction using Olaparib. (g) Overlap of probe-modified peptides with predicted pockets (Fpocket algorithm) in PDB and AF structures. (h) Comparison of features between liganded and non-liganded pockets (significance and estimated difference in location was determined via Mann-Whitney U Test; SASA = solvent exposed surface area). (i) GDI2 probe 3 label sites within predicted pocket (AF-P50395-F1_v2). (j) Immunoblot analysis of competitive blockade of probe 3-GDI2 interaction using a cognate competitor analog 3c. (k) CDK1 probe 6 label sites within predicted pocket (PDB: 4Y72). (l) Immunoblot analysis of competitive blockade of probe 6-CDK1 interaction using a cognate competitor molecule 6c. Each immunoblot displayed is representative of two independent experiments. (PD = pulldown)
To analyze these binding sites in a systematic manner, we measured labeled peptide distance from annotated functional sites as well as overlap with predicted pockets (Fpocket algorithm60). Probe-mapped sites were binned based on their distance from annotated functional sites (Fig. 6c) and we observed that most labeling events overlapped directly with functional sites (0 – 2.5 Å) with the count decreasing as a function of increasing site distance. Among the annotated functional sites were active sites, ion-, cofactor- and nucleotide-binding sites (Fig. 6d) and to a lesser extent, lipid-, carbohydrate-, amino acid-, and DNA binding sites, highlighting the diverse pockets engaged by FFF probes. Provided that many of the mapped pockets have functional ligands, we sought to confirm that the probe and ligand share a binding site. We selected four representative proteins, including 1) poly [ADP-ribose] polymerase 1 (PARP1) that binds probe 8 and the clinically approved inhibitor olaparib61 (Fig. 6e); 2) a mitochondrial bifunctional enzyme (MTHFD2) that binds probe 6 and the inhibitor LY34589962 (Extended Data Fig. 7a); 3) an acetyl-CoA acetyltransferase (ACAT2) that binds probe 8 and acyl-CoA63 (Extended Data Fig. 7c), 4) a lysophosphatidylserine lipase (ABHD12) that binds probe 3 and the covalent inhibitor DO26464 (Supplementary Fig. 12a). In each instance, we found that the probe interactions with target proteins were competitively blocked with increasing concentrations of the ligand (Fig 6f; Extended Data Fig. 7b, d–e). Notably, in instances where the approximate activity for the target is known (e.g. PARP1, ABHD12, ACAT2), we observed a correlation between the concentrations required for probe displacement and their relative activities. Together, these studies highlight the ability to identify functional binding pockets and report on their engagement by underivatized small molecules.
Given that the Dizco workflow provides a higher resolution of measurement diazirine site adduction, we hypothesized this information could be integrated with molecular docking to predict probable binding modes and gain insight into the components that dictate probe recognition. To investigate this further, we obtained atomic structures for a subset of interactions (108 from PDB structures and 67 from AF structures), then blindly docked every probe into every predicted pocket and cross-referenced the results to the proteomics data. We found the protocol was highly effective at predicting the correct binding pocket for each target, prioritizing the site identified via proteomics among all predicted pockets. Moreover, the docking analysis was successful at providing poses that oriented diazirine moieties proximal (≤ 6 Å) to probe adducted residues with a success rate of 69% and 66% for PDB and AF structures, respectively (Supplementary Fig. 14a–b), in line with previously reported65 docking success rates for PBD structures compared to AF.
From this analysis, we identified low-energy binding modes across a variety of functional sites, including enzyme active sites (e.g. ATP binding site of MAP3K7/TAK1; Supplementary Fig. 14c), signaling domains (e.g. cAMP binding site on PRKAR2A; Supplementary Fig. 14d), cofactor binding sites (e.g. NADPH on RTN4IP1; Supplementary Fig. 14e), chromatin reader domains (e.g. PWWP1 domain of NSD2; Supplementary Fig. 14f), substrate binding domains (e.g. substrate binding cleft of PPPC5; Supplementary Fig. 14g) and protein-protein interfaces (e.g. GINS1/2/3 and ELOB/C complexes; Supplementary Fig. 14h–i). In addition, we identified docking poses for all previously validated interactions described above (Supplementary Fig. 15a–i). For proteins with multiple sites displaying distinct EC50s with the same probe, docking revealed insights into the molecular basis for their apparent affinities. For instance, probe 3 was docked to both low and high EC50 sites on CYP51A1 (Supplementary Fig. 14j). However, docking suggests that the binding to the two sites is different: the high EC50 site is shallow and solvent exposed, while the low EC50 site is embedded deep inside the protein, providing a rationale for the differential engagement. Moreover, the amide carbonyl moiety of probe 3 establishes a hydrogen bond with the backbone NH of I456, which supports better binding to the low EC50 site. Similarly, probe 3 was docked to two sites for NENF (Supplementary Fig. 14k). Again, the high EC50 site is more open, weakening the hydrogen bond between the amide carbonyl of probe 3 and R146, compared to the hydrogen bonds with Y82 and Y137 in the low EC50 site. Together, these docking results provide support for the interactions identified in the proteomic studies and, more so, demonstrate the utility of how these integrated data can be leveraged to characterize small molecule binding pockets directly in live cells.
While a subset of binding sites are associated with established function, many probe-modified peptides mapped to sites lacking functional annotation in Uniprot or ligands in DrugBank/ChEMBL, highlighting the utility of this approach to furnish evidence for novel small molecule binding pockets in cells. We recognized this as an opportunity to provide additional characterization of these newly identified small molecule binding sites. We found that the majority of probe labeled peptides (~91%) overlapped with predicted small molecule-binding pockets (Fig. 6g, Supplementary Dataset 1), and this distribution was generally equivalent across PDBs and AF structures. Further, a direct comparison of the descriptors of liganded and non-liganded pockets indicates that, relative to all pockets predicted by Fpocket, identified binding sites were associated with features characteristic of small molecule binding pockets (Fig. 6h). We prioritized a subset of these interactions for validation, specifically instances where the probe had high overlap with predicted pockets with no previously reported evidence of small molecule ligands, including GDI2 (Fig. 6i), CDK1-CCNB1 complex (Fig. 6k), PMPCA (Extended Data Fig. 8a), ACAD9 (Extended Data Fig. 8b), and PCYOX1L (Extended Data Fig. 8d). We first examined the docking on these targets, which revealed high ranking binding poses that align with the site of adduction identified via proteomics (Supplementary Fig. 15i–m). We then validated these interactions through orthogonal readouts including CETSA (for PMPCA; Extended Data Fig. 6g–h) as well as endogenous protein enrichment experiments (for GDI2, CDK1-CCNB1, ACAD9, and PCYOX1L; Extended Data Fig. 8c, e–g). Further, we demonstrated that enrichment of these targets can be blocked upon co-incubation with non-photoreactive analogs in a dose-dependent fashion (for GDI2 and CDK1; Fig. 6j, l).
Discussion
In the current work, we identified features of photoaffinity probe-labeled peptides and used this information to improve confidence and coverage of binding sites identified on endogenous proteins in cells. Critical to this advancement is the finding that photoaffinity probe-modified peptides generate chimeric spectra during MS analysis. While the complicating effects of chimeric spectra have been documented for standard proteomic experiments46, the robust identification of such chimeric spectra arising from probe-adducted peptides has, to our knowledge, not been reported. Importantly, our results indicate this phenomenon occurs broadly across various chemotypes, suggesting it is a general feature of photoaffinity probe-labeled peptides. Combining this information with other biased features of probe-modified peptides, enabled the development of an automated “Dizco” workflow to objectively assign confidence scores to labeled peptide identifications. We demonstrate the utility of the Dizco workflow by integrating photoaffinity site mapping experiments with quantitative, multiplexing reagents for the first time, providing reproducible and accurate quantification of probe-labeled peptides simultaneously across multiple conditions. Specifically, this multiplexed workflow enabled the construction of proteome-wide, site-specific, probe-protein concentration profiles directly in live cells. Finally, we highlight how experimental binding site data, when coupled to structural information and docking, can provide molecular characterization at well-established and new small molecule binding sites across the proteome (Fig. 6, Extended Fig. 7–8).
While these advancements represent an improvement in binding site mapping for photoaffinity probes, some challenges remain. First, chimeric spectra inherently tend to have lower quality scores than pure spectra due to unassignable, contaminating fragment ions, presenting technical challenges for any analytical workflow46. Moreover, the delta score metric, used in this study to discriminate labeled from unlabeled peptides, is also useful in distinguishing true vs. false matches in standard proteomic searches47,66,67, rendering conventional search algorithms suboptimal for identifying photoaffinity probe-adducted peptides. Thus, while this work has improved our understanding of localizing photoaffinity probe adducts, we believe these challenges still impact the precision of such measurements, particularly for peptides with low coverage. Alternative fragmentation strategies (e.g., Electron-transfer dissociation) may enable preferential fragmentation of the peptide backbone, leaving the attached probe intact, thereby increasing confidence in the assigned adducted peptides. Moreover, dedicated chemoproteomic search algorithms that consider chimeric spectra and probe fragmentation have the potential to further improve dataset quality. Additionally, the development of cleavable tags that leave behind a standardized reporter group68,69 could reduce the potential for unexpected probe fragmentation, improve labeled peptide identification, and enable the direct comparison of peptides labeled with different probes in multiplexed experiments. Finally, while the current work focused the application of Dizco to map fragment-based probes, we believe that it can facilitate the identification of binding sites for any photoaffinity probe.
Powerful chemoproteomic strategies have been developed to assess family-wide enzymatic activity70–72, amino acid side chain reactivity/ligandability10,15,42,73, and, more recently, non-covalent ligandability26,27,44, which subsequently, have been used to develop chemical probes that regulate protein function14. In the first two categories, broadly reactive probes (fluorophosphate-based probes for serine hydrolases70 or iodoacetamide-based probes for reactive cysteines42, for example) are often employed as reporters of binding site-level occupancy for covalent ligands. However, there is no equivalent ‘universal’ probe to broadly assess protein sites that accommodate non-covalent ligands in native systems. As an alternative, we envision a strategy that uses an array of photoaffinity probes to maximize coverage of small molecule binding sites. In the context of drug discovery, a priori knowledge of small molecule-protein interaction sites can assist in developing more potent and selective compounds for targets of interest. In this vein, when we collated our experimentally mapped sites with structural data, we observed that FFF probes engage diverse functional sites on proteins (Fig. 6a–d) and can report on binding site occupancy of various small molecules, such as inhibitors, co-factors, and clinically approved drugs, directly in cells (Fig. 6e–f, Extended Data Fig. 7). Additionally, we foresee that the broad integration experimental SoL data and molecular docking not only provides retrospective insight into the molecular details governing these identified interactions, as shown here, but also an opportunity to leverage the synergy of these approaches for ligand design and optimization.
Finally, we identified many binding pockets that have no reported ligands, highlighting the ability to provide the first evidence of their chemical tractability. Once a ligandable site is found on a protein, these probes can serve as leads for further optimization26, or be employed as “pocket probes” in conjunction with larger, conventional, compound libraries to identify more potent and selective molecules via probe displacement readouts74. Even if an identified liganding event has no effect on the function of a specific protein, we anticipate that such ‘silent’ binders can be leveraged for other applications, such as chemically-induced proximity75. For example, we identified binding sites on numerous ubiquitin proteasome system members (Supplementary Dataset 1), including sites various components of E3 machinery (e.g. CUL2, CUL4B, SYVN1, UBE2N, UPS5), that have the potential to be utilized for such approaches. Projecting forward, we expect that the broad implementation of this strategy will empirically expand our understanding of the ligandable proteome and, in turn, significantly augment the development of chemical probes for investigations into human biology and translational applications.
Methods
Antibodies and reagents
Anti-GSTM3 polyclonal antibody (15214-1-AP, 1:1000), PMPCA polyclonal antibody (26536-1-AP, 1:1000), PARP1 monoclonal antibody (1D7D4) (66520-1-Ig, 1:5000), GDI2 polyclonal antibody (10116-1-AP, 1:2000) were purchased from Proteintech. Anti-ACAT2 monoclonal antibody (E1L8V) (#13294, 1:1000), anti-ACAD9 polyclonal antibody (#9796, 1:1000), anti-BAX polyclonal antibody (#2772, 1:1000), anti-PBEF/NAMPT monoclonal antibody (D7V5J) (#86634, 1:1000) were from Cell Signaling Technology. Anti-MTHFD2 polyclonal antibody (ab151447, 1:1000), anti-ABHD12 monoclonal antibody (EPR13683-72) (ab182011, 1:1000), anti-mouse-HRP Goat polyclonal antibody (ab6789, 1:10000) and anti-rabbit-HRP Goat polyclonal antibody (ab6721, 1:10000) were purchased from Abcam. Anti-CDK1 monoclonal antibody (A17) (33–1800, 1:1000), anti-PCYOX1L polyclonal antibody (PA5-57955, 1:1000) were from Invitrogen. Anti-mEH (17) polyclonal antibody (sc-135984, 1:200) was from Santa Cruz Biotechnology. Rhodamine labeled Actin (12004164, 1:10000) hFAB was obtained from Bio-Rad.
Commonly used reagents were purchased from Corning, Gibco, Bio-Rad, Research Product International (RPI), Sigma-Aldrich and Thermo Fisher Scientific. Biotin-PEG3-Azide (AZ104) was from Click Chemistry Tools. Sequencing Grade Modified Trypsin (V5111) was purchased from Promega. Pierce Streptavidin Agarose (20353), Pierce High pH Reversed-Phase Fractionation Kit (84868), TMT10plex™ Isobaric Label Reagent Set (90406), TMTpro™ 16plex Label Reagent Set (A44520), Halt Protease Inhibitor (78438) were from Thermo Fisher Scientific. Specific chemical reagents originated from the following sources: Olaparib (MedChemExpress, HY-10162); DO264 (Cayman Chemical, 29402); LY345899 (Cayman Chemical, 36627); Coenzyme A (Cayman Chemical, 16147).
Cell Culture
HEK293T cells (ATCC) were cultured at 37 °C and 5% CO2 in Dulbecco’s Modified Eagle Medium (DMEM) supplemented with 10% Fetal Bovine Serum (FBS), 1% (v/v) penicillin/streptomycin, and 2 mM glutamine.
Chemoproteomic Sample Preparation
HEK293T cells were grown in 10 cm dishes to ~90% confluence at the time of treatment. Cells were treated with compounds in serum free media at concentrations indicated in respective figures for 30 minutes (min). Following compound treatment, cells were irradiated for 20 min at 365 nm at 4 °C to induce protein crosslinking. Crosslinked cells were harvested by cell scraping and washed 2X with Dulbecco’s phosphate-buffer saline (DPBS) on ice before cell lysis. Cells were lysed in ice-cold DPBS using a Branson Sonifier probe sonicator (7 pulses, 15% amplitude). Following lysis, protein concentration was determined using a DC Protein Assay (Bio-Rad) and 1 mg of proteome was aliquoted in 500 μl DPBS for downstream processing. Copper-catalyzed “click” chemistry was performed by pre-mixing and adding the following (per sample): 30 μl Tris[(1-benzyl-1H-1,2,3-triazol-4-yl)methyl]amine (TBTA, 1.7mM in DMSO-tBuOH (1:4 v/v)), 10 μl CuSO4 (50 mM), 5 μl biotin-azide enrichment tag (10 mM in DMSO) and 10 μl Tris(2-carboxyethyl)phosphine (TCEP, 50 mM). For benchmarking whole protein enrichment experiments, biotin-PEG4-azide (Chempep) was used as the biotin-azide enrichment tag. For benchmarking SoL experiments, in-house synthesized acid-cleavable biotin-azide enrichment tags (compounds 11 and 12) were used19. For the TMT-based whole protein enrichment and SoL experiments, only the light acid-cleavable biotin-azide enrichment tag was used (compound 11). The click reaction was carried out for 1 hour (hr) at room temperature (RT) with a gentle shake. Proteins were precipitated by addition of 2 ml ice-cold methanol:chloroform (4:1) followed by 1 ml ice-cold DPBS and precipitated proteins were pelleted by centrifugation. Protein pellets were washed 2X with 2 ml methanol:chloroform (4:1) before being resuspended in 500 μl 6 M urea in DPBS. Protein reduction was carried out by addition of 50 μl of 1:1 pre-mixed TCEP (200 mM in DPBS) and K2CO3 (600 mM in DPBS) and incubation at 37 °C for 30 min. Reduced proteins were alkylated with 70 μl iodoacetamide (IAA, 400 mM in DPBS) for 30 min at RT in the dark. Following alkylation, 130 μl of 10% sodium dodecyl sulfate (SDS) was added and samples were diluted to 5.5 ml with DPBS (final SDS concentration ~0.2%). Pre-washed (3X with DPBS) streptavidin agarose beads (Pierce) were added to each sample (100 μl per sample) and proteins were enriched for 1.5 hr at RT with gentle rotation. Streptavidin beads were pelleted by centrifugation and washed 1X with 5 ml 0.2% SDS in DPBS, 2X with DPBS and 2X with H2O. Washed beads were transferred to Protein LoBind tubes (Eppendorf) using 100 mM triethylammonium bicarbonate (TEAB) buffer and 200 μl of a trypsin digest solution (2 μg trypsin, 1 mM CaCl2 in 100 mM TEAB) was added to each sample. Proteins were allowed to digest overnight at 37 °C with a gentle shake. Digested peptides (whole protein enrichment) were separated from streptavidin beads using pre-washed (1X with H2O) spin filters (Corning) and retained for downstream analysis. For SoL experiments, beads were washed 1X with 500 μl 0.2% SDS in DPBS, 2X with 500 μl 150 mM NaCl in DPBS, and 2X with 500 μl H2O. Washed beads were transferred to Protein LoBind Tubes using H2O for release of labeled peptides. Labeled peptides were released from streptavidin beads with 2X 1 hr incubations in 200 μl 2% formic acid followed by 1X 1 hr incubation in 400 μl 1% formic acid in 50% acetonitrile. For non-quantitative SoL experiments, samples were dried, resuspended in 0.1% trifluoroacetic acid (TFA) and desalted with Strata-X polymeric reversed phase columns (Phenomenex). For all other experiments, samples were dried, resuspended in 100 μl 30% acetonitrile, 100 mM TEAB and labeled with tandem-mass-tag (TMT) reagents (Thermo) according to manufacturer instructions. TMT-labeled samples were pooled, dried and fractionated with the Pierce™ High pH Reversed-Phase Peptide Fractionation Kit (Thermo) using the following gradient (% acetonitrile in 0.1% TEA; F1: 5%, F2: 7.5%, F3: 10%, F4: 12.5%, F5: 15%, F6: 17.5%, F7: 20%, F8: 22.5%, F9: 25%, F10: 30%, F11: 50%, F12: 95%). Fractions were then combined into six fractions by the following scheme: F1+F7, F2+F8, F3+F9, F4+F10, F5+F11, F6+F12 and dried prior to LC-MS analysis.
LC-MS Analysis
Three different LC-MS methods were used to analyze samples in this study: non-quantitative SoL, TMT-quantified whole protein enrichment and TMT-quantified SoL.
For non-quantitative SoL, samples were resuspended in 15 μl and 5 μl was loaded onto the analytical column. Samples were loaded with 2% buffer B (0.1% formic acid in 100% acetonitrile) for 10 min then eluted with a gradient of 2–35% buffer B over 80 min, 35–60% buffer B over 8 min, 60–95% buffer B over 2 min, 95% buffer B for 8 min, 95–2% buffer B over 2 min and 2% buffer B for 10 min (120 min total). Eluted peptides were analyzed with a Thermo Fisher Orbitrap Fusion Lumos mass spectrometer with a cycle time of 3 seconds (s), 2000 V applied to the column and the following settings. MS1 scans: Orbitrap mass analyzer, resolution of 60,000, scan range of 375 – 2000 m/z, dynamic exclusion of 30 sec, AGC target of 4 × 10⁵, maximum injection time of 50 ms. Peptide isolation and fragmentation: quadrupole isolation of 1.6 m/z, higher-energy collision dissociation (HCD) collision energy of 28%. MS2 scans: Orbitrap mass analyzer, resolution of 15,000, first mass of 120, AGC target of 5 × 10⁴, maximum injection time of 110 ms.
For TMT-quantified whole protein enrichment, samples were resuspended in 20 μl and 3 μl was loaded onto the analytical column. Samples were loaded with 2% buffer B for 10 min then eluted with a gradient of 2–25% buffer B over 155 min, 25–45% buffer B over 10 min, 45–95% buffer B over 5 min, 95% buffer B for 2 min, 95–2% buffer B over 1 min, 2% buffer B for 2 min, 2–95% buffer B over 1 min, 95% buffer B for 2 min, 95–2% buffer B over 1 min, and 2% buffer B for 11 min (200 min total). Eluted peptides were analyzed with a Thermo Fisher Orbitrap Fusion Lumos mass spectrometer with a cycle time of 3 s, 2000 V applied to the column and the following settings. MS1 scans: Orbitrap mass analyzer, resolution of 120,000, scan range of 375 – 1500 m/z, dynamic exclusion of 20 sec, AGC target of 1 × 10⁶, maximum injection time of 50 ms. Peptide isolation and fragmentation: quadrupole isolation of 0.7 m/z, collision-induced dissociation (CID) collision energy of 30%. MS2 scans: ion trap mass analyzer, rapid scan rate, AGC target of 1.8 × 10⁴, maximum injection time of 120 ms. Synchronous precursor selection (SPS)76 and TMT fragmentation: 10 SPS ions, isolation window of 2 m/z, HCD collision energy of 65%. MS3 scans: Orbitrap mass analyzer, resolution of 50,000, scan range of 100 – 500 m/z, AGC target of 1.5 × 10⁵, maximum injection time of 120 ms.
For TMT-quantified SoL, samples were resuspended in 15 μl and 5 μl was loaded onto the analytical column. Samples were loaded and eluted with the above TMT gradient, or an extended gradient as follows. Samples were loaded with 2% buffer B for 10 min then eluted with a gradient of 2–35% buffer B over 215 min, 35–55% buffer B over 10 min, 55–95% buffer B over 5 min, 95% buffer B for 2 min, 95–2% buffer B over 1 min, 2% buffer B for 2 min, 2–95% buffer B over 1 min, 95% buffer B for 2 min, 95–2% buffer B over 1 min, and 2% buffer B for 11 min (260 min total). Eluted peptides were analyzed with a Thermo Fisher Orbitrap Fusion Lumos mass spectrometer with the same TMT settings as above, but with the following alterations. MS1 scans: scan range of 375 – 2000 m/z or 415 – 2000 m/z, dynamic exclusion of 30 sec. Peptide isolation and fragmentation: quadrupole isolation of 1.6 m/z, HCD collision energy of 28%. MS2 scans: Orbitrap mass analyzer, resolution of 15,000, first mass of 120, AGC target of 5 × 10⁴, maximum injection time of 110 ms.
MS Data Processing and Analysis
Proteomic data were analyzed using Proteome Discoverer 2.3 or 2.4 (Thermo) or MSFragger51. For Proteome Discoverer, peptide sequences were matched to experimental spectra using the SEQUEST-HT algorithm67. MS1 tolerance was set to 10 ppm. For low-resolution MS2 spectra (whole protein enrichment), MS2 tolerance was set to 0.6 Da. For high-resolution MS2 spectra (SoL), MS2 tolerance was set to 0.05 Da. Full trypsin specificity was designated with a maximum of two missed cleavages. For benchmarking SoL experiments, oxidation of methionine (+15.995), carbamidomethylation of cysteine (+57.02146) and respective probe masses (Probe: Light/Heavy; 1: 337.211/343.225; 2: 554.358/560.372, 3: 501.274/507.287; 4: 485.337/491.350; 5: 498.259/504.273; 6: 519.229/525.243; 7: 570.295/576.308; 8: 481.310/487.320) on all amino acids were specified as variable modifications. For enantioprobes, only the Light enrichment tag was used (Probe: Light mass; (R)/(S)-9: 453.274; (R)/(S)-10: 459.288). For TMT-quantified whole protein enrichment experiments, oxidation of methionine was specified as a variable modification and carbamidomethylation of cysteine and TMT tags (+229.163) or TMTpro tags (+304.207) of lysine and peptide N-termini were specified as static modifications. For TMT-quantified SoL experiments, all modifications from above TMT experiments were specified as variable modifications except TMT tags on peptide N-termini remained static. For all experiments, data were searched against the full Homo sapiens proteome database (Uniprot: downloaded 07/20; 74,782 sequences) using a false discovery rate (FDR) of 1% at the protein and peptide level using a target-decoy strategy77,78. Results were further processed with Percolator47 using a strict target FDR of 0.01 and validation based on q-Value. For searches that matched multiple PSMs per spectra, the Percolator target/decoy strategy was set to “Separate” with a maximum delta Cn threshold of 0.1. For SoL experiments, data were re-searched against a focused database containing only proteins detected in the enrichment analysis or the initial SoL search. TMT tags were quantified at the MS3 level with a tolerance of 20 ppm. For TMT-quantified whole protein enrichment samples, only PSMs with an average Signal:Noise (S:N) of >10 and >65% of SPS ions matched to the identified peptide sequence were retained. Further, only proteins with two unique peptides identified were retained. For TMT-quantified SoL experiments, only peptides with a maximum S:N >10 were retained.
For MSFragger SoL searches, MS1 tolerance was set to 10 ppm and the MS2 tolerance was set to 0.05 Da. Full trypsin specificity was designated with a maximum of two missed cleavages. For benchmarking SoL experiments, oxidation of methionine (+15.995), carbamidomethylation of cysteine (+57.02146) and respective probe masses (Probe: Light/Heavy; 3: 501.274/507.287; 7: 570.295/576.308; 8: 481.310/487.320) on all amino acids were specified as variable modifications. A custom “delta score” metric was calculated by subtracting the “Nextscore” feature from the “Hyperscore” feature in the MSFragger output files.
Processed proteomic data were exported from Proteome Discoverer or MSFragger and further processed and analyzed using R, Microsoft Excel or Graphpad Prism. For TMT-quantified SoL samples, TMT abundances were summed to unique modified peptide level, irrespective of probe label locations. For concentration-dependent data, the relative peptide/protein abundances were normalized between 0 and 1 by subtracting the minimum value for that respective peptide/protein and dividing by the difference between the maximum and minimum values for that respective peptide/protein. (R)/(S)-10 labeled peptides were further normalized to have the same median for each concentration as data were skewed based on comparison to the whole protein enrichment samples. All fitted dose curves on the same plot were constrained to have the same hill slope unless otherwise noted. Predictive models were developed using the glm.fit function available in base R. Predictive features included in the final model are: score difference between the first-ranked and current PSM assigned to a given spectrum, the total number of PSMs assigned to a given spectrum, the retention time (RT) difference between a putatively labeled PSM and the average RT for unlabeled peptides of the same length, and the percent agreement in peptide sequence of all PSMs assigned to a given spectrum. The final reported labeled probability is the maximum probability assigned to a unique labeled peptide.
Knowledge- and Structure-Based Analyses
Protein information for the labeled peptides was used to extract additional information from Uniprot such as structural features (ACT_SITE, BINDING, METAL, DNA_BIND and NP_BIND), presence in DrugBank, Gene Ontology (GO) keywords, and Protein Data Bank (PDB) and AlphaFold structure IDs. Protein structures were batch downloaded from PDB or AlphaFold using command line prompts in terminal and pockets were predicted using the Fpocket algorithm60. Proteomic, pocket, site and structure data were processed together using R scripts adapted from previously published work26. For GO analysis (Fig 6b), Uniprot keywords were analyzed for the presence of “Chaperone”, “Transcription”, “Channel”, “Transport”, “Receptor”, “Cytoskeleton” (labeled as Structural in plot), “Ribonucleo”, “Proteasome”, “Enzyme”, and “ase;” (merged with “Enzyme” for plotting).
Statistical analyses
All sample sizes consisted of at least n = 2 measurements taken from distinct samples. A two-sided Student’s t-test, Mann-Whitney U Test or Chi-squared test were used to assess significance.
Gel-based analysis of probe labelled proteins in cells
For validation of endogenous protein labeling, cells were treated, lysed, and processed as described in the “Chemoproteomic Sample Preparation” section above with the following alterations. First, proteins were not reduced or alkylated. Second, instead of resuspending the enriched proteins in trypsin digest buffer, the beads were boiled in 2X Laemmli sample buffer for 15 min to release enriched proteins. Proteins were resolved via SDS-PAGE followed by immunoblotting analysis as described below.
Cellular Thermal Shift Assay (CETSA)
For CETSA experiments, equal amounts of HEK293T cells were incubated with DMSO or the indicated concentration of probes in fresh media for 30 min at 37 °C. Cells were then harvested and washed once with binding buffer (cold DPBS containing DMSO or the indicated concentration of probe and 1X Halt Protease Inhibitor Cocktail). Cells were then resuspended in binding buffer, counted, and aliquoted to a concentration of 300,000 cells/50 μl before being transferred to PCR tubes for heat treatment. PCR tubes were heated at indicated temperature gradient on a thermal cycler (Bio-Rad) for 3 min, followed by incubation at 25 °C for 3 min. After 3 snap freeze-thaw cycles with liquid nitrogen, lysates were transferred to 1.5 ml Eppendorf tubes and centrifuged at 100,000 × g for 20 min at 4 °C to separate destabilized proteins from proteins remaining in solution. The resulting supernatant was transferred to new Eppendorf tubes, mixed with 4X SDS sample buffer, boiled for 15 min and processed for immunoblotting as described below.
Immunoblotting analysis
Samples prepared as described above were first resolved by SDS-PAGE and then transferred to PVDF membranes using the Bio-Rad Trans-Blot Turbo Transfer System. Membranes were then blocked with 5 % milk in TBST, incubated with primary antibody overnight, washed three times with TBST (5 min each wash) and incubated with secondary antibody for another 1 hr. Immunoblot membranes were visualized with Bio-Rad ChemiDoc Imaging System and quantified with Bio-Rad Image Lab software (version 6.1.0).
Molecular modeling
The tridimensional coordinates of the probes were generated from SMILES using RDKit ETKDGv379 and UFF minimization80. Atomic coordinates of the targets were retrieved from the Protein Data Bank (PDB), when available, otherwise, AlphaFold2 models59 were used. When more than one structure was available from the PDB, the most appropriate structure was chosen using the following criteria: presence of coordinates of the SoL residues, highest percentage of sequence coverage, and lowest resolution. Where possible, x-ray structures were preferred over cryo-EM. Hydrogens were added to the target structures using Reduce81, then coordinates of both ligand and targets were processed following the standard AutoDock protocol82. Fpocket60 was used to identify druggable pockets, and for each of them a docking grid box was centered and sized to encompass the predicted pocket size and no less than 24 Å per side. All probes were docked against each predicted pocket using AutoDock-GPU83 to generate 50 poses for each ligand (default parameters for the LGA algorithm and the ADADELTA gradient-based local search). Pockets were then ranked using the best docking energy of all probes and poses that placed the diazirine moiety within 6 Å from any adducted residue identified via proteomics were considered successful labeling events. Pocket prediction success rates were calculated as percentage of successful docking events considering all the probes in the library. Site prediction success rates were calculated by considering labeling events for the probes that were detected in the proteomics experiments. Manually confirmed docked structures for at least one probe per protein have been uploaded to Zenodo (DOI: 10.5281/zenodo.8326534).
Chemistry Methods
See supplemental information for complete synthetic methods and characterization.
Extended Data
Extended Data Fig. 1. Comparison of MultiPSM and ptmRS probe localization.
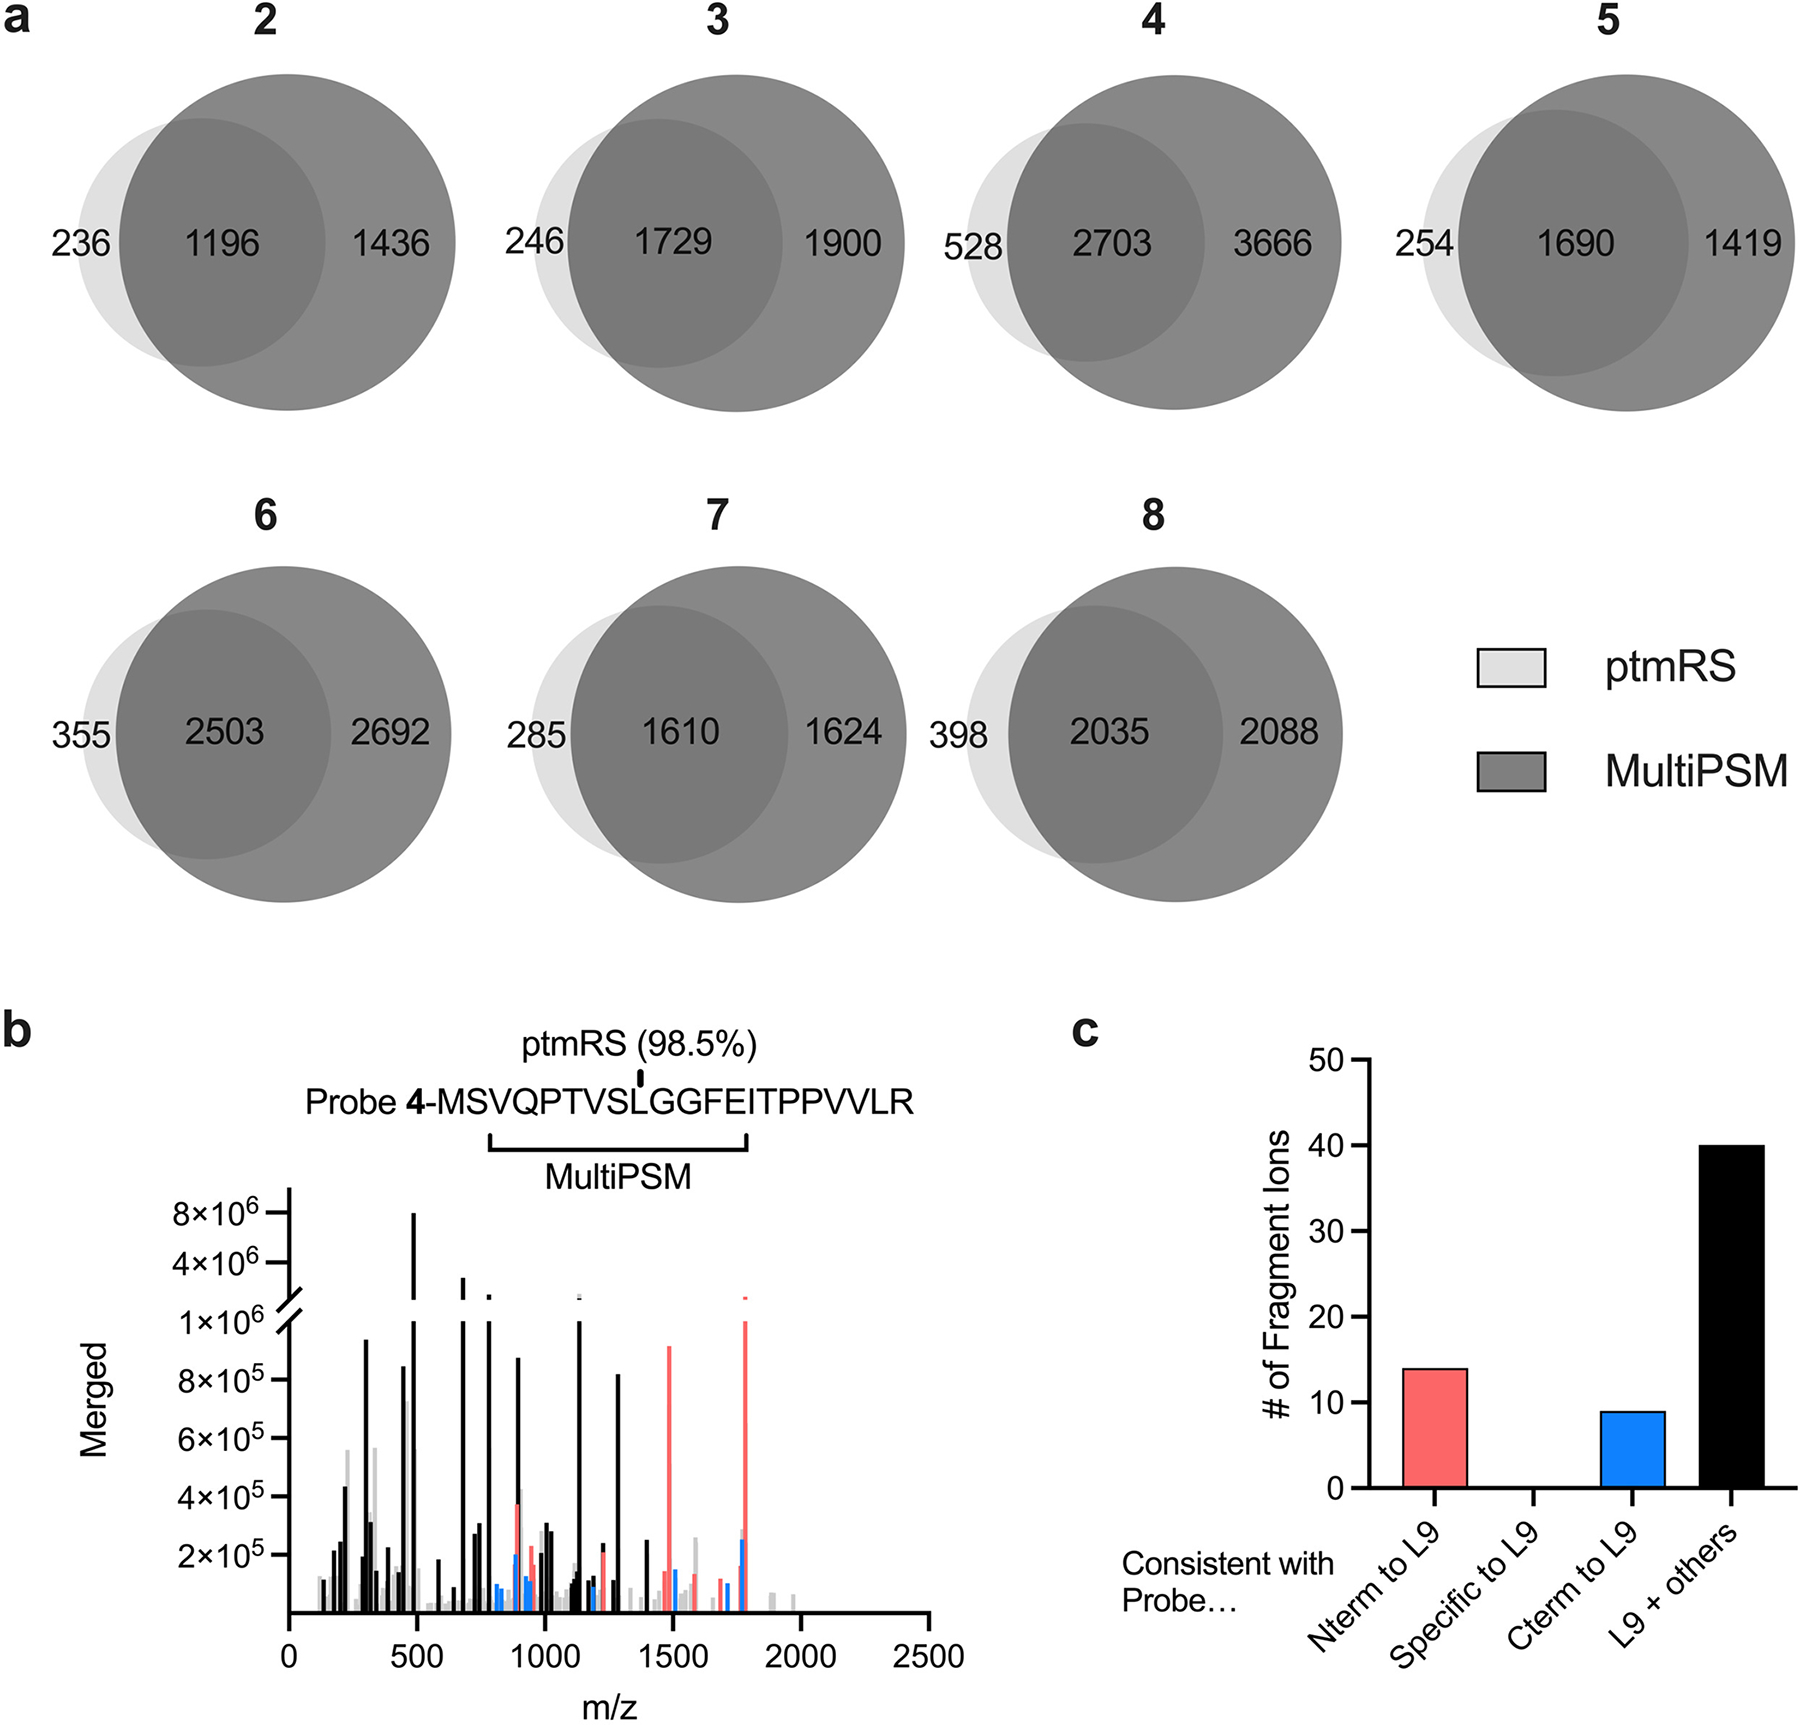
(a) Overlap of MultiPSM and ptmRS locations for all unique peptides for each benchmark probe. (b) Example spectra where ptmRS calls a single probe modified location (L9) but there is more evidence for other locations. Ions are colored according to whether they are consistent with probe N-terminal to L9 (red), C-terminal to L9 (blue) or localized to L9 and other locations (black). Unmatched fragment ions are shown in light gray. (c) Quantification of fragment ions shown in panel b.
Extended Data Fig. 2. Development of a predictive model for spectra containing photo-affinity probe labeled peptides.
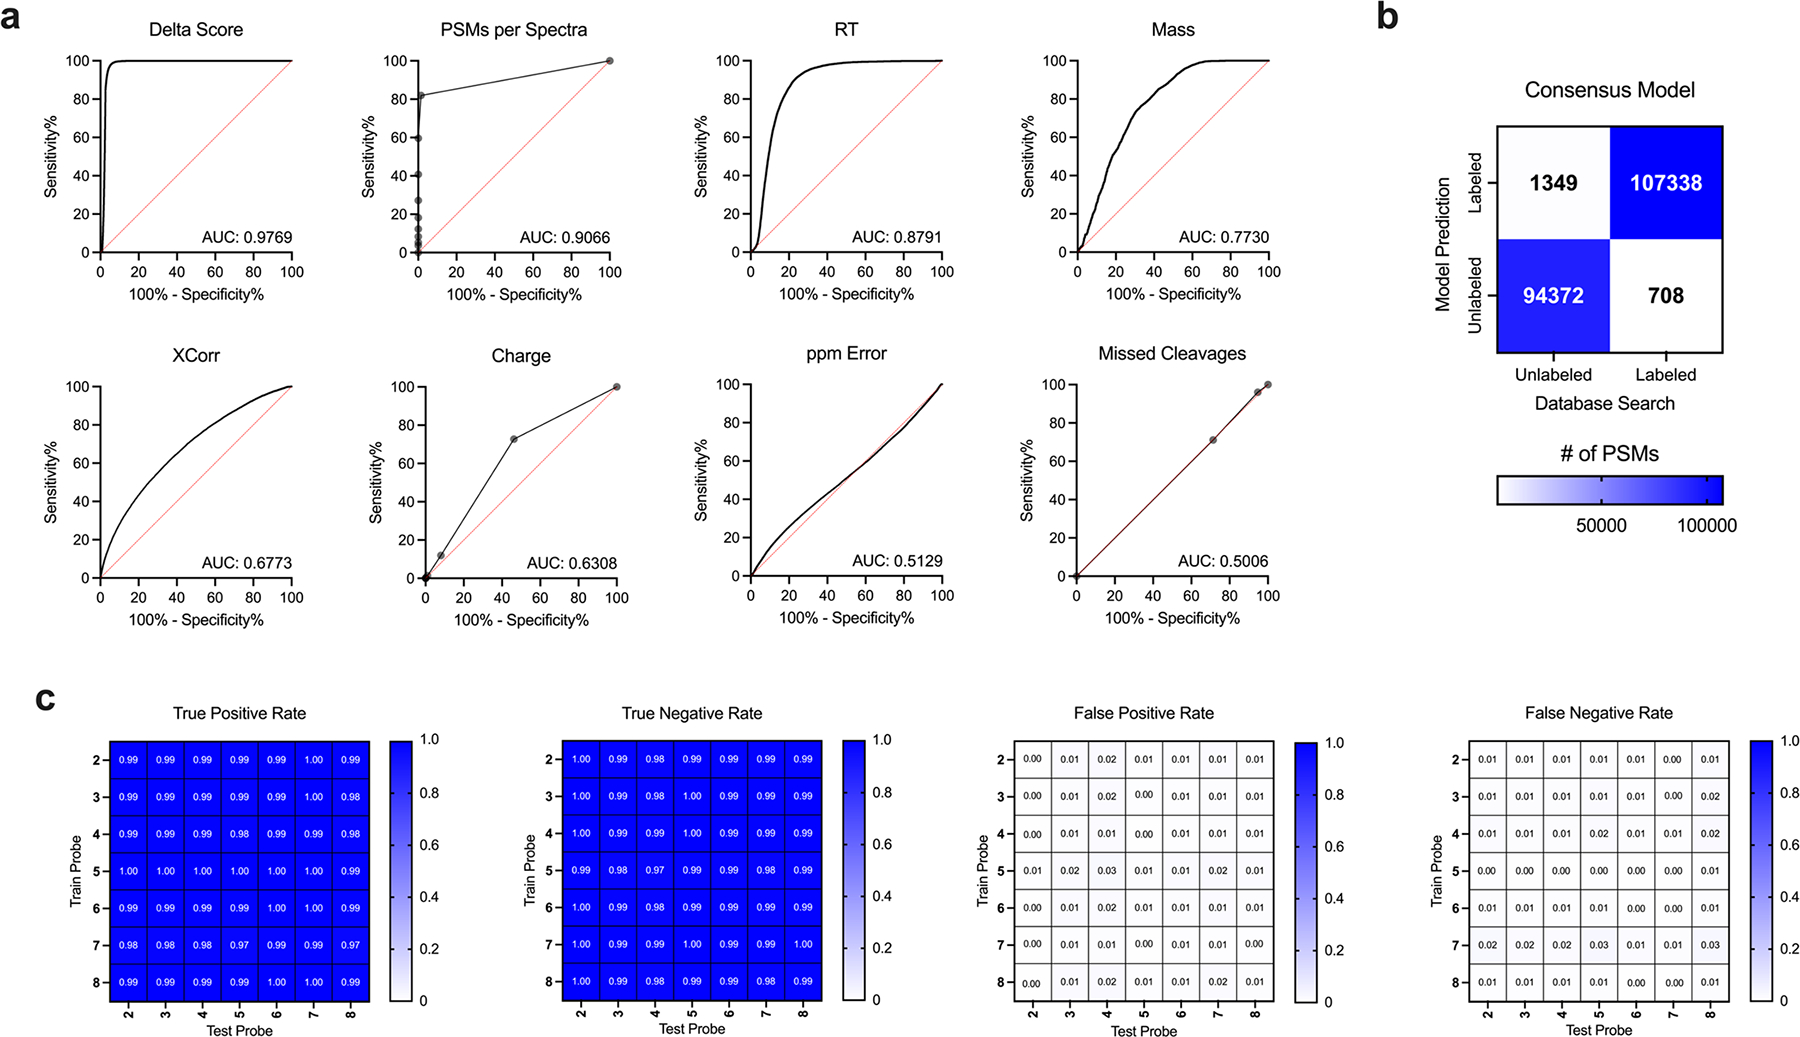
(a) Predictive abilities of spectral features for identifying probe-labeled peptides (all probes merged in plots). (b) Confusion matrix of final predictive model trained on and applied to all probes. (c) Split confusion matrix of predictive models trained on individual probes and applied to all other individual probes.
Extended Data Fig. 3. Integration of Dizco model with MSFragger.
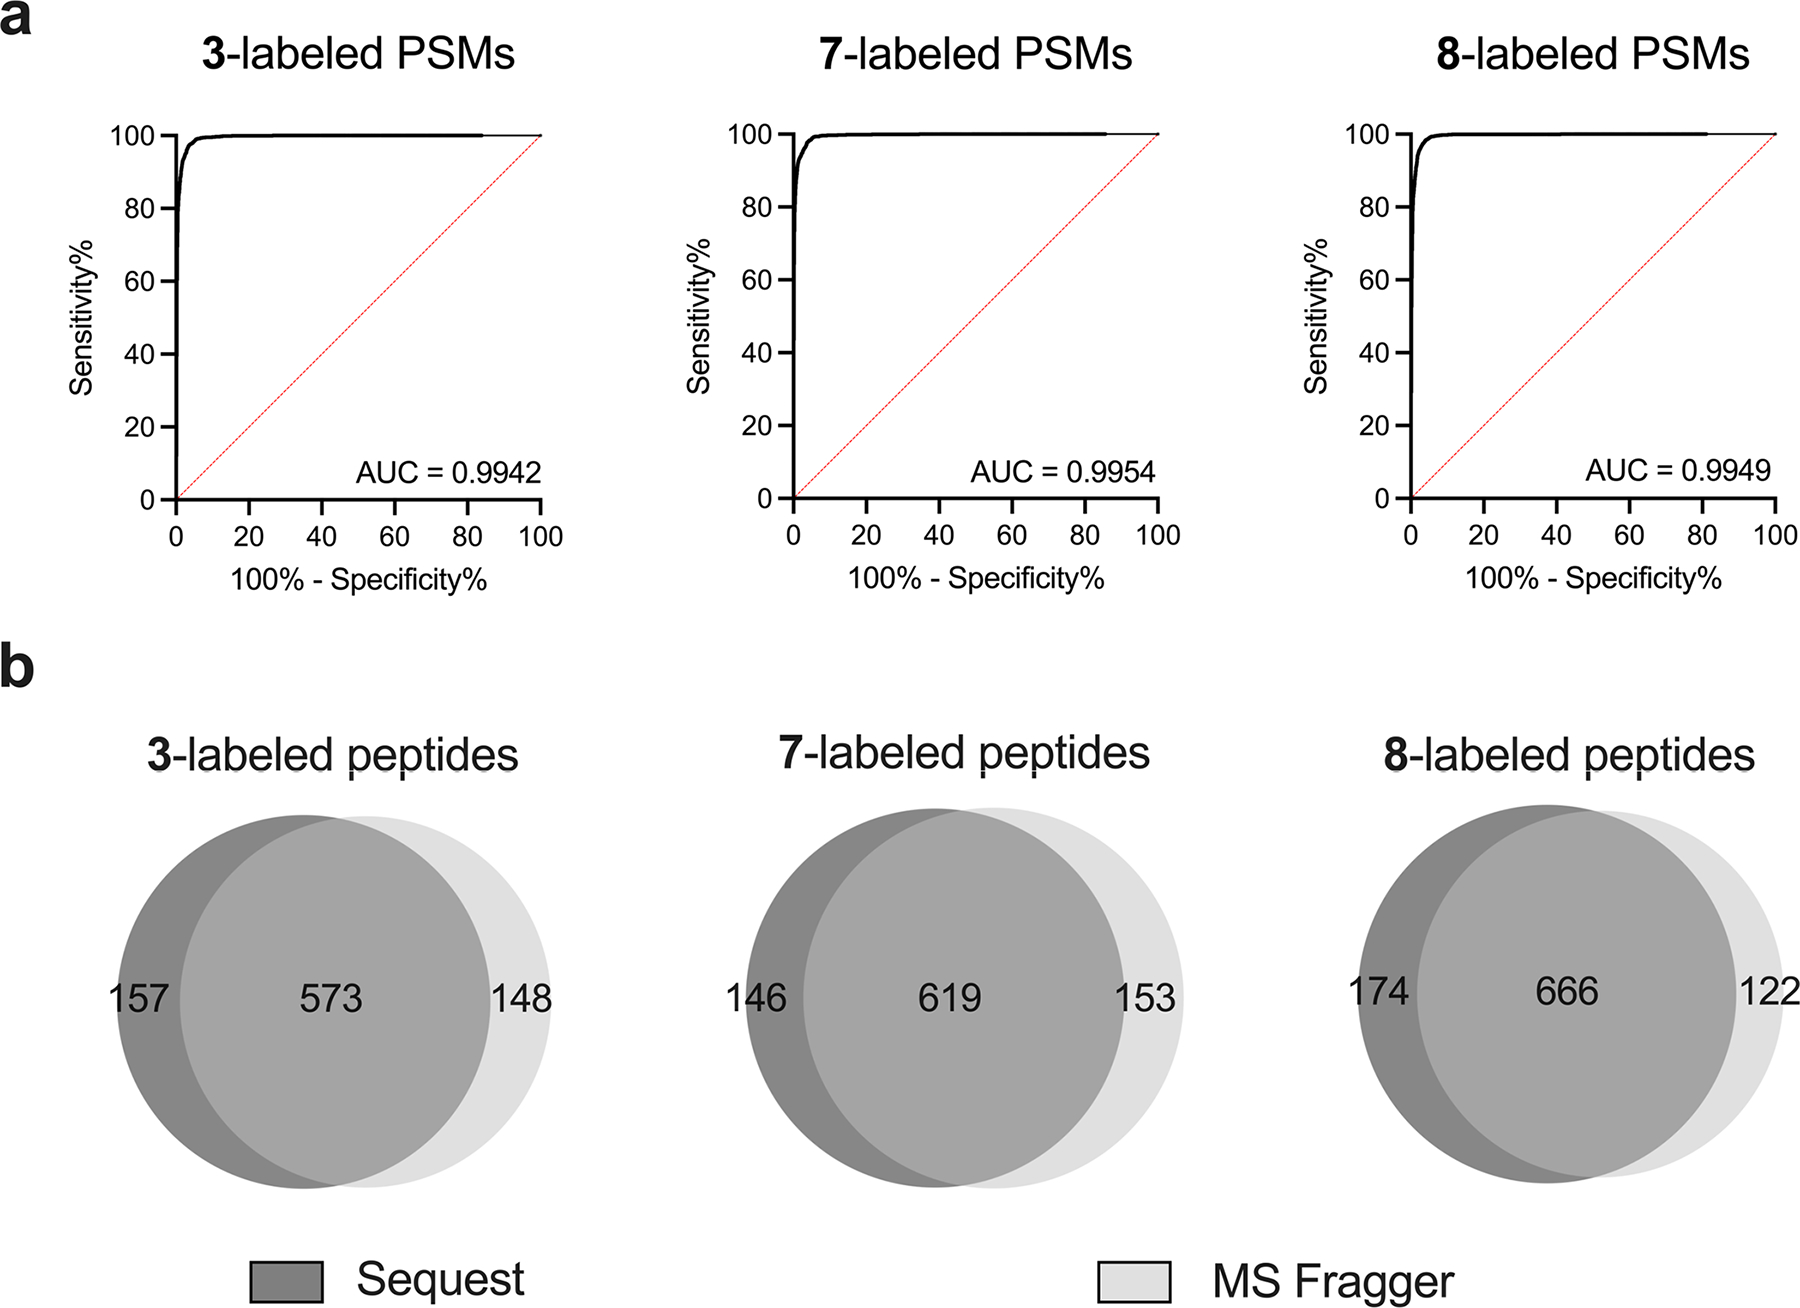
(a) ROC curves for predicting probe labeled peptides generated from MSFragger output (using a custom delta score = hyperscore - nextscore and retention time difference from unlabeled peptide of same length). (b) Overlap of unique probe-labeled peptides from Sequest and MSFragger searches.
Extended Data Fig. 4. Extended validation of stereoselecti ve probe-target interactions.
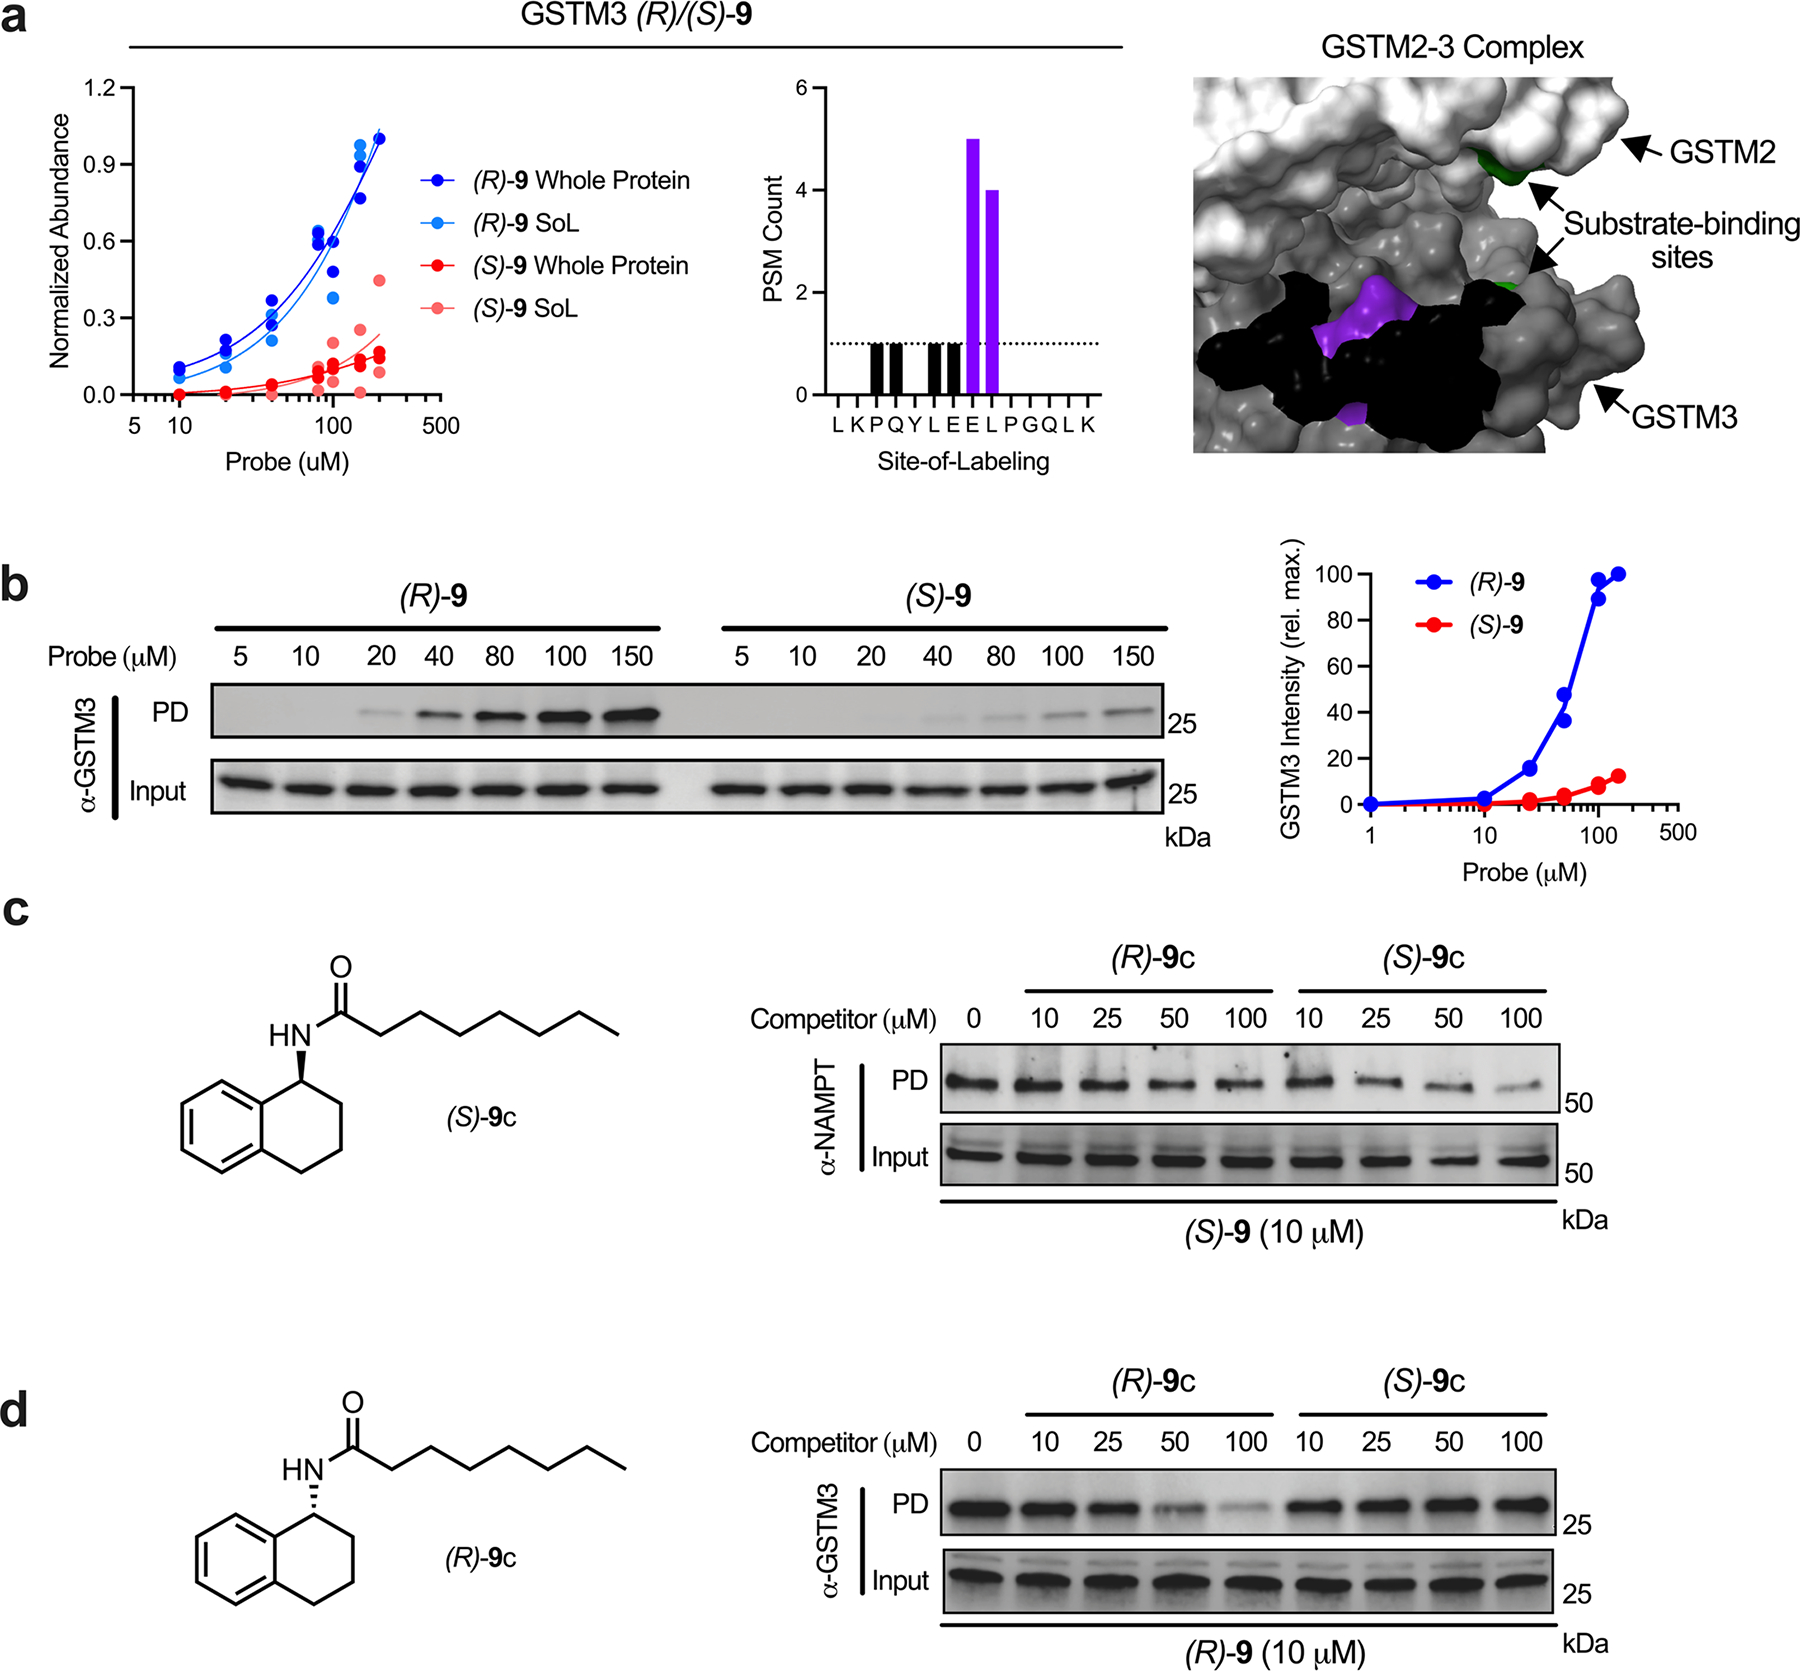
(a) GSTM3 concentration plot and probe label site proximal to the active site (PDB: 3GTU). (b) Immunoblot analysis and quantification of GSTM3 stereoselective probe binding. (c) Immunoblot analysis of competitive blockade of probe (S)-9-NAMPT interaction using a cognate competitor molecule (S)-9c. (d) Immunoblot analysis of competitive blockade of probe (R)-9-NAMPT interaction using a cognate competitor molecule (R)-9c. Each immunoblot displayed is representative of two independent experiments. (PD = pulldown)
Extended Data Fig. 5. Proteins possessing multiple binding sites with varying EC50 values.
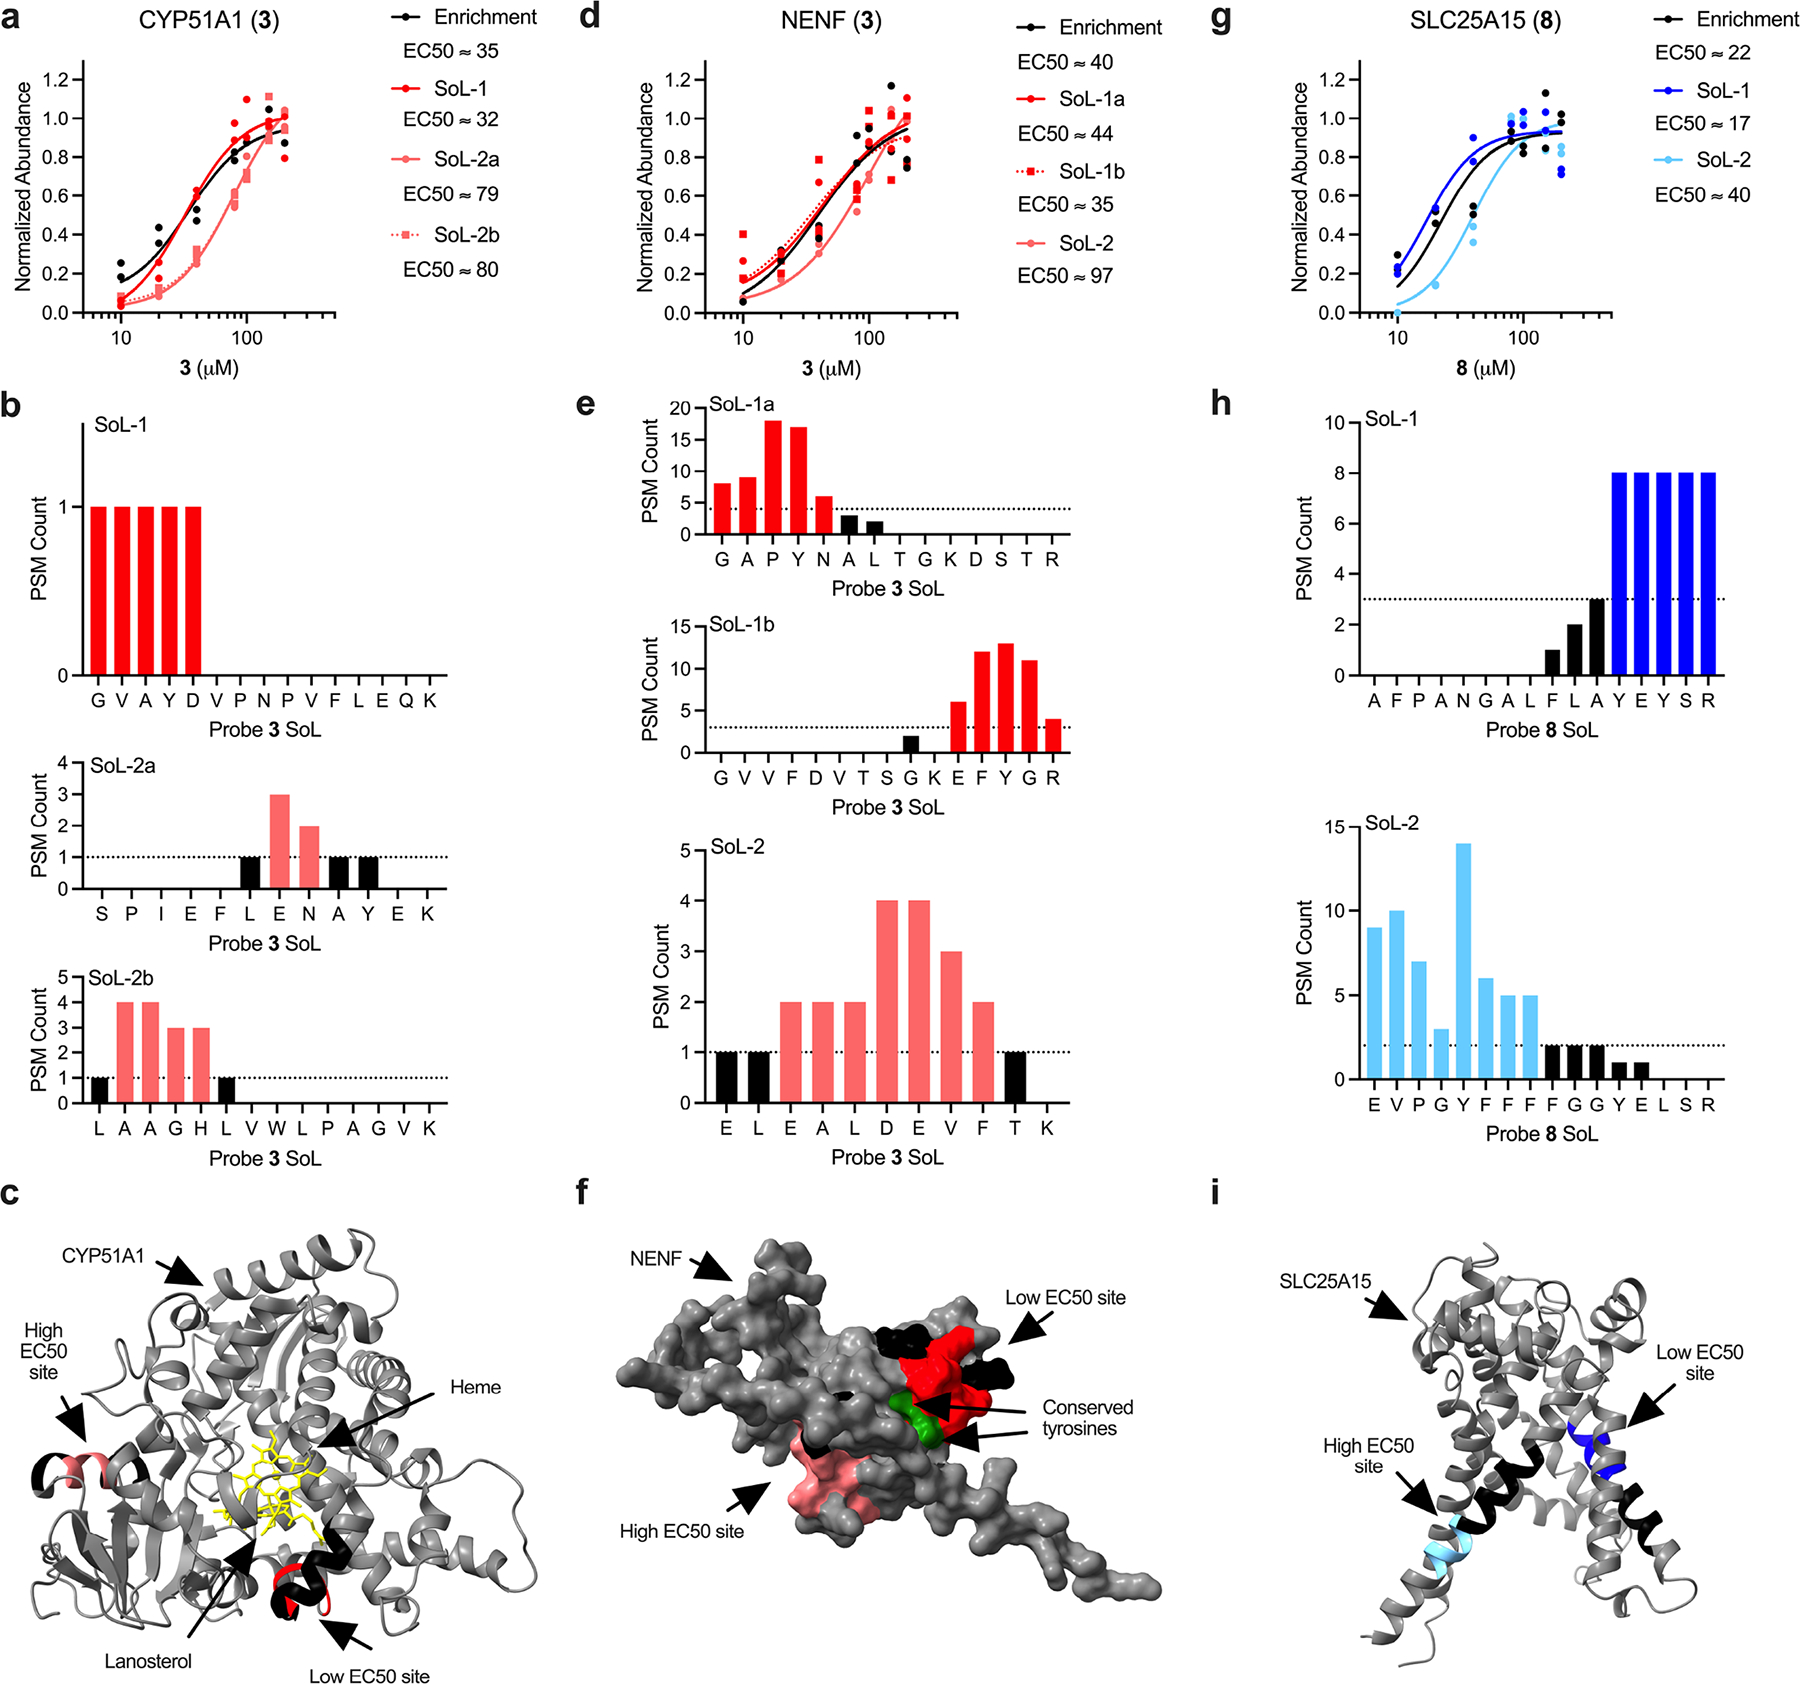
For all structures, residues labeled by probes are colored red or light red for probe 3 and blue or light blue for probe 8. The remainder of each detected peptide is colored black. Active/other indicated sites are colored green and coresolved ligands are colored yellow. CYP51A1 probe 3 concentration plot (a), peptide plots (b) and label sites (c; PDB: 6UEZ). SoL-2a/b refers to two unique peptides that support the same high EC50 binding site (SoL-2b is absent from presented PDB structure, but proximity to SoL-2a was determined from Alpha Fold structure). NENF probe 3 concentration plot (d), peptide plots (e) and label sites (f; AF-Q9UMX5-F1-model_v2). SoL-1a/b refers to two unique peptides that support the same low EC50 binding site. SLC25A15 probe 8 concentration plot (g), peptide plots (h) and label sites (i; AF-Q9Y619-F1-model_v2). All calculated EC50 values are approximations.
Extended Data Fig. 6. Extended orthogonal validation of probe-target interactions.
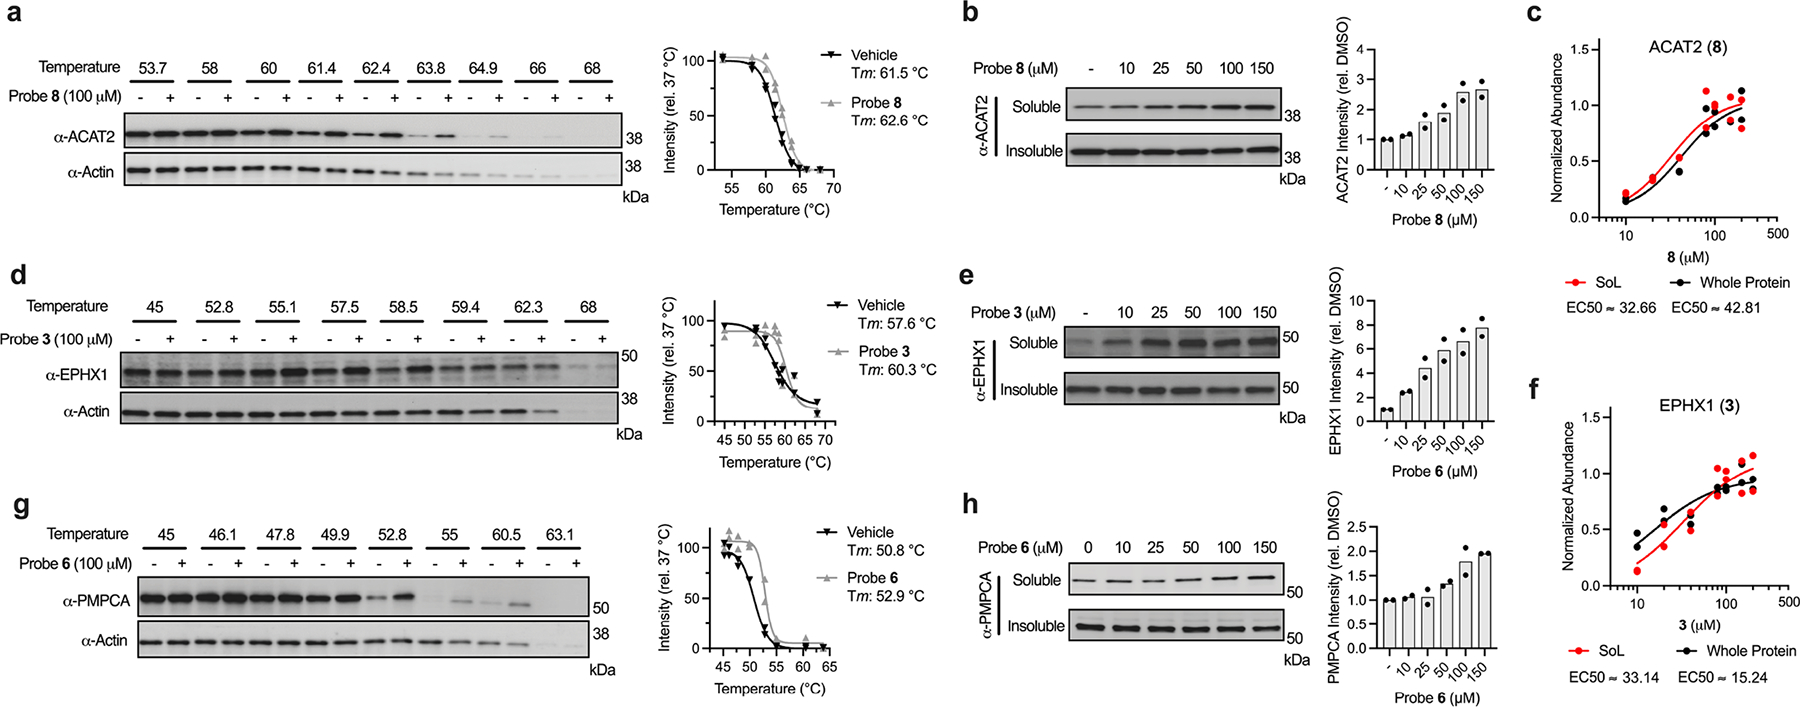
(a) Cellular thermal shift assay (CETSA) temperature gradient and quantification of probe 8-ACAT2 interaction. (b) CETSA dose analysis of probe 8-ACAT2 interaction. (c) Probe 8-ACAT2 concentration plot from proteomics experiment. (d) CETSA temperature gradient and quantification of probe 3-EPHX1 interaction. (e) CETSA dose analysis of probe 3-EPHX1 interaction. (f) Probe 3-EPHX1 concentration plot from proteomics experiment. (g) CETSA temperature gradient and quantification of probe 6-PMPCA interaction. (h) CETSA dose analysis of probe 6-PMPCA interaction. Each immunoblot displayed is representative of two independent experiments.
Extended Data Fig. 7. Extended orthogonal validation of functional sites.
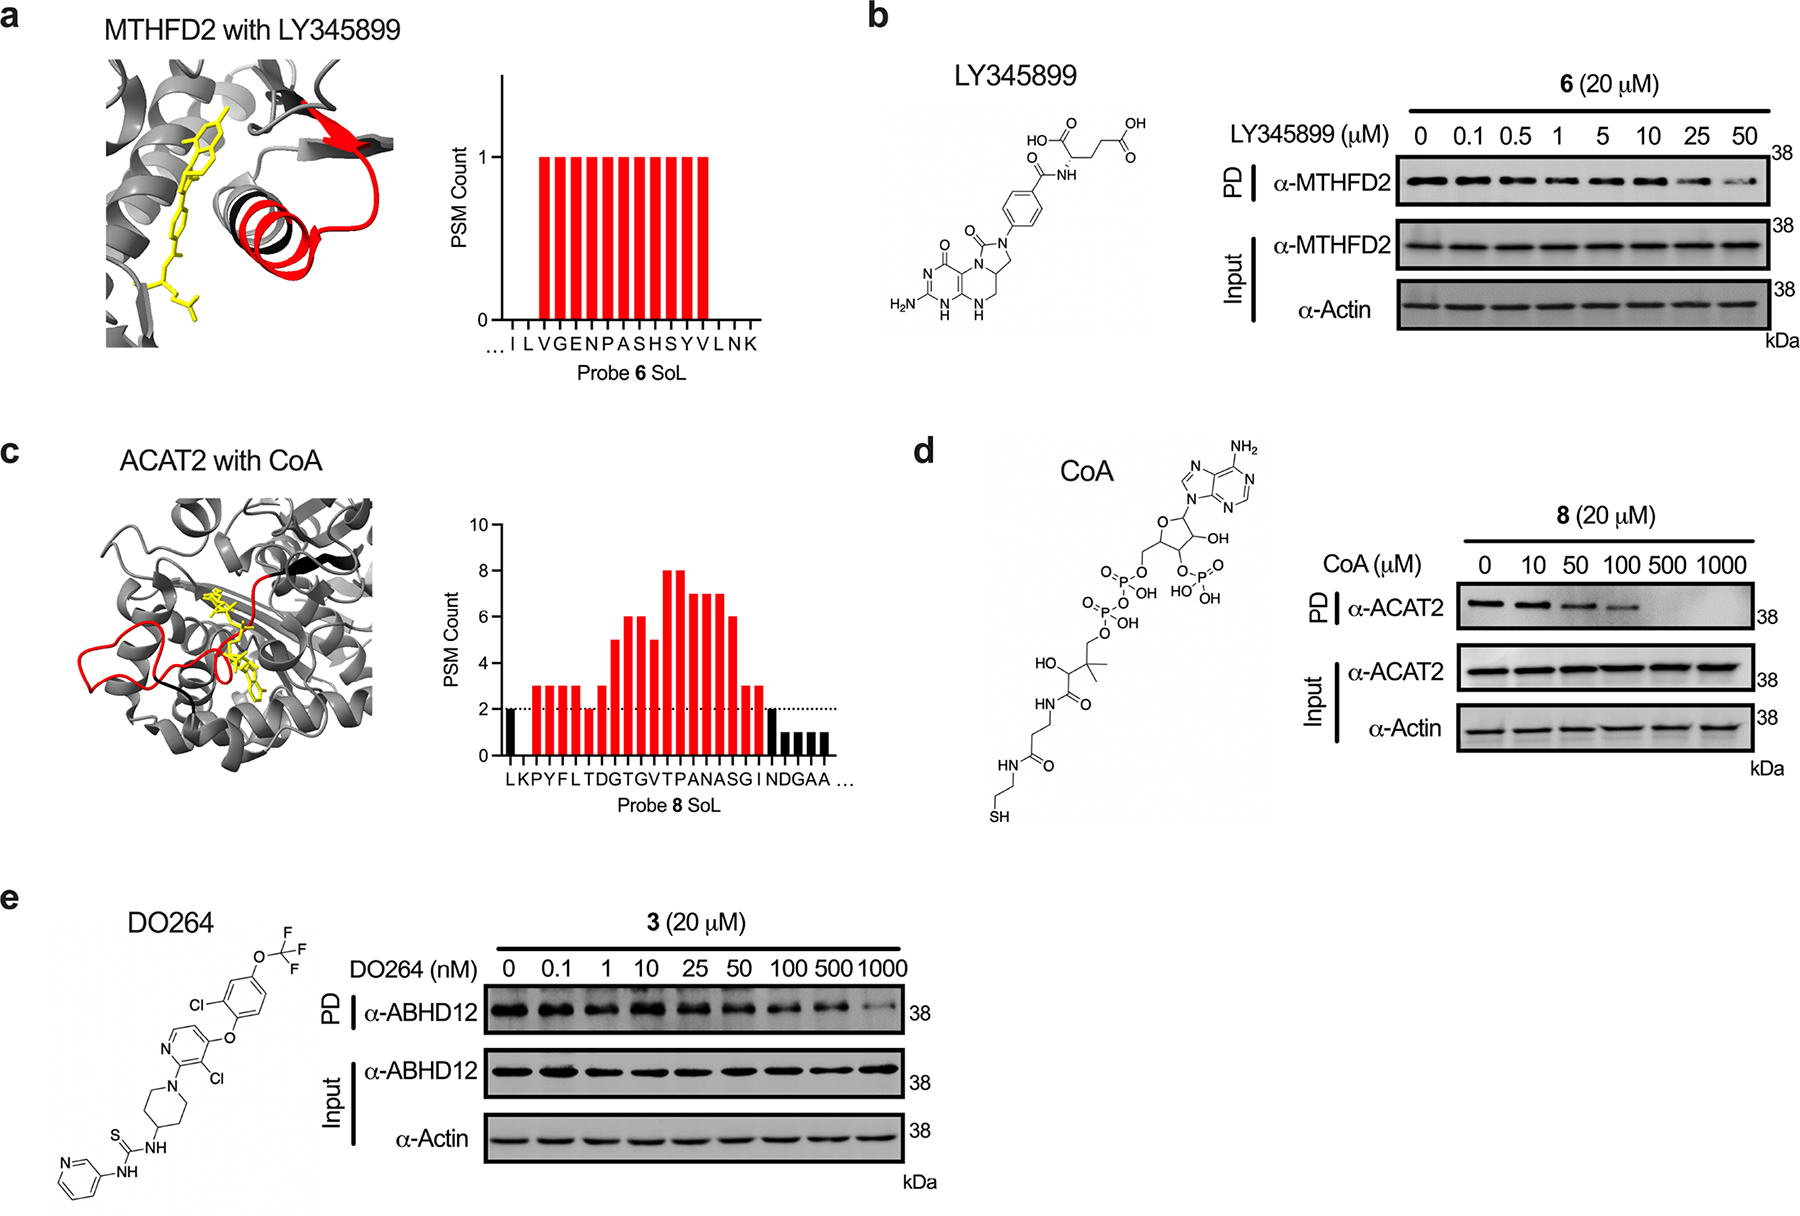
(a) MTHFD2 probe 6 label sites overlapping with LY345899-binding site (PDB: 5TC4). (b) Immunoblot analysis of competitive blockade of probe 6-MTHFD2 interaction using LY345899. (c) ACAT2 probe 8 label sites overlapping with CoA-binding site (PDB: 1WL4). (d) Immunoblot analysis of competitive blockade of probe 8-ACAT2 interaction using CoA. (e) Immunoblot analysis of competitive blockade of probe 3-ABHD12 interaction using DO264 (see Supplementary Figure 12a for corresponding ABHD12 structure and probe 3 peptide plot). Each immunoblot displayed is representative of two independent experiments. (PD = pulldown)
Extended Data Fig. 8. Extended orthogonal validation of sites of unknown function.
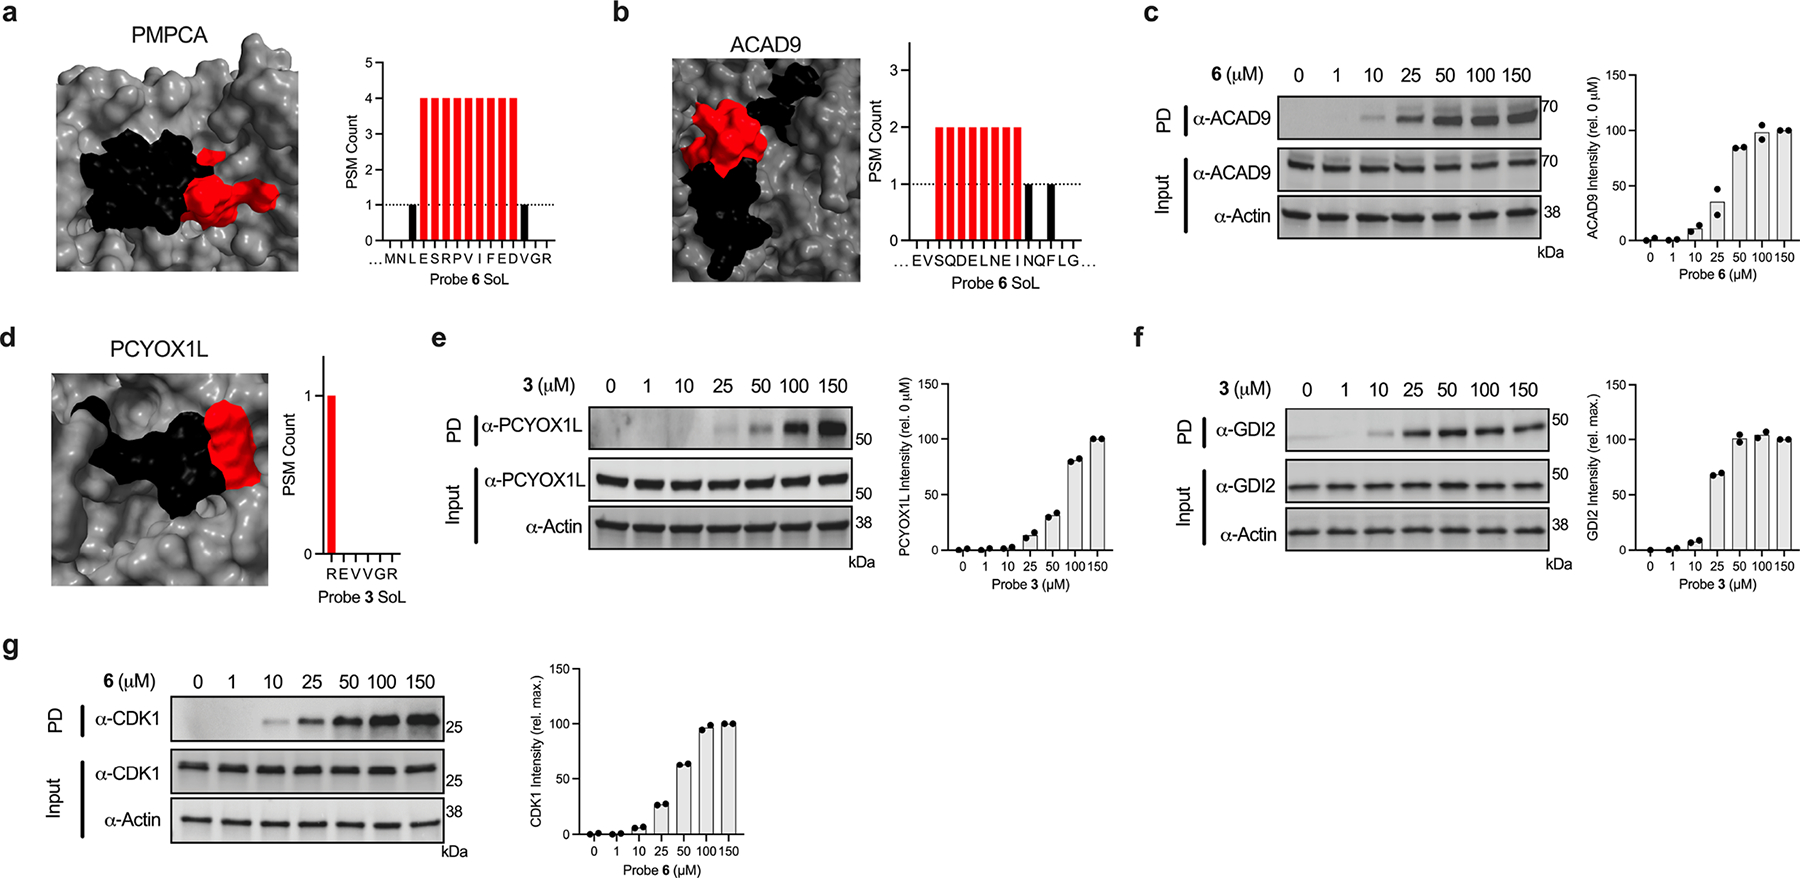
(a) Depiction of probe label sites overlapping with sites of unknown function for probe 6-PMPCA (AF-Q10713-F1-model_v2) interaction. Depiction of probe label sites overlapping with sites of unknown function and immunoblot analysis and quantification of probe 6-ACAD9 (AF-Q9H845-F1-model_v2) (b-c), and probe 3-PCYO1XL (AF-Q8NBM8-F1-model_v2) (d-e) interactions. Immunoblot analysis and quantification of probe 3-GDI2 (f) and probe 6-CDK1 (g) interactions (see Figure 6i, k for corresponding structures and peptide plots). Each immunoblot displayed is representative of two independent experiments. (PD = pulldown)
Supplementary Material
Acknowledgements
This work was supported by the National Institute of Allergic and Infectious Diseases NIAID/R01 AI156268 (C.G.P.), 1U19AII71443-01 (C.G.P. and S.F.) and T32AI007244 (J.M.W.) as well as National Institutes of Health grant R01GM069832 (S.F.).
Footnotes
Competing Interests Statement
C.G.P. is a co-founder and scientific advisor to Belharra Therapeutics, a biotechnology company interested in using chemical proteomic methods to develop small molecule therapeutics. The remaining authors declare no competing interests.
Code Availability
Scripts developed in this work are available at https://github.com/jmwozniak/DizcoProcessing and have been uploaded to Zenodo84.
Data Availability
The Uniprot Homo sapiens proteome database (downloaded 07/20; 74,782 sequences) was used for proteomic searches. Mass spectrometry datasets have been deposited on ProteomeXchange as follows: Benchmark SoL (PXD044869) and whole protein (PXD044870). TMT pilot SoL (PXD044886) and whole protein (PXD044887). TMT dose non-enantiomers SoL (PXD044881) and whole protein (PXD044882). TMT dose enantiomers SoL (PXD044883) and whole protein (PXD044884). Molecular modeling .pdb files have been uploaded to the Zenodo repository and can be accessed through the DOI: 10.5281/zenodo.8326534.
References
- 1.Anderson AC The process of structure-based drug design. Chem Biol 10, 787–797, doi: 10.1016/j.chembiol.2003.09.002 (2003). [DOI] [PubMed] [Google Scholar]
- 2.Sugiki T, Furuita K, Fujiwara T & Kojima C Current NMR Techniques for Structure-Based Drug Discovery. Molecules 23, doi: 10.3390/molecules23010148 (2018). [DOI] [PMC free article] [PubMed] [Google Scholar]
- 3.Maveyraud L & Mourey L Protein X-ray Crystallography and Drug Discovery. Molecules 25, doi: 10.3390/molecules25051030 (2020). [DOI] [PMC free article] [PubMed] [Google Scholar]
- 4.Schindler T et al. Structural mechanism for STI-571 inhibition of abelson tyrosine kinase. Science 289, 1938–1942, doi: 10.1126/science.289.5486.1938 (2000). [DOI] [PubMed] [Google Scholar]
- 5.Schreiber SL The Rise of Molecular Glues. Cell 184, 3–9, doi: 10.1016/j.cell.2020.12.020 (2021). [DOI] [PubMed] [Google Scholar]
- 6.Leroux AE & Biondi RM Renaissance of Allostery to Disrupt Protein Kinase Interactions. Trends Biochem Sci 45, 27–41, doi: 10.1016/j.tibs.2019.09.007 (2020). [DOI] [PubMed] [Google Scholar]
- 7.Wu P, Clausen MH & Nielsen TE Allosteric small-molecule kinase inhibitors. Pharmacol Ther 156, 59–68, doi: 10.1016/j.pharmthera.2015.10.002 (2015). [DOI] [PubMed] [Google Scholar]
- 8.Meijer FA, Leijten-van de Gevel IA, de Vries R & Brunsveld L Allosteric small molecule modulators of nuclear receptors. Mol Cell Endocrinol 485, 20–34, doi: 10.1016/j.mce.2019.01.022 (2019). [DOI] [PubMed] [Google Scholar]
- 9.Lu S & Zhang J Small Molecule Allosteric Modulators of G-Protein-Coupled Receptors: Drug-Target Interactions. J Med Chem 62, 24–45, doi: 10.1021/acs.jmedchem.7b01844 (2019). [DOI] [PubMed] [Google Scholar]
- 10.Backus KM et al. Proteome-wide covalent ligand discovery in native biological systems. Nature 534, 570–574, doi: 10.1038/nature18002 (2016). [DOI] [PMC free article] [PubMed] [Google Scholar]
- 11.Kambe T, Correia BE, Niphakis MJ & Cravatt BF Mapping the protein interaction landscape for fully functionalized small-molecule probes in human cells. J Am Chem Soc 136, 10777–10782, doi: 10.1021/ja505517t (2014). [DOI] [PMC free article] [PubMed] [Google Scholar]
- 12.Hulce JJ, Cognetta AB, Niphakis MJ, Tully SE & Cravatt BF Proteome-wide mapping of cholesterol-interacting proteins in mammalian cells. Nat Methods 10, 259–264, doi: 10.1038/nmeth.2368 (2013). [DOI] [PMC free article] [PubMed] [Google Scholar]
- 13.Li Z et al. Design and synthesis of minimalist terminal alkyne-containing diazirine photo-crosslinkers and their incorporation into kinase inhibitors for cell- and tissue-based proteome profiling. Angew Chem Int Ed Engl 52, 8551–8556, doi: 10.1002/anie.201300683 (2013). [DOI] [PubMed] [Google Scholar]
- 14.Parker CG & Pratt MR Click Chemistry in Proteomic Investigations. Cell 180, 605–632, doi: 10.1016/j.cell.2020.01.025 (2020). [DOI] [PMC free article] [PubMed] [Google Scholar]
- 15.Hacker SM et al. Global profiling of lysine reactivity and ligandability in the human proteome. Nat Chem 9, 1181–1190, doi: 10.1038/nchem.2826 (2017). [DOI] [PMC free article] [PubMed] [Google Scholar]
- 16.Smith E & Collins I Photoaffinity labeling in target- and binding-site identification. Future Med Chem 7, 159–183, doi: 10.4155/fmc.14.152 (2015). [DOI] [PMC free article] [PubMed] [Google Scholar]
- 17.Burton NR, Kim P & Backus KM Photoaffinity labelling strategies for mapping the small molecule-protein interactome. Org Biomol Chem 19, 7792–7809, doi: 10.1039/d1ob01353j (2021). [DOI] [PMC free article] [PubMed] [Google Scholar]
- 18.West AV & Woo CM Photoaffinity Labeling Chemistries Used to Map Biomolecular Interactions. Israel Journal of Chemistry 63, doi: 10.1002/ijch.202200081 (2023). [DOI] [Google Scholar]
- 19.Conway LP et al. Evaluation of fully-functionalized diazirine tags for chemical proteomic applications. Chem Sci 12, 7839–7847, doi: 10.1039/d1sc01360b (2021). [DOI] [PMC free article] [PubMed] [Google Scholar]
- 20.Mackinnon AL & Taunton J Target Identification by Diazirine Photo-Cross-linking and Click Chemistry. Curr Protoc Chem Biol 1, 55–73, doi: 10.1002/9780470559277.ch090167 (2009). [DOI] [PMC free article] [PubMed] [Google Scholar]
- 21.Shi H, Zhang CJ, Chen GY & Yao SQ Cell-based proteome profiling of potential dasatinib targets by use of affinity-based probes. J Am Chem Soc 134, 3001–3014, doi: 10.1021/ja208518u (2012). [DOI] [PubMed] [Google Scholar]
- 22.Parker CG et al. Chemical Proteomics Identifies SLC25A20 as a Functional Target of the Ingenol Class of Actinic Keratosis Drugs. ACS Cent Sci 3, 1276–1285, doi: 10.1021/acscentsci.7b00420 (2017). [DOI] [PMC free article] [PubMed] [Google Scholar]
- 23.Conway LP, Li W & Parker CG Chemoproteomic-enabled phenotypic screening. Cell Chem Biol 28, 371–393, doi: 10.1016/j.chembiol.2021.01.012 (2021). [DOI] [PubMed] [Google Scholar]
- 24.Kotake Y et al. Splicing factor SF3b as a target of the antitumor natural product pladienolide. Nat Chem Biol 3, 570–575, doi: 10.1038/nchembio.2007.16 (2007). [DOI] [PubMed] [Google Scholar]
- 25.Lee K et al. Identification of malate dehydrogenase 2 as a target protein of the HIF-1 inhibitor LW6 using chemical probes. Angew Chem Int Ed Engl 52, 10286–10289, doi: 10.1002/anie.201304987 (2013). [DOI] [PubMed] [Google Scholar]
- 26.Parker CG et al. Ligand and Target Discovery by Fragment-Based Screening in Human Cells. Cell 168, 527–541 e529, doi: 10.1016/j.cell.2016.12.029 (2017). [DOI] [PMC free article] [PubMed] [Google Scholar]
- 27.Wang Y et al. Expedited mapping of the ligandable proteome using fully functionalized enantiomeric probe pairs. Nat Chem 11, 1113–1123, doi: 10.1038/s41557-019-0351-5 (2019). [DOI] [PMC free article] [PubMed] [Google Scholar]
- 28.Wright MH & Sieber SA Chemical proteomics approaches for identifying the cellular targets of natural products. Nat Prod Rep 33, 681–708, doi: 10.1039/c6np00001k (2016). [DOI] [PMC free article] [PubMed] [Google Scholar]
- 29.Yu W & Baskin JM Photoaffinity labeling approaches to elucidate lipid-protein interactions. Curr Opin Chem Biol 69, 102173, doi: 10.1016/j.cbpa.2022.102173 (2022). [DOI] [PubMed] [Google Scholar]
- 30.Tanaka Y & Kohler JJ Photoactivatable crosslinking sugars for capturing glycoprotein interactions. J Am Chem Soc 130, 3278–3279, doi: 10.1021/ja7109772 (2008). [DOI] [PubMed] [Google Scholar]
- 31.Sakurai K Photoaffinity Probes for Identification of Carbohydrate-Binding Proteins. Asian Journal of Organic Chemistry 4, 116–126, doi: 10.1002/ajoc.201402209 (2015). [DOI] [Google Scholar]
- 32.Homan RA, Jadhav AM, Conway LP & Parker CG A Chemical Proteomic Map of Heme-Protein Interactions. J Am Chem Soc 144, 15013–15019, doi: 10.1021/jacs.2c06104 (2022). [DOI] [PMC free article] [PubMed] [Google Scholar]
- 33.Ziemianowicz DS, Bomgarden R, Etienne C & Schriemer DC Amino Acid Insertion Frequencies Arising from Photoproducts Generated Using Aliphatic Diazirines. J Am Soc Mass Spectrom 28, 2011–2021, doi: 10.1007/s13361-017-1730-z (2017). [DOI] [PubMed] [Google Scholar]
- 34.West AV et al. Labeling Preferences of Diazirines with Protein Biomolecules. J Am Chem Soc 143, 6691–6700, doi: 10.1021/jacs.1c02509 (2021). [DOI] [PMC free article] [PubMed] [Google Scholar]
- 35.Iacobucci C et al. Carboxyl-Photo-Reactive MS-Cleavable Cross-Linkers: Unveiling a Hidden Aspect of Diazirine-Based Reagents. Anal Chem 90, 2805–2809, doi: 10.1021/acs.analchem.7b04915 (2018). [DOI] [PubMed] [Google Scholar]
- 36.Fu Y & Qian X Transferred subgroup false discovery rate for rare post-translational modifications detected by mass spectrometry. Mol Cell Proteomics 13, 1359–1368, doi: 10.1074/mcp.O113.030189 (2014). [DOI] [PMC free article] [PubMed] [Google Scholar]
- 37.Yuan ZF, Lin S, Molden RC & Garcia BA Evaluation of proteomic search engines for the analysis of histone modifications. J Proteome Res 13, 4470–4478, doi: 10.1021/pr5008015 (2014). [DOI] [PMC free article] [PubMed] [Google Scholar]
- 38.Huang X et al. ISPTM: an iterative search algorithm for systematic identification of post-translational modifications from complex proteome mixtures. J Proteome Res 12, 3831–3842, doi: 10.1021/pr4003883 (2013). [DOI] [PMC free article] [PubMed] [Google Scholar]
- 39.Flaxman HA, Miyamoto DK & Woo CM Small Molecule Interactome Mapping by Photo-Affinity Labeling (SIM-PAL) to Identify Binding Sites of Small Molecules on a Proteome-Wide Scale. Curr Protoc Chem Biol 11, e75, doi: 10.1002/cpch.75 (2019). [DOI] [PMC free article] [PubMed] [Google Scholar]
- 40.Thompson A et al. Tandem mass tags: a novel quantification strategy for comparative analysis of complex protein mixtures by MS/MS. Anal Chem 75, 1895–1904 (2003). [DOI] [PubMed] [Google Scholar]
- 41.Mertins P et al. iTRAQ labeling is superior to mTRAQ for quantitative global proteomics and phosphoproteomics. Mol Cell Proteomics 11, M111 014423, doi: 10.1074/mcp.M111.014423 (2012). [DOI] [PMC free article] [PubMed] [Google Scholar]
- 42.Weerapana E et al. Quantitative reactivity profiling predicts functional cysteines in proteomes. Nature 468, 790–795, doi: 10.1038/nature09472 (2010). [DOI] [PMC free article] [PubMed] [Google Scholar]
- 43.Wang C, Weerapana E, Blewett MM & Cravatt BF A chemoproteomic platform to quantitatively map targets of lipid-derived electrophiles. Nat Methods 11, 79–85, doi: 10.1038/nmeth.2759 (2014). [DOI] [PMC free article] [PubMed] [Google Scholar]
- 44.Cisar JS & Cravatt BF Fully functionalized small-molecule probes for integrated phenotypic screening and target identification. J Am Chem Soc 134, 10385–10388, doi: 10.1021/ja304213w (2012). [DOI] [PMC free article] [PubMed] [Google Scholar]
- 45.Speers AE & Cravatt BF A tandem orthogonal proteolysis strategy for high-content chemical proteomics. J Am Chem Soc 127, 10018–10019, doi: 10.1021/ja0532842 (2005). [DOI] [PMC free article] [PubMed] [Google Scholar]
- 46.Houel S et al. Quantifying the impact of chimera MS/MS spectra on peptide identification in large-scale proteomics studies. J Proteome Res 9, 4152–4160, doi: 10.1021/pr1003856 (2010). [DOI] [PMC free article] [PubMed] [Google Scholar]
- 47.Kall L, Canterbury JD, Weston J, Noble WS & MacCoss MJ Semi-supervised learning for peptide identification from shotgun proteomics datasets. Nat Methods 4, 923–925, doi: 10.1038/nmeth1113 (2007). [DOI] [PubMed] [Google Scholar]
- 48.Taus T et al. Universal and confident phosphorylation site localization using phosphoRS. J Proteome Res 10, 5354–5362, doi: 10.1021/pr200611n (2011). [DOI] [PubMed] [Google Scholar]
- 49.Beausoleil SA, Villen J, Gerber SA, Rush J & Gygi SP A probability-based approach for high-throughput protein phosphorylation analysis and site localization. Nat Biotechnol 24, 1285–1292, doi: 10.1038/nbt1240 (2006). [DOI] [PubMed] [Google Scholar]
- 50.Savitski MM et al. Confident phosphorylation site localization using the Mascot Delta Score. Mol Cell Proteomics 10, M110 003830, doi: 10.1074/mcp.M110.003830 (2011). [DOI] [PMC free article] [PubMed] [Google Scholar]
- 51.Kong AT, Leprevost FV, Avtonomov DM, Mellacheruvu D & Nesvizhskii AI MSFragger: ultrafast and comprehensive peptide identification in mass spectrometry-based proteomics. Nat Methods 14, 513–520, doi: 10.1038/nmeth.4256 (2017). [DOI] [PMC free article] [PubMed] [Google Scholar]
- 52.McAlister GC et al. Increasing the multiplexing capacity of TMTs using reporter ion isotopologues with isobaric masses. Anal Chem 84, 7469–7478, doi: 10.1021/ac301572t (2012). [DOI] [PMC free article] [PubMed] [Google Scholar]
- 53.Simister PC, Burton NM & Brady RL Phosphotyrosine Recognition by the Raf Kinase Inhibitor Protein. 2, 59–70, doi: 10.1615/ForumImmunDisTher.v2.i1.70 (2011). [DOI] [Google Scholar]
- 54.Eathiraj S, Pan X, Ritacco C & Lambright DG Structural basis of family-wide Rab GTPase recognition by rabenosyn-5. Nature 436, 415–419, doi: 10.1038/nature03798 (2005). [DOI] [PMC free article] [PubMed] [Google Scholar]
- 55.Zheng X et al. Structure-based identification of ureas as novel nicotinamide phosphoribosyltransferase (Nampt) inhibitors. J Med Chem 56, 4921–4937, doi: 10.1021/jm400186h (2013). [DOI] [PubMed] [Google Scholar]
- 56.Robin AY et al. Crystal structure of Bax bound to the BH3 peptide of Bim identifies important contacts for interaction. Cell Death Dis 6, e1809, doi: 10.1038/cddis.2015.141 (2015). [DOI] [PMC free article] [PubMed] [Google Scholar]
- 57.Martinez Molina D et al. Monitoring drug target engagement in cells and tissues using the cellular thermal shift assay. Science 341, 84–87, doi: 10.1126/science.1233606 (2013). [DOI] [PubMed] [Google Scholar]
- 58.Jumper J et al. Highly accurate protein structure prediction with AlphaFold. Nature 596, 583–589, doi: 10.1038/s41586-021-03819-2 (2021). [DOI] [PMC free article] [PubMed] [Google Scholar]
- 59.Varadi M et al. AlphaFold Protein Structure Database: massively expanding the structural coverage of protein-sequence space with high-accuracy models. Nucleic Acids Res 50, D439–D444, doi: 10.1093/nar/gkab1061 (2022). [DOI] [PMC free article] [PubMed] [Google Scholar]
- 60.Le Guilloux V, Schmidtke P & Tuffery P Fpocket: an open source platform for ligand pocket detection. BMC Bioinformatics 10, 168, doi: 10.1186/1471-2105-10-168 (2009). [DOI] [PMC free article] [PubMed] [Google Scholar]
- 61.Ryan K et al. Dissecting the molecular determinants of clinical PARP1 inhibitor selectivity for tankyrase1. J Biol Chem 296, 100251, doi: 10.1074/jbc.RA120.016573 (2021). [DOI] [PMC free article] [PubMed] [Google Scholar]
- 62.Gustafsson R et al. Crystal Structure of the Emerging Cancer Target MTHFD2 in Complex with a Substrate-Based Inhibitor. Cancer Res 77, 937–948, doi: 10.1158/0008-5472.CAN-16-1476 (2017). [DOI] [PubMed] [Google Scholar]
- 63.Kursula P, Sikkila H, Fukao T, Kondo N & Wierenga RK High resolution crystal structures of human cytosolic thiolase (CT): a comparison of the active sites of human CT, bacterial thiolase, and bacterial KAS I. J Mol Biol 347, 189–201, doi: 10.1016/j.jmb.2005.01.018 (2005). [DOI] [PubMed] [Google Scholar]
- 64.Ogasawara D et al. Discovery and Optimization of Selective and in Vivo Active Inhibitors of the Lysophosphatidylserine Lipase alpha/beta-Hydrolase Domain-Containing 12 (ABHD12). J Med Chem 62, 1643–1656, doi: 10.1021/acs.jmedchem.8b01958 (2019). [DOI] [PMC free article] [PubMed] [Google Scholar]
- 65.Holcomb M, Chang YT, Goodsell DS & Forli S Evaluation of AlphaFold2 structures as docking targets. Protein Sci 32, e4530, doi: 10.1002/pro.4530 (2023). [DOI] [PMC free article] [PubMed] [Google Scholar]
- 66.Keller A, Nesvizhskii AI, Kolker E & Aebersold R Empirical statistical model to estimate the accuracy of peptide identifications made by MS/MS and database search. Anal Chem 74, 5383–5392, doi: 10.1021/ac025747h (2002). [DOI] [PubMed] [Google Scholar]
- 67.Eng JK, McCormack AL & Yates JR An approach to correlate tandem mass spectral data of peptides with amino acid sequences in a protein database. J Am Soc Mass Spectrom 5, 976–989, doi: 10.1016/1044-0305(94)80016-2 (1994). [DOI] [PubMed] [Google Scholar]
- 68.Muller MQ, Dreiocker F, Ihling CH, Schafer M & Sinz A Cleavable cross-linker for protein structure analysis: reliable identification of cross-linking products by tandem MS. Anal Chem 82, 6958–6968, doi: 10.1021/ac101241t (2010). [DOI] [PubMed] [Google Scholar]
- 69.Kao A et al. Development of a novel cross-linking strategy for fast and accurate identification of cross-linked peptides of protein complexes. Mol Cell Proteomics 10, M110 002212, doi: 10.1074/mcp.M110.002212 (2011). [DOI] [PMC free article] [PubMed] [Google Scholar]
- 70.Liu Y, Patricelli MP & Cravatt BF Activity-based protein profiling: the serine hydrolases. Proc Natl Acad Sci U S A 96, 14694–14699, doi: 10.1073/pnas.96.26.14694 (1999). [DOI] [PMC free article] [PubMed] [Google Scholar]
- 71.Adam GC, Cravatt BF & Sorensen EJ Profiling the specific reactivity of the proteome with non-directed activity-based probes. Chem Biol 8, 81–95, doi: 10.1016/s1074-5521(00)90060-7 (2001). [DOI] [PubMed] [Google Scholar]
- 72.Saghatelian A, Jessani N, Joseph A, Humphrey M & Cravatt BF Activity-based probes for the proteomic profiling of metalloproteases. Proc Natl Acad Sci U S A 101, 10000–10005, doi: 10.1073/pnas.0402784101 (2004). [DOI] [PMC free article] [PubMed] [Google Scholar]
- 73.Abbasov ME et al. A proteome-wide atlas of lysine-reactive chemistry. Nat Chem 13, 1081–1092, doi: 10.1038/s41557-021-00765-4 (2021). [DOI] [PMC free article] [PubMed] [Google Scholar]
- 74.Crowley VM, Thielert M & Cravatt BF Functionalized Scout Fragments for Site-Specific Covalent Ligand Discovery and Optimization. ACS Central Science 7, 613–623, doi: 10.1021/acscentsci.0C01336 (2021). [DOI] [PMC free article] [PubMed] [Google Scholar]
- 75.Bekes M, Langley DR & Crews CM PROTAC targeted protein degraders: the past is prologue. Nat Rev Drug Discov 21, 181–200, doi: 10.1038/s41573-021-00371-6 (2022). [DOI] [PMC free article] [PubMed] [Google Scholar]
Methods References
- 76.McAlister GC et al. MultiNotch MS3 enables accurate, sensitive, and multiplexed detection of differential expression across cancer cell line proteomes. Anal Chem 86, 7150–7158, doi: 10.1021/ac502040v (2014). [DOI] [PMC free article] [PubMed] [Google Scholar]
- 77.Elias JE, Haas W, Faherty BK & Gygi SP Comparative evaluation of mass spectrometry platforms used in large-scale proteomics investigations. Nat Methods 2, 667–675, doi: 10.1038/nmeth785 (2005). [DOI] [PubMed] [Google Scholar]
- 78.Elias JE & Gygi SP Target-decoy search strategy for increased confidence in large-scale protein identifications by mass spectrometry. Nat Methods 4, 207–214, doi: 10.1038/nmeth1019 (2007). [DOI] [PubMed] [Google Scholar]
- 79.Riniker S & Landrum GA Better Informed Distance Geometry: Using What We Know To Improve Conformation Generation. J Chem Inf Model 55, 2562–2574, doi: 10.1021/acs.jcim.5b00654 (2015). [DOI] [PubMed] [Google Scholar]
- 80.Rappe AK, Casewit CJ, Colwell KS, Goddard WAI & Skiff WM UFF, a full periodic table force field for molecular mechanics and molecular dynamics simulations. Journal of the American Chemical Society 114, 10024–10035, doi: 10.1021/ja00051a040 (1992). [DOI] [Google Scholar]
- 81.Word JM, Lovell SC, Richardson JS & Richardson DC Asparagine and glutamine: using hydrogen atom contacts in the choice of side-chain amide orientation. J Mol Biol 285, 1735–1747, doi: 10.1006/jmbi.1998.2401 (1999). [DOI] [PubMed] [Google Scholar]
- 82.Forli S et al. Computational protein-ligand docking and virtual drug screening with the AutoDock suite. Nat Protoc 11, 905–919, doi: 10.1038/nprot.2016.051 (2016). [DOI] [PMC free article] [PubMed] [Google Scholar]
- 83.Santos-Martins D et al. Accelerating AutoDock4 with GPUs and Gradient-Based Local Search. J Chem Theory Comput 17, 1060–1073, doi: 10.1021/acs.jctc.0c01006 (2021). [DOI] [PMC free article] [PubMed] [Google Scholar]
- 84.Wozniak J jmwozniak/DizcoProcessing: Dizco Processing (v1.0.0). doi: 10.5281/zenodo.10079747 (2023). [DOI] [Google Scholar]
Associated Data
This section collects any data citations, data availability statements, or supplementary materials included in this article.
Supplementary Materials
Data Availability Statement
The Uniprot Homo sapiens proteome database (downloaded 07/20; 74,782 sequences) was used for proteomic searches. Mass spectrometry datasets have been deposited on ProteomeXchange as follows: Benchmark SoL (PXD044869) and whole protein (PXD044870). TMT pilot SoL (PXD044886) and whole protein (PXD044887). TMT dose non-enantiomers SoL (PXD044881) and whole protein (PXD044882). TMT dose enantiomers SoL (PXD044883) and whole protein (PXD044884). Molecular modeling .pdb files have been uploaded to the Zenodo repository and can be accessed through the DOI: 10.5281/zenodo.8326534.


