

1. Introduction
Nearly 39 million people live with HIV (PLWH).[1] Antiretroviral therapy (ART) has been a mainstay for managing HIV[2,3] and typically consists of multiple active antiretrovirals (ARVs) from different drug classes. Adherence to ART remains an important concern; suboptimal adherence has the potential lead to treatment failure and HIV resistance to ARVs.[4,5] Therefore, therapeutic ARV concentrations are necessary to suppress virus in the plasma. However, despite suppressive ARV concentrations in the plasma, HIV persists in tissues, including the gastrointestinal and male and female genital tracts.[6] Understanding ARV concentrations in the tissues and sites of action is important towards HIV cure efforts.[6] This understanding is especially important as ARV concentrations vary among tissues[7] as well as in the context of recent approval of long-acting ARVs for the treatment and prevention of HIV.[8,9]
Our aim was to develop a sensitive UHPLC-MS/MS assay to quantify within human tissues the following five ARVs: bictegravir, cabotegravir, dolutegravir, doravirine, and raltegravir. We describe an ultra-high performance liquid chromatography-tandem mass spectrometry analytical method that were developed and validated to quantify these ARV concentrations in cervical, rectal, and vaginal tissues. To our knowledge, there is no currently published UHPLC-MS/MS assay that measures these five contemporary ARVs simultaneously; this method will quantify ARV concentrations in multicenter clinical trials for research agendas regarding HIV treatment and prevention.
2. Materials and methods
2.1. Chemicals and Reagents
Bictegravir, cabotegravir, cabotegravir-d5, dolutegravir, dolutegravir-d5, raltegravir, raltegravir-d4, were purchased from Cayman Chemical (Ann Arbor, MI, USA). [13C2H215N]-bictegravir, doravirine, and [13C6]-doravrine, were purchased from Alsachim (Illkirch-Graffenstaden, France). Figure 1 shows the structures of the analytes of interest as well as the internal standards. Optima LC-MS grade, acetonitrile, 2-propanol, water, methanol, and formic acid, LC-MS (98%) was purchased from Fisher Scientific (Pittsburgh, PA, USA). A Parker N2–35 Nitrogen Generation System (Haverhill, MA) was used to produce ultra-pure nitrogen gas (>99.9%) In addition, ultra-pure argon gas (>99.9%) was purchased from Matheson (Basking Ridge, NJ, USA). Blank (free of ARVs) human tissue samples were obtained from the Pitt Biospecimen Core at the University of Pittsburgh (Pittsburgh, PA, USA) while blank human plasma was obtained from the Central Blood Bank (Pittsburgh, PA, USA).
Figure 1.
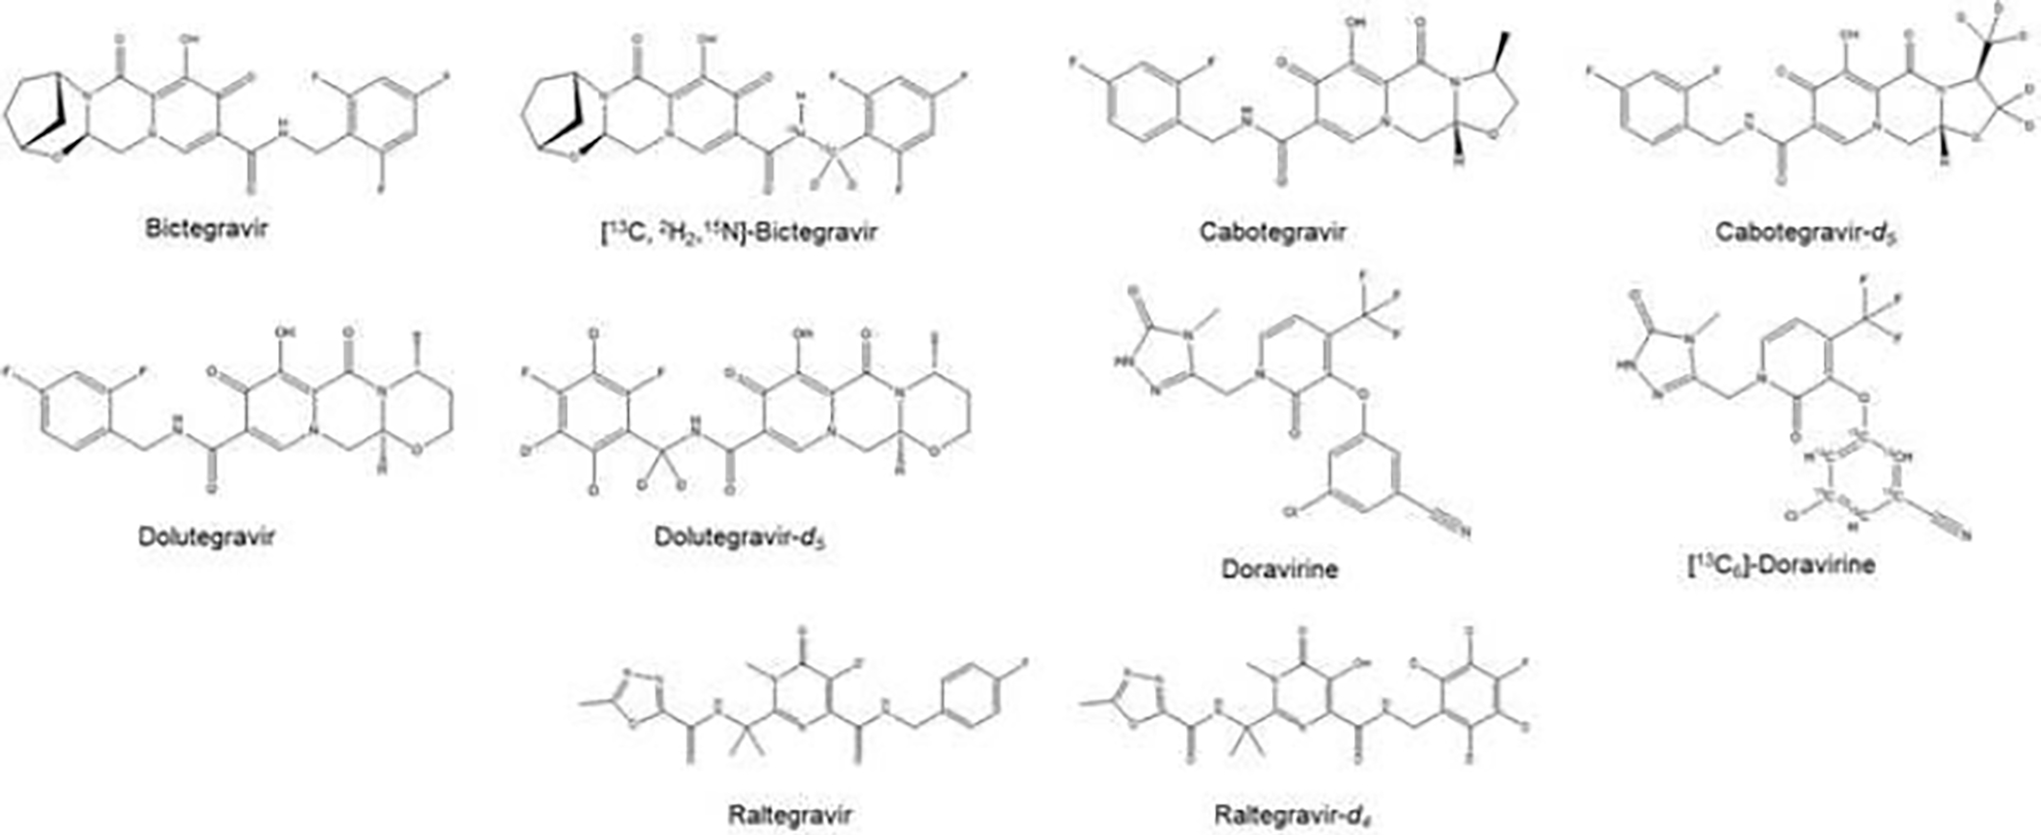
The chemical structures of the five antiretrovirals and the isotopically-labeled internal standards.
2.2. Equipment and UHPLC-MS/MS conditions
A Waters Acquity ultra-high performance liquid chromatography (UHPLC) I-class instrument which consisted of a sample manager, heated column compartment, and binary solvent manager was used to perform UHPLC analyses (Waters, Milford, MA, USA). The analytes were separated chromatographically at 55°C with a Waters Acquity CORTECS T3 (2.1 × 100 mm; 1.6 μm particles) accompanied by a CORTECS T3 Vanguard pre-column (1.6 μm; 2.1× 5 mm) (Waters, Milford, MA, USA) For all analyses, the sample manager was kept at 10°C.
The mobile phases used for separation of the analytes was water with 0.1% formic acid (A) and acetonitrile (B) at a flow rate of 0.300 mL/min. Analytes were eluted by a gradient with starting conditions of 3% B from 0–1.0 min; then was steadily increased to 20% B from 1.0– 1.5 min; then further increased to 85% B from 1.5–4.0 min; then increased to 100% B from 4.0–6.5 minutes and then returned back to the initial conditions of 3% B at 6.5 minutes. The gradient was held at 3% B from 6.5–8.5 minutes to allow for equilibration of the column before the next run. The total run time was 8.5 minutes.
MS/MS analyses were performed on a TSQ Quantis Plus mass spectrometer (Thermo Scientific, San Jose, CA, USA) that was equipped with a HESI source. The optimized mass spectrometer parameters included ion transfer capillary and vaporizer temperatures of 350°C, spray voltage of 3.0 kV, and auxiliary and sheath gas settings were 10 and 50 (arbitrary units). In addition, the collision gas pressure was 1.5 mTorr, and 0.7 m/z for quadrupole one (Q1) and 1.2 m/z for quadrupole three (Q3) were used for the full peak width at half maximum.
Positive ionization mode was used for all five ARVs using selected reaction monitoring (SRM). Table 1 shows SRM parameters that were used for this assay including the retention times, collision energies, and the monitored ion transitions. Signals from the mass spectrometer were detected and processed through Xcalibur software 4.2.47 (Thermo Scientific, San Jose, CA, USA).
Table 1.
MS/MS parameters and typical retention times of the five antiretrovirals and their respective stable isotopically-labeled compounds
| Compound | Precursor ion (m/z) | Product ion (m/z) | Collision Energy (eV) | RF Lens (V) | Retention time (min) |
|---|---|---|---|---|---|
| Bictegravir | 450.06 | 144.80 | 28.9 | 183 | 3.75 |
| [13C,2H2,15N]-Bictegravir | 454.05 | 288.96 | 28.9 | 183 | 3.75 |
| Cabotegravir | 406.01 | 126.88 | 33.7 | 170 | 3.58 |
| Cabotegravir-d5 | 411.03 | 267.96 | 33.7 | 170 | 3.58 |
| Dolutegravir | 420.04 | 126.83 | 18.0 | 151 | 3.69 |
| Dolutegravir-d5 | 425.03 | 276.97 | 18.0 | 151 | 3.69 |
| Doravirine | 425.96 | 314.88 | 17.1 | 135 | 3.84 |
| [13C6]-Doravirine | 431.94 | 320.88 | 17.1 | 142 | 3.84 |
| Raltegravir | 445.10 | 360.96 | 17.1 | 135 | 3.69 |
| Raltegravir-d4 | 449.06 | 364.96 | 17.1 | 142 | 3.69 |
2.3. Preparation of the calibration standards and quality control (QC) samples
Blank tissue was homogenized in 1 mL of 70% methanol in water using a benchtop tissue homogenizer (Fisher Scientific, Pittsburgh, PA). For stock solutions, dimethyl sulfoxide (DMSO) was used to prepare 1 mg/mL solutions of bictegravir and doravirine, 2.5 mg/mL solutions for cabotegravir and dolutegravir. Water was used to prepare a 0.5 mg/mL solution of raltegravir. Next, 80:20 water:methanol was used to prepare three intermediate stock solutions of concentrations of 10 μg/mL, 1 μg/mL, and 10 ng/mL, by diluting the original stock solutions of the ARVs. Individual sets of intermediate stocks were prepared separately for both the calibration standards and the QCs. Blank human plasma was spiked to prepare the intermediate stock solutions to produce calibration standards at concentrations of 0.05, 0.1, 0.5, 1, 10, 25, and 50 ng/mL. Four levels of QCs were prepared and assessed for this assay including the lower limit of quantitation, low, medium, and high QCs (LLOQ, LQC, MQC, and HQC). The concentrations of the QCs were 0.05 (LLOQ), 0.15 (LQC), 15 (MQC), and 40 ng/mL (HQC) and were prepared by spiking blank human tissue with the intermediate stocks. The LLOQ and LQC samples were prepared in rectal tissue, the MQC samples were prepared in vaginal tissue, and the HQC samples were prepared in cervical tissue. These were prepared as described to ensure that there was no matrix effect presented among the plasma and three tissue types. The 40 ng/mL internal standard solution was prepared by diluting internal standard stock solutions with acetonitrile. All samples, intermediate stocks, stock solutions, calibration standards, and QCs were stored at −80°C until analyses were performed.
2.4. Sample preparation
0.5 mL of the calibration standards, unknown tissue samples, or QCs were protein precipitated by adding 1000 μL of internal standard solution in acetonitrile to the samples. The samples were briefly vortexed before being centrifuged for 10 min at 10,000 × g. The supernatant (900 μL) was transferred to 12×75 mm glass tubes before being dried down at 45°C under nitrogen. 150 μL of water was used to reconstitute the samples, the samples were then vortexed before being transferred to UHPLC vials for analysis. The injection volume was 7.5 μL for UHPLC-MS/MS analyses.
2.5. Assay validation
The assay was validated in accordance with the United States Food and Drug Administration (FDA) Bioanalytical Method Validation Guidance.[10]
2.5.1. Calibration and linearity
Calibration curves were constructed by measuring the concentrations of seven different standards for the ARVs were used to generate calibration curves. The LLOQ samples were run in triplicate while the other calibration standards were run in duplicate for three consecutive days. The LLOQ was determined as the concentration that gave a reproducible, quantifiable signal for each analyte. The absolute peak-area ratios of each ARV to the internal standard were calculated and plotted against the nominal analyte concentration with 1/X2 weighting for the standard curve from each day.
2.5.2. Accuracy and precision
Six replicate LLOQ, LQC, MQC, and HQC samples for 2 consecutive days followed by 12 replicate QC samples (n = 24 of each QC) on a third day were used to determine the accuracy and precision of the assay. Intra-day accuracy and precision was calculated from the 12 replicates on the third day while inter-day accuracy and precision was determined from all 24 replicate QC samples. Accuracy (% deviation) was the calculated mean concentration relative to the spiked. The QC values were used to calculate the means, standard deviations, and coefficients of variation and used to determine the intra- and inter-day precision of the assay.
2.5.3. Matrix effect and recovery studies
In order to assess matrix effect of ARVs in tissue homogenate, the analysis of blank tissue homogenate samples spiked at the three QC concentration levels (LQC, MQC, and HQC) and then extracted were compared to methanol samples spiked at the same concentrations that did not undergo extraction. Three replicate methanol samples (control) and three samples that were spiked at each QC level were analyzed using standard curves generated that day from plasma-based standards. The measured concentrations of the methanol QC samples that were not extracted control were defined as 100%.
Comparing the post-extraction spiked tissue homogenate-based QC samples with the pre-extraction spiked tissue homogenate-based QC samples determined the recovery of the assay. The concentrations of the post-extracted spiked tissue homogenate QC samples that were measured was defined as 100%. For both the matrix effect and recovery assessments, the means, standard deviations, and coefficients of variation were determined.
2.5.4. Carryover and selectivity
Placing six vials of blank mobile phase at random locations of a sequence was used to assess carryover. Percentages of ≤20% of the LLOQs were considered acceptable for carryover. In addition, selectivity of the assays was determined by measuring six blank lots of biological matrices to ensure there were no interfering peaks for any of the ARVs in neither plasma nor tissue.
2.5.5. Stability studies
Several different stability studies were performed for samples that have been stored at −80°C by examining stability on the benchtop, in the autosampler, and after three freeze/thaw cycles. Three replicates each of LQC and HQC remained on the bench top under normal fluorescent light conditions and at room temperature for a maximum total of 4 hours and subsequently assessed against the recovery from freshly prepared samples. The results of the freshly prepared samples were defined as 100% and the results from the stability study were expressed as the percent of the first measurement. Results that were within 15% of the first value were considered stable for up to 4 hours on the bench top.
In addition, autosampler stability of the processed samples was assessed. LQC and HQC samples were processed in triplicate and were analyzed after being left in the autosampler (10°C) for 24 hours and 72 hours. Results from freshly prepared and processed samples (defined as 100%) were compared to the samples that were in the autosampler for 24 and 72 hours. Results from the samples that were in the autosampler for 24 or 72 hours were expressed in terms of percentage of the measurement from freshly prepared QC samples. The analytes were considered stable in the autosampler given these parameters if the results differed ≤15% from the value of freshly prepared samples.
Freeze/thaw cycle stability was also investigated by subjecting LQC and HQC samples to three consecutive freeze/thaw cycles (24 hours for each cycle). QC samples were prepared in triplicate and stored at −80°C before undergoing the freeze/thaw stability assessment. The results of each 24-hour freeze/thaw cycle were expressed in terms of percentage of the measurement from freshly prepared QCs. The ARV analytes were considered stable for up to three freeze/thaw cycles if the results differed by ≤15% from the freshly prepared and processed sample values.
To assess the long-term stability, freshly prepared QCs – LQC and HQC – for all tissue types were compared with QC samples stored at −80°C for 72 days. The analytes in each tissue type were considered stable under these conditions if the results differed by ≤15% from the fresh sample values.
2.5.6. Dilution analysis
ARV samples were prepared at a concentration of 100 ng/mL (two-fold greater than the highest calibration standard) and then dilution was assessed by diluting the samples 2, 3 and 5-fold prior to sample processing. All three dilution levels were processed 5 times each and back-calculated against the standard curve. Samples can be diluted up to 5-fold if the results were within 15% of the nominal concentration.
2.5.7. Clinical application
This validated assay was applied to analyze tissue samples from the University of Pittsburgh Medical Center. The protocol was approved by the University of Pittsburgh Institutional Review Board (STUDY 22110116) for rectal, vaginal, and cervical tissues. Written informed consent was obtained from each study participant. The demographics, time since the last dose, and tissue weights were recorded. Tissue samples (≥5 mg) were placed into cryogenic vials and then transferred into tissue homogenization tubes, and 1 mL of 70% methanol in water was added to each homogenization tube. The tubes were subsequently homogenized and stored at −80°C until analysis. Concentrations in clinical samples were normalized to tissue weight using a tissue density factor of 1.06 g/mL as utilized previously.[11]
3. Results and Discussion
A high-throughput UHPLC-MS/MS method that utilized simple sample processing was developed and validated for the quantification of five ARVs in tissue homogenate.
3.1. Mass Spectrometry, Chromatographic Separation, and Sample Preparation
The use of a Waters CORTECS T3 (2.1 × 100 mm; 1.6 μm) allowed for separation of the analytes while having a total run time of 8.5 minutes (7.5 minutes plus 1 minute wash). The respective MS/MS spectra are shown in Figure S1 in the Supplementary Material. Figure 2 shows examples of the LLOQ chromatograms of all five ARVs while the chromatograms of the corresponding internal standards are shown in Figure 3.
Figure 2.
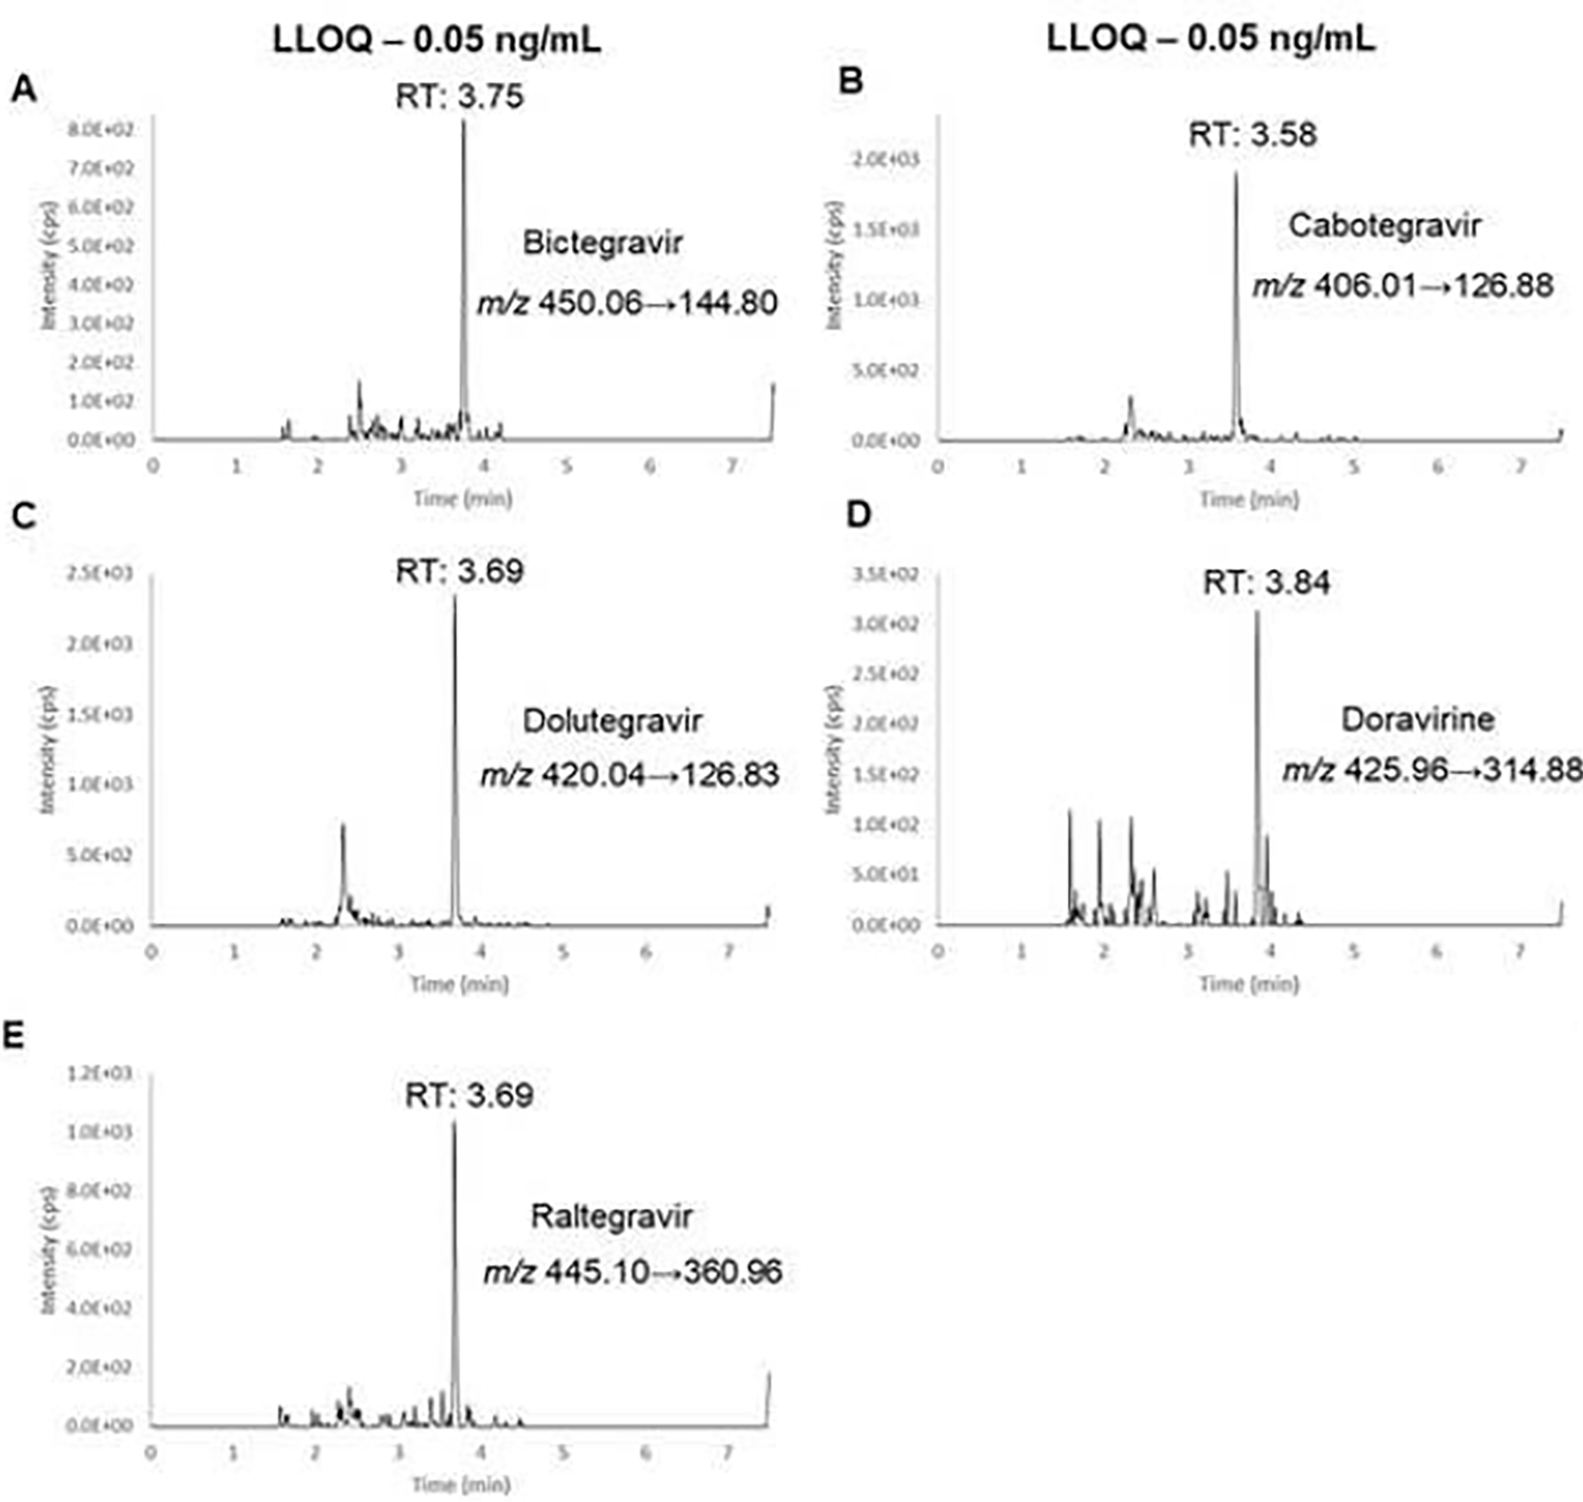
Representative chromatograms of LLOQ samples of bictegravir (A), cabotegravir (B), dolutegravir (C), doravirine (D), raltegravir (E).
Figure 3.

Representative chromatograms of stable, isotope-labeled internal standard samples of bictegravir (A), cabotegravir (B), dolutegravir (C), doravirine (D), raltegravir (E).
3.2. Assay Validation
The current ARV panel assay was validated per the FDA Bioanalytical Method Validation Guidance successfully.[10]
3.2.1. Calibration and Linearity
Standard curves were analyzed over three runs on consecutive days with each standard level analyzed in duplicate (LLOQ in triplicate) using plasma-based standards due to the ease and cost-effectiveness compared to human tissue. Standard curves were obtained for all ARVs over the concentration ranges, as shown in Table 2, with excellent linearity. During all three days of the validation, the coefficient of determination (R2) was 0.9918 or greater. Based on the signal-to-noise ratio, the LLOQ was determined to be 0.05 ng/mL for all the analytes. The suitability of the method was demonstrated due to the accuracy and precision of the data obtained from back calculated calibration standards since all values were within 15% of the nominal concentration. As a confirmation for the accuracy and precision below, the R2 values for the tissue-based calibration curve were 0.9931 or greater.
Table 2.
Antiretroviral panel assay validation results
| Analyte | LLOQ (ng/mL) | Linear range (ng/mL) | Slope (n=3) | Intercept (n=3) | Coefficient of determination (R2, n=3) |
|---|---|---|---|---|---|
| Bictegravir | 0.05 | 0.05–50 | 0.0548 | −0.0006 ± 0.0004 | 0.9930 ± 0.0024 |
| Cabotegravir | 0.0226 | 0.000044 ± 0.003 | 0.9919 ± 0.0019 | ||
| Dolutegravir | 0.0124 | 0.0001 ± 0.0001 | 0.9928 ± 0.0021 | ||
| Doravirine | 0.0280 | 0.000018 ± 0.0001 | 0.9918 ± 0.0016 | ||
| Raltegravir | 0.0139 | −0.0001 ± 0.0001 | 0.9921 ± 0.0027 |
The intercept and correlation coefficient are presented as mean ± standard deviation.
3.2.2. Accuracy and Precision
The accuracy and precision of the assay was determined by the analysis of ARV concentrations in tissue homogenate-based QC samples at four concentration levels over a three-day period. As described in Section 2.2, LLOQ and LQC samples were prepared in rectal tissue, the MQC samples were prepared in vaginal tissue, and the HQC samples were prepared in cervical tissue. The mean inter- and intra-day accuracy and precision values were within ±15% for QCs and for ±20% LLOQ (Table 3). The data demonstrated that the assay was both accurate and precise. Additionally, the tissue homogenate-based QC samples were all within 15% on a plasma-based standard curve and tissue-based standard curve (Tables S1 and S2 in the Supplementary Material). Because there was no observed difference between plasma and tissues, plasma standard curves were used to assess the subsequent studies to demonstrate successful validation given the practicality of procuring plasma more readily.
Table 3.
Intra- and inter-day accuracy and precision for the five antiretroviral LLOQ and QC samples
| Compound | Level | Nominal Concentration (ng/mL) | Intra-daya | Inter-dayb | ||
|---|---|---|---|---|---|---|
| Deviation (%) | CV% | Deviation (%) | CV% | |||
| Bictegravir | LLOQ | 0.05 | 5.6 | 9.8 | 8.1 | 10.1 |
| LQC | 0.15 | 1.0 | 9.3 | 0.0 | 9.4 | |
| MQC | 15 | −2.6 | 10.1 | −3.9 | 9.8 | |
| HQC | 40 | 1.4 | 4.4 | 0.5 | 6.6 | |
| Cabotegravir | LLOQ | 0.05 | −9.1 | 9.5 | −0.7 | 13.2 |
| LQC | 0.15 | −3.2 | 9.2 | −3.6 | 8.7 | |
| MQC | 15 | −5.8 | 10.2 | −7.7 | 9.3 | |
| HQC | 40 | −3.8 | 6.6 | −7.0 | 6.5 | |
| Dolutegravir | LLOQ | 0.05 | 3.9 | 11.6 | 1.7 | 10.6 |
| LQC | 0.15 | −1.4 | 10.0 | −2.6 | 9.3 | |
| MQC | 15 | −1.3 | 9.6 | −3.3 | 9.4 | |
| HQC | 40 | −0.3 | 3.9 | −2.4 | 6.6 | |
| Doravirine | LLOQ | 0.05 | 1.7 | 6.9 | 3.2 | 7.4 |
| LQC | 0.15 | 2.1 | 8.2 | 0.7 | 8.9 | |
| MQC | 15 | 2.4 | 8.8 | −0.9 | 8.9 | |
| HQC | 40 | 6.4 | 3.1 | 3.2 | 5.3 | |
| Raltegravir | LLOQ | 0.05 | 5.9 | 9.9 | 4.1 | 12.5 |
| LQC | 0.15 | −3.9 | 6.8 | −4.5 | 5.8 | |
| MQC | 15 | −5.2 | 8.8 | −6.7 | 8.2 | |
| HQC | 40 | −5.4 | 3.6 | −6.6 | 4.5 | |
Data are presented as the mean values for the intra-day and inter-day deviation percentages.
12 replicates for all levels.
24 replicates for all levels.
3.2.3. Matrix Effect and Recovery Studies
The mean recoveries of all ARVs at all three QC concentrations (LQC, MQC, and HQC) ranged from 85.48–107.44% (Table 4), which demonstrated there was minimal loss of the analytes of interest which led to excellent recoveries. Matrix effects were determined to be −12.57% to +4.69% in tissue samples when compared with neat samples, indicating that the matrix effects were negligible.
Table 4.
Recovery of antiretrovirals from human plasma (n = 3)
| Compound | QC Level | Nominal Concentration (ng/mL) | Recovery | Matrix Effect | ||
|---|---|---|---|---|---|---|
| % | CV% | % | CV% | |||
| Bictegravir | LQC | 0.15 | 107.44 | 5.42 | 99.71 | 6.89 |
| MQC | 15 | 96.79 | 1.11 | 102.04 | 4.37 | |
| HQC | 40 | 96.66 | 1.70 | 104.69 | 1.70 | |
| Cabotegravir | LQC | 0.15 | 93.98 | 3.68 | 100.48 | 8.38 |
| MQC | 15 | 85.48 | 1.75 | 93.72 | 1.55 | |
| HQC | 40 | 87.03 | 2.40 | 101.63 | 1.44 | |
| Dolutegravir | LQC | 0.15 | 100.81 | 3.68 | 97.95 | 10.63 |
| MQC | 15 | 92.18 | 1.75 | 92.91 | 5.91 | |
| HQC | 40 | 93.21 | 2.40 | 100.52 | 2.40 | |
| Doravirine | LQC | 0.15 | 101.95 | 11.06 | 101.19 | 4.42 |
| MQC | 15 | 100.17 | 5.58 | 96.45 | 6.09 | |
| HQC | 40 | 96.91 | 1.80 | 99.79 | 1.80 | |
| Raltegravir | LQC | 0.15 | 95.65 | 7.65 | 101.77 | 16.28 |
| MQC | 15 | 90.53 | 7.57 | 87.43 | 1.95 | |
| HQC | 40 | 86.38 | 1.62 | 100.64 | 1.62 | |
Data are presented as the mean values for the percent recovery and matrix effect.
3.2.4. Carryover and Selectivity
Carryover was assessed by randomly placing six vials of mobile phase throughout a sequence. Levels of carryover was below 20% of the LLOQ for each of the analytes; therefore, carryover was negligible for this assay. This assay also showed great selectivity since there were no endogenous analytes in the blank tissue homogenate or blank plasma lots that affected the signal for the ARVs or their respective internal standards.
3.2.5. Stability Studies
QC samples prepared in tissue homogenate were assessed for stability of the analytes tested on the benchtop at room temperature, post-processed storage in the autosampler at 10°C for up to 72 hours, after three consecutive freeze/thaw cycles, and after 72 days in −80°C. The average concentrations for each analyte for all stability studies performed were within 15% of the freshly prepared sample values. Therefore, the assay demonstrated sample stability under all the conditions that were assessed (Table 5).
Table 5.
Stability studies
| Compound | Nominal concentration (ng/mL) | Freeze/Thaw between - 80°C and RT | Autosampler at 10°C | Benchtop at RT | Long-term stability | |||
|---|---|---|---|---|---|---|---|---|
| 1 F/T | 2 F/T | 3 F/T | 24h | 72h | 4h | 72 days | ||
| Bictegravir | 0.15 | 103.9 (4.5) | 97.6 (13.2) | 89.0 (4.3) | 86.4 (2.2) | 91.7 (8.4) | 92.4 (4.1) | 104.5 (6.4) |
| 40 | 91.3 (1.0) | 105.0 (2.6) | 109.5 (1.0) | 105.7 (2.7) | 112.4 (2.4) | 92.0 (2.1) | 101.7 (8.5) | |
| Cabotegravir | 0.15 | 105.8 (6.5) | 93.8 (7.7) | 91.5 (2.1) | 86.4 (2.3) | 107.7 (2.1) | 90.6 (4.4) | 96.6 (4.4) |
| 40 | 93.2 (1.0) | 110.3 (3.1) | 107.1 (2.5) | 104.1 (3.5) | 101.1 (3.0) | 85.3 (1.4) | 113.3 (3.9) | |
| Dolutegravir | 0.15 | 106.2 (6.7) | 100.6 (9.3) | 93.3 (1.7) | 87.9 (2.1) | 106.0 (5.5) | 92.9 (6.5) | 104.4 (5.7) |
| 40 | 95.2 (1.0) | 108.9 (2.9) | 114.5 (1.4) | 109.6 (0.9) | 113.6 (1.9) | 88.8 (2.6) | 104.8 (9.0) | |
| Doravirine | 0.15 | 104.4 (0.7) | 91.9 (7.2) | 99.6 (11.4) | 85.5 (4.7) | 93.5 (5.5) | 100.2 (6.4) | 100.4 (6.3) |
| 40 | 95.2 (1.8) | 108.4 (3.6) | 107.8 (3.8) | 106.8 (1.9) | 108.3 (1.0) | 93.6 (3.0) | 99.8 (1.7) | |
| Raltegravir | 0.15 | 111.4 (5.3) | 94.0 (4.8) | 94.8 (5.0) | 94.7 (5.5) | 108.9 (3.0) | 102.2 (1.4) | 111.4 (5.4) |
| 40 | 100.0 (1.5) | 109.3 (3.4) | 112.5 (3.5) | 103.0 (2.5) | 106.8 (0.6) | 87.9 (2.2) | 109.2 (7.6) | |
Data are mean percent recoveries (CV%). N=3 for each stability study.
3.2.6. Dilution Analysis
The mean precision and accuracy values obtained for all ARVs at all dilution levels were within ±15% (Table 6). Therefore, dilution of human tissue homogenate samples before analysis did not affect accuracy and precision of this assay.
Table 6.
Dilution Studies.
| Compound | Dilution | Diluted Concentration (ng/mL) | Nominal Concentration before dilution (ng/mL) | Resulting Concentration (ng/mL) | % Deviation from nominal concentration before dilution | CV % |
|---|---|---|---|---|---|---|
|
| ||||||
| Bictegravir | 2x | 52.0 | 100 | 104.0 | 4.0 | 2.4 |
| 3x | 36.6 | 100 | 109.8 | 9.8 | 4.0 | |
| 5x | 21.2 | 100 | 106.0 | 6.0 | 2.1 | |
| Cabotegravir | 2x | 47.1 | 100 | 94.2 | −5.8 | 3.0 |
| 3x | 35.4 | 100 | 106.2 | 6.2 | 2.6 | |
| 5x | 19.5 | 100 | 97.5 | −2.5 | 5.4 | |
| Dolutegravir | 2x | 50.4 | 100 | 100.8 | 0.8 | 3.6 |
| 3x | 38.0 | 100 | 114.0 | 14.0 | 0.6 | |
| 5x | 20.9 | 100 | 104.5 | 4.5 | 3.2 | |
| Doravirine | 2x | 51.7 | 100 | 103.4 | 3.4 | 2.3 |
| 3x | 38.2 | 100 | 114.6 | 14.6 | 2.2 | |
| 5x | 20.9 | 100 | 104.5 | 4.5 | 2.4 | |
| Raltegravir | 2x | 47.8 | 100 | 95.6 | −4.4 | 2.9 |
| 3x | 37.6 | 100 | 112.8 | 12.8 | 3.3 | |
| 5x | 19.4 | 100 | 97.0 | −3.0 | 3.1 | |
Data arc presented as the mean values. N = 5 for each level of dilution.
3.2.7. Clinical Application
The assay was applied to patients receiving these ARVs. The representative chromatograms for the patient receiving cabotegravir intramuscular injection every 2 months are shown in Figure 4A–4C. The time after the last intramuscular dose was 41 days. The concentrations in the time-matched cervical, rectal, and vaginal tissues were 0.9, 1.0, 3.4 ng/mL, respectively. The respective cabotegravir tissue weight-normalized concentrations were 100, 278, 295 ng/g. For dolutegravir, the time since last dose was 14.2 hours. The representative chromatogram is shown in Figure 4D. The concentration was 4.2 ng/mL, corresponding to a tissue weight-normalized concentration of 414 ng/g. For bictegravir, the time since last dose was 11.4 hours. The representative chromatogram is shown in Figure 4E. The concentration was 7.7 ng/mL, corresponding to a tissue weight-normalized concentration of 994 ng/g. Lastly, the representative ARV-free blank tissue total ion chromatogram is shown in Figure 4F.
Figure 4.

Representative chromatograms for the patients receiving cabotegravir (A-C), bictegravir (D), dolutegravir (E), and the antiretroviral-free blank tissue sample (F).
3.2.8. Discussion
A robust UHPLC-MS/MS method for the simultaneous quantification of five contemporary ARVs in human tissue was comprehensively validated with minimal sample requirements. The sample preparation protocol included protein precipitation and demonstrated to be high-throughput and cost-effective. The panel of ARVs covers all of the guideline-recommended integrase strand transfer inhibitors for HIV-1 infection treatment[12]. Additionally and importantly, this panel covers cabotegravir, the first long-acting ARV approved for pre-exposure prophylaxis against HIV-1 infection.[13,14]
This is the first singular assay that describes quantifying the concentrations of five ARVs in three different human tissue types, which successfully builds upon other published assay applications. For instance, previous bictegravir[15] and dolutegravir[16] assays report LLOQs of 0.1 and 0.2 ng/mL, and LLOQs herein are consistently 0.05 ng/mL, particularly in the context of a large ARV panel. Relatedly, because cabotegravir concentrations at the sites of action are of utmost importance, lower limits of quantification will be necessary to capture inadequate exposure. To this end, previous applications have demonstrated limits of quantification at 25 ng/mL[17] compared to 0.05 ng/mL reported in this work, allowing us to examine a wider range of concentrations within the HIV-relevant tissue compartments especially in cases when tissue sample may be limited.
Demonstrating the robustness of the assay, we applied our method to tissue samples from patients receiving these ARVs. Based on the respective times since last dose data, the concentrations reported herein align with concentrations predicted from previous pharmacokinetic analyses in the respective tissues.[15–17] Furthermore, these concentrations generally exceed the respective HIV-suppressive concentration thresholds established in the literature.[18–20]
Conclusion
In conclusion, the validated UHPLC-MS/MS method for five ARVs in HIV-relevant tissues has been incorporated in the routine analyses within the University of Pittsburgh Small Molecule Biomarker Core. The inclusion of this method allows for collaborative opportunities to perform additional translational studies within the HIV/AIDS research space and improve patient care.
Supplementary Material
Highlights.
Despite the success of antiretroviral therapy, HIV persists in tissues
Adequate antiretroviral concentrations in tissues are necessary to suppress virus
Quantifying concentrations in tissues ensures adequate antiretroviral exposure
A UHPLC-MS/MS method was validated to quantify a panel of five antiretrovirals in human tissues
Funding:
This project used the service of the University of Pittsburgh Small Molecule Biomarker Core facility, which was graciously supported, in part, by the University of Pittsburgh Office of the Senior Vice Chancellor, Health Sciences, and the National Institutes of Health S10RR023461 and S10OD028540 as well as the Rustbelt Center for AIDS Research Clinical Sciences Core (P30AI036219). The content is solely the responsibility of the authors and does not necessarily represent the official views of National Institutes of Health.
Footnotes
Conflicts of Interest
S.A.R. has received research grants for clinical trials from Gilead Sciences and Merck & Co., Inc. The other authors have no conflicts of interest to disclose.
CRediT authorship contribution statement
Raymond West 3rd: Conceptualization, Methodology, Formal analysis, Investigation, Resources, Data curation, Writing – original draft, Writing – review & editing, Visualization, Supervision, Validation. Patrick Oberly: Investigation, Resources, Data Curation, Writing – review & editing, Validation. Amanda Saylor: Resources, Writing – Review & Editing. Sharon Riddler: Resources, Writing – Review & Editing. Thomas Nolin: Writing – Review & Editing, Supervision, Project administration. Aaron Devanathan: Formal analysis, Resources, Writing – Original Draft, Writing – Review & Editing, Supervision, Project administration.
Publisher's Disclaimer: This is a PDF file of an unedited manuscript that has been accepted for publication. As a service to our customers we are providing this early version of the manuscript. The manuscript will undergo copyediting, typesetting, and review of the resulting proof before it is published in its final form. Please note that during the production process errors may be discovered which could affect the content, and all legal disclaimers that apply to the journal pertain.
References
- [1].World Health Organization (WHO), (2023).
- [2].Teeraananchai S, Kerr SJ, Amin J, Ruxrungtham K, Law MG, HIV Med. 18 (2017) 256. [DOI] [PubMed] [Google Scholar]
- [3].Cohen MS, Chen YQ, McCauley M, Gamble T, Hosseinipour MC, Kumarasamy N, Hakim JG, Kumwenda J, Grinsztejn B, Pilotto JH, Godbole SV, Chariyalertsak S, Santos BR, Mayer KH, Hoffman IF, Eshleman SH, Piwowar-Manning E, Cottle L, Zhang XC, Makhema J, Mills LA, Panchia R, Faesen S, Eron J, Gallant J, Havlir D, Swindells S, Elharrar V, Burns D, Taha TE, Nielsen-Saines K, Celentano DD, Essex M, Hudelson SE, Redd AD, Fleming TR, HPTN 052 Study Team, N. Engl. J. Med. 375 (2016) 830.27424812 [Google Scholar]
- [4].Tolley EE, Li S, Zangeneh SZ, Atujuna M, Musara P, Justman J, Pathak S, Bekker L-G, Swaminathan S, Stanton J, Farrior J, Sista N, Int J. AIDS Soc. 22 (2019) e25408. [DOI] [PMC free article] [PubMed] [Google Scholar]
- [5].Cobb DA, Smith NA, Edagwa BJ, McMillan JM, Expert Opin. Drug Deliv. 17 (2020) 1227. [DOI] [PMC free article] [PubMed] [Google Scholar]
- [6].Devanathan AS, Cottrell ML, Clin. Pharmacol. Ther. 109 (2021) 841. [DOI] [PMC free article] [PubMed] [Google Scholar]
- [7].Devanathan AS, Pirone JR, Akkina R, Remling-Mulder L, Luciw P, Adamson L, Garcia JV, Kovarova M, White NR, Schauer AP, Blake K, Sykes C, Burgunder EM, Srinivas N, Rosen EP, Kashuba ADM, Antimicrob. Agents Chemother. 64 (2019). [DOI] [PMC free article] [PubMed] [Google Scholar]
- [8].Orkin C, Oka S, Philibert P, Brinson C, Bassa A, Gusev D, Degen O, García JG, Morell EB, Tan DHS, D’Amico R, Dorey D, Griffith S, Thiagarajah S, St Clair M, Van Solingen-Ristea R, Crauwels H, Ford SL, Patel P, Chounta V, Vanveggel S, Cutrell A, Van Eygen V, Vandermeulen K, Margolis DA, Smith KY, Spreen WR, Lancet HIV 8 (2021) e185. [DOI] [PubMed] [Google Scholar]
- [9].Landovitz RJ, Donnell D, Clement ME, Hanscom B, Cottle L, Coelho L, Cabello R, Chariyalertsak S, Dunne EF, Frank I, Gallardo-Cartagena JA, Gaur AH, Gonzales P, Tran HV, Hinojosa JC, Kallas EG, Kelley CF, Losso MH, Madruga JV, Middelkoop K, Phanuphak N, Santos B, Sued O, Valencia Huamaní J, Overton ET, Swaminathan S, Del Rio C, Gulick RM, Richardson P, Sullivan P, Piwowar-Manning E, Marzinke M, Hendrix C, Li M, Wang Z, Marrazzo J, Daar E, Asmelash A, Brown TT, Anderson P, Eshleman SH, Bryan M, Blanchette C, Lucas J, Psaros C, Safren S, Sugarman J, Scott H, Eron JJ, Fields SD, Sista ND, Gomez-Feliciano K, Jennings A, Kofron RM, Holtz TH, Shin K, Rooney JF, Smith KY, Spreen W, Margolis D, Rinehart A, Adeyeye A, Cohen MS, McCauley M, Grinsztejn B, HPTN 083 Study Team, N. Engl. J. Med. 385 (2021) 595. [DOI] [PMC free article] [PubMed] [Google Scholar]
- [10].Food and Drug Administration, (2018).
- [11].Devanathan AS, Fallon JK, White NR, Schauer AP, Van Horne B, Blake K, Sykes C, Kovarova M, Adamson L, Remling-Mulder L, Luciw P, Garcia JV, Akkina R, Pirone JR, Smith PC, Kashuba ADM, Antimicrob. Agents Chemother. 64 (2020) e01384. [DOI] [PMC free article] [PubMed] [Google Scholar]
- [12].U.S. Department of Human and Health Services (DHHS), (2022).
- [13].Marzinke MA, Hanscom B, Wang Z, Safren SA, Psaros C, Donnell D, Richardson PA, Sullivan P, Eshleman SH, Jennings A, Feliciano KG, Jalil E, Coutinho C, Cardozo N, Maia B, Khan T, Singh Y, Middelkoop K, Franks J, Valencia J, Sanchez N, Lucas J, Rooney JF, Rinehart AR, Ford S, Adeyeye A, Cohen MS, McCauley M, Landovitz RJ, Grinsztejn B, HPTN 083 study group, Lancet HIV (2023). [DOI] [PMC free article] [PubMed] [Google Scholar]
- [14].Delany-Moretlwe S, Hughes JP, Bock P, Ouma SG, Hunidzarira P, Kalonji D, Kayange N, Makhema J, Mandima P, Mathew C, Spooner E, Mpendo J, Mukwekwerere P, Mgodi N, Ntege PN, Nair G, Nakabiito C, Nuwagaba-Biribonwoha H, Panchia R, Singh N, Siziba B, Farrior J, Rose S, Anderson PL, Eshleman SH, Marzinke MA, Hendrix CW, Beigel-Orme S, Hosek S, Tolley E, Sista N, Adeyeye A, Rooney JF, Rinehart A, Spreen WR, Smith K, Hanscom B, Cohen MS, Hosseinipour MC, HPTN 084 study group, Lancet 399 (2022) 1779. [DOI] [PMC free article] [PubMed] [Google Scholar]
- [15].Imaz A, Tiraboschi JM, Niubó J, Martinez-Picado J, Cottrell ML, Domingo P, Chivite I, Negredo E, Schauer A, Van Horne B, Morenilla S, Urrea V, Silva-Klug A, Scévola S, Garcia B, Kashuba ADM, Podzamczer D, Clin. Infect. Dis. 73 (2021) e1991. [DOI] [PMC free article] [PubMed] [Google Scholar]
- [16].Greener BN, Patterson KB, Prince HMA, Sykes CS, Adams JL, Dumond JB, Shaheen NJ, Madanick RD, Dellon ES, Cohen MS, Kashuba ADM, Acquir J. Immune Defic. Syndr. 64 (2013) 39. [DOI] [PMC free article] [PubMed] [Google Scholar]
- [17].Shaik JS, Weld ED, Edick S, Fuchs E, Riddler S, Marzinke MA, D’Amico R, Bakshi K, Lou Y, Hendrix C, Han K, Ford SL, Margolis D, Spreen W, Patel P, Br. J. Clin. Pharmacol. 88 (2022) 1667. [DOI] [PMC free article] [PubMed] [Google Scholar]
Associated Data
This section collects any data citations, data availability statements, or supplementary materials included in this article.