

Abstract
Structural neuroimaging data have been used to compute an estimate of the biological age of the brain (brain‐age) which has been associated with other biologically and behaviorally meaningful measures of brain development and aging. The ongoing research interest in brain‐age has highlighted the need for robust and publicly available brain‐age models pre‐trained on data from large samples of healthy individuals. To address this need we have previously released a developmental brain‐age model. Here we expand this work to develop, empirically validate, and disseminate a pre‐trained brain‐age model to cover most of the human lifespan. To achieve this, we selected the best‐performing model after systematically examining the impact of seven site harmonization strategies, age range, and sample size on brain‐age prediction in a discovery sample of brain morphometric measures from 35,683 healthy individuals (age range: 5–90 years; 53.59% female). The pre‐trained models were tested for cross‐dataset generalizability in an independent sample comprising 2101 healthy individuals (age range: 8–80 years; 55.35% female) and for longitudinal consistency in a further sample comprising 377 healthy individuals (age range: 9–25 years; 49.87% female). This empirical examination yielded the following findings: (1) the accuracy of age prediction from morphometry data was higher when no site harmonization was applied; (2) dividing the discovery sample into two age‐bins (5–40 and 40–90 years) provided a better balance between model accuracy and explained age variance than other alternatives; (3) model accuracy for brain‐age prediction plateaued at a sample size exceeding 1600 participants. These findings have been incorporated into CentileBrain (https://centilebrain.org/#/brainAGE2), an open‐science, web‐based platform for individualized neuroimaging metrics.
Keywords: benchmarking, brain aging, brainAGE
In this work, we developed and empirically validated sex‐specific brain‐age models to cover most of the human lifespan (5–90 years). Specifically, we selected the best‐performing model after systematically examining the impact of seven site harmonization strategies, age range, and sample size on brain‐age prediction in a discovery sample of brain morphometric measures from 35,683 healthy individuals. The pre‐trained models were tested for cross‐dataset generalizability in an independent sample comprising 2101 healthy individuals and for longitudinal consistency in a further independent sample comprising 377 healthy individuals.

1. INTRODUCTION
Prior literature has documented extensive age‐related changes in brain morphology as inferred from structural magnetic resonance imaging (sMRI) studies (Bethlehem et al., 2022; Dima et al., 2022; Frangou et al., 2022; Ge et al., 2024; Hogstrom et al., 2013; Jiang et al., 2022). Machine learning algorithms can model these age‐related changes to generate an estimate of the biological age of the brain (brain‐age) (Baecker, Dafflon, et al., 2021; More et al., 2023; Schulz et al., 2020). Brain‐age estimates derived from healthy individuals can be used to establish a normative reference pattern for typical development and aging. In each individual, large deviations between brain‐age and chronological age indicate atypical development or aging (Ball et al., 2021; Cole & Franke, 2017; Franke & Gaser, 2019; Modabbernia et al., 2022).
Key parameters that influence accuracy of any brain‐age prediction workflow comprise the type of morphometric input features and machine learning algorithms, the size and age range of the sample, and the handling of site‐effects, in the case of pooled samples. Input features include voxel‐wise data (Baecker, Dafflon, et al., 2021; Baecker, Garcia‐Dias, et al., 2021; Cole, 2020), or data derived via dimensionality reduction through atlas‐based parcellation (Modabbernia et al., 2022; Kim et al., 2023) or statistical methods (e.g., principal component analysis) (Franke et al., 2013). Generally, there is limited advantage to using voxel‐wise data or highly granulated parcels (Baecker, Dafflon, et al., 2021; Baecker, Garcia‐Dias, et al., 2021; Modabbernia et al., 2022; Valizadeh et al., 2017). There are also multiple algorithms for computing brain‐age that comprise conventional methods, such as linear and Bayesian models, tree‐based and kernel‐embedded models (Schölkopf & Smola, 2002), and artificial neural networks commonly referred to as deep learning networks (Baecker, Garcia‐Dias, et al., 2021; Tanveer et al., 2023). Studies that have undertaken a comparative evaluation of these algorithms on the accuracy of sMRI‐derived brain‐age estimates collectively suggest that conventional methods outperform deep learning networks in addition to being computationally more efficient (Couvy‐Duchesne et al., 2020; de Lange et al., 2022; Grinsztajn et al., 2022; He et al., 2020; Modabbernia et al., 2022; More et al., 2023).
We have previously shown that Support Vector Regression (SVR) with Radial Basis Function (RBF) Kernel is preferable to parametric and nonparametric, Bayesian, linear and nonlinear, and other kernel‐based models particularly because of its resilience to extreme outliers (Modabbernia et al., 2022). We adopted this algorithm to build a developmental brain‐age model based on morphometric data from healthy youth aged 5–22 years (Modabbernia et al., 2022) and made this freely available to the scientific community through a web platform dedicated to providing models for individual‐level neuroimaging measures (https://centilebrain.org/#/brainAGE). Here we extend our previous work to construct brain‐age prediction models that are empirically validated and provide greater coverage of most of the human lifespan. To achieve this, we pooled brain morphometric data from 35,683 healthy individuals (aged 5–90 years), as the discovery sample, and data from an independent sample totaling 2102 healthy individuals (aged 27.74 years), as the replication sample. We evaluated the effect of age and sample composition on model performance as there is no consensus regarding the optimal method for integrating these parameters into brain‐age models. It is acknowledged that site harmonization strategies (Lombardi et al., 2020) significantly affect the performance of brain‐age models. Moreover, brain‐age studies have focused either on youth (Ball et al., 2021; Brouwer et al., 2021; Luna et al., 2021) or on middle‐aged and elderly individuals (Cole & Franke, 2017; Elliott et al., 2021). Thus, the workflow required for reliable brain‐age estimates in samples that cover most of the lifespan remains unclear. To address these knowledge gaps, we empirically evaluated the performance of the SVR‐RBF algorithm in our discovery sample using diverse site harmonization strategies and by resampling the discovery model to produce subsets of different sizes and age ranges. The resulting models were then tested on the replication sample for cross‐sample performance and longitudinal consistency. We outline our method in detail while codes and the best‐performing models are freely available on our dedicated web platform (https://centilebrain.org/#/brainAGE2).
Age prediction based on neuroimaging data is widely used for the computation of individualized measures of the pace of development or aging (Ball et al., 2021; Cole & Franke, 2017; Franke & Gaser, 2019; Modabbernia et al., 2022). Adults with older brain‐age relative to chronological age are more likely to experience negative health and cognitive outcomes (Bittner et al., 2021; Cole, 2020; Cole et al., 2018; Sone et al., 2022) leading to the recommendation for the adoption of brain age measures into clinical care (Wood et al., 2022). In children and adolescents, the role of older or younger brain‐age remains a focus of interest and research activity (Ball et al., 2021; Modabbernia et al., 2022).
In this context, the current study contributes to the field in two distinct ways. First, the models developed are freely accessible freely a web platform designed so that requires minimal computational skills or infrastructure to generate brain age data from any sample. This democratizing of the computational modeling for brain‐age empowers researchers from diverse backgrounds, fosters collaborations innovation and accelerates discoveries. Second, the availability of robust and generalizable models of brain age holds the promise of enhancing reproducibility across different research studies and provide a standardized method for brain age computation.
2. METHODS
2.1. Samples
Different independent samples were used for discovery, replication, and longitudinal consistency. These samples included pooled multisite sMRI data from Australia, East Asia, Europe, and North America (Data S1 and Figure S1, Supporting Information). The discovery sample comprised 35,683 healthy individuals (53.59% female, age range 5–90 years; Table S1). The replication sample comprised a total of 2101 healthy individuals (55.35% female, age range 8–80 years; Table S2). The longitudinal consistency sample included data from 377 healthy individuals (age range: 9–25 years; 49.87% female; Table S2) participating in the Southwest Longitudinal Imaging Multimodal Study (SLIM) and the Queensland Twin Adolescent Brain Study (QTAB). Only high‐quality morphometric measures (Data S2) were included from participants who were free of psychiatric, medical, and neurological morbidity and cognitive impairment at the time of scanning.
2.2. Brain morphometric input features
Morphometric feature extraction from whole‐brain T1‐weighted images was implemented using the standard pipelines in the FreeSurfer image analysis suite (http://surfer.nmr.mgh.harvard.edu/) to yield a total of 150 morphometric features that have been extensively utilized in prior models for predicting brain age (de Lange et al., 2022; Elliott et al., 2021; Han et al., 2021). These comprised Desikan‐Killiany atlas measures of cortical thickness (n = 68), cortical surface area (n = 68) (Desikan et al., 2006), and regional subcortical volumes (n = 14) based on the Aseg atlas (Fischl et al., 2002).
2.3. Evaluation of brain‐age models
2.3.1. Core elements
All brain‐age models evaluated were sex‐specific because of the known sex differences in brain morphometry (Ge et al., 2021; Liu et al., 2020). The method of evaluation was identical for both sexes.
All models used the same 150 input features described above.
All models used the SVR‐RBF which we adopted as our algorithm of choice as we have demonstrated its favorable performance in terms of accuracy, computational efficiency, and robustness to outliers when compared to other machine learning algorithms (Modabbernia et al., 2022). This choice is supported by independent studies that have undertaken a comparative evaluation of multiple algorithms (Beheshti et al., 2022; More et al., 2023).
The primary performance measures for all models were the mean absolute error (MAE), which represents the absolute difference between brain‐age and chronological age, and the correlation coefficient (CORR) between brain‐age and chronological age.
Brain‐age is often overestimated in younger individuals and underestimated in older people (de Lange & Cole, 2020; Liang et al., 2019). To counter this bias, we implemented a robust approach to adjust this age‐related bias following Beheshti and colleagues (Beheshti et al., 2019). However, as age bias‐corrected metrics often reflect elevated accuracy, even for models with poor performance (de Lange et al., 2022), we focus primarily on uncorrected model performance.
2.3.2. Analysis workflow
The procedures used to generate optimized sex‐specific models are illustrated in Figure 1. For all models, hyperparameter tuning (C and sigma) was performed in the discovery sample using a grid search approach in a 10‐fold cross‐validation scheme across five repetitions. In each cross‐validation, 90% of the discovery sample was used to train the model and 10% was used to test the model parameters; subsequently, the model was retrained on the entire discovery sample using the optimal hyperparameters identified from the cross‐validation process. As detailed in the subsequent sections, first, we tested three different strategies for handling site effects. The site‐harmonization strategy used in the subsequent procedures was selected based on its superior performance, as indicated by the lowest within‐sample cross‐validation MAE (MAECV) and the highest CORR (CORRCV) in the discovery sample. The model with the lowest replication MAE and highest replication CORR in the replication sample (referred to MAER and CORRR) and in the longitudinal consistency samples was chosen as the preferred model.
FIGURE 1.

Flowchart of brain age model optimization: after conducting the analysis with FreeSurfer and stratifying the samples by sex, the study proceeded as follows. (1) The discovery sample was utilized to evaluate the impact of site‐harmonization strategies and age range. This analysis yielded the optimal site‐harmonization strategy. (2) The independent replication sample was employed to further investigate the influence of age range. The outcome of this analysis led to the determination of the optimal age bins and final models. (3) The independent longitudinal consistency sample was utilized to assess the longitudinal consistency of the pre‐trained optimal models.
2.3.3. Evaluation of site effects and age range in the discovery sample
We evaluated seven site handling strategies after partitioning the discovery sample into different age bins as follows: (i) a single bin with the full sample age range (5–90 years); (ii) nine bins each covering sequential 10‐year intervals, that is, age ≤ 10 years, 10 < age ≤ 20 years, 20 < age ≤ 30 years, 30 < age ≤ 40 years, 40 < age ≤ 50 years, 50 < age ≤ 60 years, 60 < age ≤ 70 years, 70 < age ≤ 80 years, and 80 < age ≤ 90 years; (iii) four bins each covering sequential 20‐year intervals, that is, age ≤ 20 years, 20 < age ≤ 40 years, 40 < age ≤ 60 years, and 60 < age ≤ 80 years; (iv) three bins each covering sequential 30‐year intervals, that is, age ≤ 30 years, 30 < age ≤ 60 years, and 60 < age ≤ 90 years; (v) two age bins each covering sequential 40‐year intervals, that is, age ≤ 40 years and 40 < age ≤ 90 years. Seven site handling strategies were separately applied to each bin to perform data residualization with respect to site using: (i) Combat‐GAM (Pomponio et al., 2020); (ii) CovBat without age variability preservation (Chen et al., 2021); (iii) CovBat with age variability preservation (Chen et al., 2021); (iv) Subsampling Maximum‐mean‐distance Algorithm (SMA) (Wang et al., 2023; Zhou et al., 2018); (v) Invariant Conditional Variational Auto‐Encoder (ICVAE) (Moyer et al., 2020; Wang et al., 2023); (vi) generalized linear model (de Lange et al., 2022); and (vii) no site harmonization. In the case of Combat‐GAM, age was specified as the smooth term in the model while the empirical Bayes estimates were used for site effects, without custom boundaries for the smoothing terms. ComBat‐GAM was implemented using Python (version 3.8.10) scripts. The CovBat approach was implemented using R scripts (version 3.6.0). The SMA method was implemented using Matlab (version R2021a) with the largest sample as the target site, in accordance with recommendations of Wang et al. (2023) The ICVAE was implemented using Python (version 3.8.10). To prevent data leakage, the harmonization process was applied separately to the training and test datasets during cross‐validation. The approach and age partition with the best‐performing MAECV and CORRCV values were considered for further evaluation.
2.3.4. Evaluation of site effects and age range in the replication sample
The replication sample was partitioned in age bins similarly to the discovery sample and the pre‐trained models were applied. The age bin partition that yielded the highest performing MAER and CORRR values was identified as the preferred age bins.
2.3.5. Estimation of the minimum sample size
The discovery sample was randomly partitioned into 30 sex‐specific subsets, ranging from 200 to 6000 participants in increments of 200, without replacement. The robustness of the optimized sex‐specific models to sample size in terms of CORRCV and MAECV was assessed in each partition using 10‐fold cross‐validation with five repetitions. This analysis was performed individually for each of the preferred age bins according to section 2.3.4.
2.3.6. Longitudinal consistency
The sample used to test longitudinal consistency included T1‐weighted scans from a total of 377 participants scanned twice with an average interval of 1.89 (0.56) years. This sample was also divided into the preferred age bins as in the discovery and replication samples in section 2.3.4. The percentage change in MAE and CORR between the second scan and the first scan was evaluated in each age bin.
3. RESULTS
3.1. Site and sample age range
Figure 2 illustrates cross‐validated model performance for the different site harmonization approaches. For simplicity, we display the results for the 40‐year age‐bins averaged across sexes (Figures S2 and S3 provide sex‐specific results). For both sexes, omitting site correction demonstrated superior performance in terms of attaining the lowest MAECV values and highest CORRCV values compared to the other six site harmonization approaches. Consequently, the models that did not employ site harmonization were used in all subsequent analyses.
FIGURE 2.

Effect of site harmonization approach on the performance of models derived from repeated cross‐validation in different age bins of the discovery sample. Each bar represents one of the seven site handling methods. CORR, correlation coefficient between brain‐age and chronological age; MAE, mean absolute error between brain‐age and chronological age. Sex‐specific results in Figures S2 and S3.
The CORR and MAE were generally higher for models from age bins with a wider age range (Figures S4 and S5). In other words, such models accounted for more of the variance in age but were less accurate. Therefore, to achieve a balance between CORR and MAE, we selected the two‐bin partition with sequential 40‐year intervals (i.e., 5–40 and 40–90 years). Figure 3 illustrates these results across both sexes. By adopting this approach, we managed to combine a relatively low MAE with a relatively high CORR across sexes in the two age bins. Specifically, the average MAECV and CORRCV were 3.55 (1.17) years and 0.79 (0.10) and the average MAER and CORRR were 5.28 years and 0.68 in the two‐bin partition (i.e., 40‐year intervals).
FIGURE 3.

Performance metrics derived from the application of the models pre‐trained on different age bins of the discovery sample to the corresponding age bins of the replication sample. CORR values averaged across sexes were 0.68 for 40‐year interval bins; and 0.86 for the full age range of the sample. MAE values averaged across sexes were 5.28 years for 40‐year interval bins; and 8.52 years for the full age range of the sample. Sex‐specific results are presented in Figure S4. CORR, correlation coefficient between brain‐age and chronological age; MAE, mean absolute error between brain‐age and chronological age.
Age‐bias adjustment generally improved the CORRCV and MAECV by 79.67% and 35.56%, respectively, in the discovery sample (Tables S3 and S4) and improved the CORRR and MAER by 287.06% and 41.79% in the replication sample (Tables S5 and S6).
3.2. Effect of sample size
Figure 4 illustrates the effect of sample size in the discovery and replication samples using pre‐trained models that were tested in 30 sex‐specific subsets, ranging from 200 to 6000 participants in increments of 200, without replacement. In the discovery sample, the CORRCV improved in line with sample increase up to a size of 1600 participants and it plateaued thereafter; the MAECV on the other hand exhibited smaller variation as a function of sample size and plateaued around 1000 participants (Figure S6 for sex‐specific results). Similarly, in the replication sample, the CORRR increased, and MAER decreased as a function of the sample size until it reached 1600 participants and plateaued thereafter.
FIGURE 4.

Model performance as a function of the sample size in the two age bins (5–40 and 40–90 years) of the discovery sample. Model parameters for each bin were obtained by randomly resampling the discovery sample without replacement generating subsets of 200–6000 participants. The results are shown here as averages across sexes and the sex‐specific findings are presented in Figure S6. CORR, correlation coefficient between brain‐age and chronological age; MAE, mean absolute error between brain‐age and chronological age.
3.3. Longitudinal consistency
Figure 5 illustrates the stability of the pre‐trained models in each age bin using the longitudinal consistency sample. The results indicated that models utilizing the two‐bin partition (i.e., 5–40 and 40–90 years) achieved optimal consistency on the longitudinal data. Sex‐specific results are shown in Tables S7 and S8. On average, age‐bias adjustment improved the CORR and MAE by 63.50% and 30.54%, respectively, in the first scan of the longitudinal consistency sample; and age‐bias adjustment improved the CORR and MAE by 73.39% and 20.87%, respectively, in the second scan of the longitudinal consistency sample (Tables S7 and S8).
FIGURE 5.
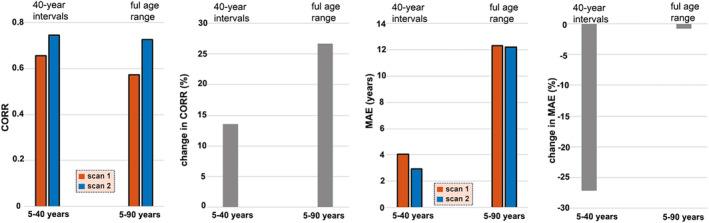
Model performance in longitudinal data. The left panel presents the CORR and MAE values for the first and second MRI scans, while the right panel exhibits the percentage changes (%) in CORR and MAE for the second scan compared to the first scan. The results were generated by employing models that had been trained on discovery samples from each age range division and then applied to the longitudinal consistency sample. CORR, correlation coefficient between brain‐age and chronological age; MAE, mean absolute error between brain age and chronological age.
3.4. Data and model availability
Information about data availability is provided in Tables S1 and S2. Our dedicated web portal freely provides the optimal model parameters to be applied to any user‐specified dataset in the context of open science. In addition to the pre‐trained sex‐specific models, the website provides tutorials and codes (https://centilebrain.org/#/tutorial4).
4. DISCUSSION
There is increased emphasis on the potential translational value of individualized neuroimaging measures such as brain‐age that can be used to track deviation from typical brain development and aging (Ball et al., 2021; Cole & Franke, 2017; Franke & Gaser, 2019; Modabbernia et al., 2022). The literature on morphometry‐derived brain‐age models from healthy individuals shows performance heterogeneity that is predicated on methodological differences in the specific features used, the algorithm employed, the handling of site‐effects, the sample size, and age distribution. The aim of the current investigation was to provide a benchmarked resource to be used as a normative reference for brain‐age by the scientific community. Having such a resource accomplishes at least four important objectives. First, it enables harmonization of the methods and models available for brain‐age computation across studies. Second, it empowers researchers who do not have access to large normative datasets to generate reliable brain‐age estimates in their own datasets. Third, it supports rigor and reproducibility in brain‐age research. Fourth, together with our developmental brain‐age model (Modabbernia et al., 2022), also available through our web platform, it provides models that cover most of the human lifespan (5–90 years) thus meeting the needs of researchers working in development or aging.
Following a systematic empirical evaluation, we selected SVR‐RBF as the key algorithm (Modabbernia et al., 2022), and in this study, we determined the optimal site handling method for our model as well as the optimal age distribution for brain‐age computation across most of the lifespan. This detailed evaluation was necessary as multiple prior studies have shown that site harmonization strategies as well as sample age distribution and size can influence model performance (de Lange et al., 2022). As in previous reports, we found an inverse association between the age range of a sample, the MAE of the model, and the coefficient of correlation between brain‐age and chronological age (de Lange et al., 2022). MAE is generally lower in samples with a narrower age range which is attributable to the minimization of errors when the predicted brain‐age approximates the mean chronological age of a sample. Concomitantly, the correlation between brain‐age and chronological age becomes lower the narrower the age range of a sample (de Lange et al., 2022). Previous reports have also shown that model accuracy for brain‐age is generally better with larger sample sizes (de Lange et al., 2022). Here we confirm this observation, and we also show that this relationship plateaus in samples with over 1600 participants. This finding is particularly useful for evaluating the robustness of other existing models and for planning future studies.
The model proposed here suggests that an optimal balance between MAE and CORR is achieved when the lifespan sample is partitioned into two sequential age bins, 5–40 and 40–90 years. The age‐bias corrected MAE and CORR values for females in the 5–40 years age bin were 3.53 and 0.83, respectively, and in the 40–90 years age bin they were 4.45 and 0.86, respectively (also Table S5). In males, the age‐bias corrected MAE and CORR values for females in the 5–40 years age bin were 3.60 and 0.84, respectively, and in the 40–90 years age‐bin, they were 4.09 and 0.87, respectively (also Table S6). These values are well within the range reported in other studies that have evaluated different computational approaches to brain‐age in healthy individuals. For example, More and colleagues (More et al., 2023) reported a range of MAE values between 4 and 8 years.
We appreciate that brain morphometric features are not the only type of neuroimaging measures that can be used to derive brain‐age estimates. Other studies have used other neuroimaging modalities (Beck et al., 2021; Goyal et al., 2019; Lund et al., 2022; Zhou et al., 2023) or combinations of modalities (Cole, 2020; Niu et al., 2020; Rokicki et al., 2021). Although it is important for the field to have a range of options for computing brain‐age that can accommodate a variety of scientific questions, the wide availability and relative ease of acquiring and extracting brain morphometric data contribute to the popularity and preponderance of brain‐age studies that use such data.
In conclusion, we present empirically validated models for brain‐age that can accommodate studies using data across most of the lifespan. We have outlined the methodological choices that have led to these models as well as their performance within and across samples as well as longitudinally.
CONFLICT OF INTEREST STATEMENT
Jair C. Soares reports the following conflicts of interest: ALKERMES (Advisory Board), BOEHRINGER Ingelheim (Consultant), COMPASS Pathways (Research Grant), JOHNSON & JOHNSON (Consultant), LIVANOVA (Consultant), RELMADA (Research Grant), SUNOVION (Research Grant), and Mind Med (Research Grant).
Supporting information
Figure S1. Distribution of participants' chronological age.
Figure S2. Model performance by site handling approach in the discovery sample in females.
Figure S3. Model performance by site handling approach in the discovery sample in males.
Figure S4. Performance metrics derived from the application of the models pre‐trained on the discovery sample to the different age bins of the replication sample.
Figure S5. Scatterplots of the relationship between brain age and chronological age in different age bins.
Figure S6. Model performance as a function of sample size for the preferred model.
Table S1. Details of the discovery sample.
Table S2. Details of the replication and consistency samples.
Table S3. Females only. Mean and standard deviation (SD) of the mean absolute error (MAE) and of the correlation coefficient between the chronological age and brain‐age in the discovery sample (CORR); adjusted MAE and adjusted CORR were corrected for age‐bias.
Table S4. Males only. Mean and standard deviation (SD) of the mean absolute error (MAE) and of the correlation coefficient (CORR) between the chronological age and brain‐age in the discovery sample; adjusted MAE and adjusted CORR were corrected for age‐bias.
Table S5. Females only. Mean and standard deviation (SD) of the mean absolute error (MAE) and of the correlation coefficient (CORR) between the chronological age and brain‐age in the replication sample; adjusted MAE and adjusted CORR were corrected for age‐bias.
Table S6. Males only. Mean and standard deviation (SD) of the mean absolute error (MAE) and of the correlation coefficient (CORR) between the chronological age and brain‐age in the replication sample; adjusted MAE and adjusted CORR were corrected for age‐bias.
Table S7. Pre‐trained model performances in the independent longitudinal‐consistency sample with different age ranges of female participants. CORR, correlation coefficient between the chronological age and predicted brain age; MAE, mean absolute error.
Table S8. Pre‐trained model performances in the independent longitudinal‐consistency sample with different age ranges of male participants. CORR, correlation coefficient between the chronological age and predicted brain age; MAE, mean absolute error.
ACKNOWLEDGMENTS
Andrew J. Saykin has received support from Avid Radiopharmaceuticals, a subsidiary of Eli Lilly (in kind contribution of PET tracer precursor); Bayer Oncology (Scientific Advisory Board); Eisai (Scientific Advisory Board); Novo Nordisk (Scientific Advisory Board). Barbara Franke has received educational speaking fees from Medice. Ian B. Hickie is the Co‐Director, Health and Policy at the Brain and Mind Centre (BMC) University of Sydney. The BMC operates an early‐intervention youth services at Camperdown under contract to headspace. He is the Chief Scientific Advisor to, and a 3.2% equity shareholder in, InnoWell Pty Ltd which aims to transform mental health services through the use of innovative technologies. Central funding to ENIGMA was provided by the following NIH grants (to Paul M. Thompson): U54 EB020403 from the Big Data to Knowledge (BD2K) Program, R56 AG058854 (The ENIGMA World Aging Center), R01 MH116147 (The ENIGMA Sex Differences Initiative). Luisa Lazaro is supported by the Marato TV3 Foundation grants 01/2010 and the Carlos III Health Institute grants PI040829. A scholar grant to Lars Nyberg from the Knut and Alice Wallenberg (KAW) Foundation. The BIG database, established in Nijmegen in 2007, is now part of Cognomics, a joint initiative by researchers of the Donders Centre for Cognitive Neuroimaging, the Human Genetics and Cognitive Neuroscience departments of the Radboud university medical centre, and the Max Planck Institute for Psycholinguistics. The Cognomics Initiative is supported by the participating departments and centres and by external grants, including grants from the Biobanking and Biomolecular Resources Research Infrastructure (Netherlands) (BBMRI‐NL) and the Hersenstichting Nederland. The authors also acknowledge grants supporting their work from the Netherlands Organization for Scientific Research (NWO), i.e., the NWO Brain & Cognition Excellence Program (grant 433‐09‐229), the Vici Innovation Program (grant 016‐130‐669 to BF) and 91619115. Additional support is received from the European Community's Seventh Framework Programme (FP7/2007–2013) under grant agreements no. 602805 (Aggressotype), no. 603016 (MATRICS), no. 602450 (IMAGEMEND), and no. 278948 (TACTICS), and from the European Community's Horizon 2020 Programme (H2020/2014–2020) under grant agreements no. 643051 (MiND) and no. 667302 (CoCA). The NeuroIMAGE study was supported by NIH grant R01MH62873, NWO Large Investment grant 1750102007010, ZonMW grant 60‐60600‐97‐193, NWO grants 056‐13‐015 and 433‐09‐242, and matching grants from Radboud University Nijmegen Medical Center, University Medical Center Groningen and Accare, and Vrije Universiteit Amsterdam. The work was further supported by the EU‐AIMs programme and AIMS‐2‐TRIALS programme which receive support from Innovative Medicines Initiative Joint Undertaking grant no. 115300 and 777394, the resources of which are composed of financial contributions from the European Union's FP7 and Horizon2020 Programmes, and from the European Federation of Pharmaceutical Industries and Associations (EFPIA) companies' in‐kind contributions, and AUTISM SPEAKS, Autistica and SFARI; and by the Horizon2020 supported programme CANDY grant no. 847818). The funders had no role in the design of the study; in the collection, analyses, or interpretation of data; in the writing of the manuscript, or in the decision to publish the results. Any views expressed are those of the author(s) and not necessarily those of the funders. Barbara Franke was supported by funding from the European Community's Horizon 2020 Programme (H2020/2014–2020) under grant agreement no. 847879 (PRIME). They also received relevant funding from the Netherlands Organization for Scientific Research (NWO) for the GUTS project (grant 024.005.011). Steven C. R. Williams is supported by the National Institute for Health Research (NIHR) Maudsley Biomedical Research Centre at South London and Maudsley NHS Foundation Trust and King's College London. Henrik Walter is supported by the German Research Foundation, WA 1539/11‐1. Shalaila S. Haas is supported by the National Institute of Mental Health (NIMH), grant T32MH122394. For Indiana 1.5T; Indiana 3T: NIH grants P30 AG010133, R01 AG019771 and R01 CA129769; Siemens Medical Solutions; the members of the Partnership for Pediatric Epilepsy Research, which includes the American Epilepsy Society, the Epilepsy Foundation, the Epilepsy Therapy Project, Fight Against Childhood Epilepsy and Seizures (F.A.C.E.S.), and Parents Against Childhood Epilepsy (P.A.C.E.); the GE/NFL Head Health Challenge I; the Indiana State Department of Health Spinal Cord and Brain Injury Fund Research Grant Program; a Project Development Team within the ICTSI NIH/NCRR grant no. RR025761. Anrew J. Saykin receives support from multiple NIH grants (P30 AG010133, P30 AG072976, R01 AG019771, R01 AG057739, U01 AG024904, R01 LM013463, R01 AG068193, T32 AG071444, U01 AG068057, and U01 AG072177; he has also received support from Avid Radiopharmaceuticals, a subsidiary of Eli Lilly (in kind contribution of PET tracer precursor); Bayer Oncology (Scientific Advisory Board); Eisai (Scientific Advisory Board); Novo Nordisk (Scientific Advisory Board). Fabrizio Piras is supported by grant RF‐2019‐12370182. Gianfranco Spalletta and Daniela Vecchio were supported by the Italian ministry of health ricerca corrente 23. Eveline A. Crone was supported by the European Research Council (ERC CoG PROSOCIAL 681632). Research Council of Norway (223273, 288083, 323951); South‐Eastern Norway Regional Health Authority (2019069, 2021070, 2023012, 500189). The Sydney Memory and Ageing Study has been funded by three National Health & Medical Research Council (NHMRC) Program grants (ID350833, ID568969, and APP1093083). The OATS study has been funded by an NHMRC and Australian Research Council (ARC) Strategic Award Grant of the Ageing Well, Ageing Productively Program (401162); NHMRC Project (seed) grants (1024224 and 1025243); NHMRC Project grants (1045325 and 1085606); and NHMRC Program grants (568969 and 1093083). Julian Trollor is also funded by NHMRC Investigator Grant GNT2009771. Vincent P. Clark is supported by the Department of Energy DEFG02‐99ER62764. This work was supported by National Health and Medical Research Council of Australia (NHMRC) Project Grants (1064643) to Ben J. Harrison and to Christopher G. Davey (1024570). This work was funded by the German Research Foundation (SFB‐TRR58, Project C09 to Udo Dannlowski). Patricia J. Conrod is supported by Canadian Institutes of Health Research (126053). Data collection and sharing for the Pediatric Imaging, Neurocognition and Genetics (PING) Study (National Institutes of Health Grant RC2DA029475) were funded by the National Institute on Drug Abuse and the Eunice Kennedy Shriver National Institute of Child Health & Human Development. A full list of PING investigators is at http://pingstudy.ucsd.edu/investigators.html. Katie L. McMahon is supported by NHMRC funding. Ian B. Hickie is supported by the NHMRC Fellowship. Colm McDonald is supported by the Health Research Board Ireland. This work was partially supported by NIMH (1R01MH085667‐01A1), John S. Dunn Foundation (Houston, Texas), and Pat Rutherford Chair in Psychiatry (UTHealth Houston). Neda Jahanshad is supported by R01AG059874, R01MH117601, R01NS107513, R01AG058854, P41EB015922. Hilleke Hulshoff Pol acknowledges the Dutch Research Council (NWO 51.02.61, NWO‐NIHC Programs of excellence 433‐09‐220).
Yu, Y. , Cui, H.‐Q. , Haas, S. S. , New, F. , Sanford, N. , Yu, K. , Zhan, D. , Yang, G. , Gao, J.‐H. , Wei, D. , Qiu, J. , Banaj, N. , Boomsma, D. I. , Breier, A. , Brodaty, H. , Buckner, R. L. , Buitelaar, J. K. , Cannon, D. M. , Caseras, X. , Clark, V. P. , Conrod, P. J. , Crivello, F. , Crone, E. A. , Dannlowski, U. , Davey, C. G. , de Haan, L. , de Zubicaray, G. I. , Di Giorgio, A. , Fisch, L. , Fisher, S. E. , Franke, B. , Glahn, D. C. , Grotegerd, D. , Gruber, O. , Gur, R. E. , Gur, R. C. , Hahn, T. , Harrison, B. J. , Hatton, S. , Hickie, I. B. , Hulshoff Pol, H. E. , Jamieson, A. J. , Jernigan, T. L. , Jiang, J. , Kalnin, A. J. , Kang, S. , Kochan, N. A. , Kraus, A. , Lagopoulos, J. , Lazaro, L. , McDonald, B. C. , McDonald, C. , McMahon, K. L. , Mwangi, B. , Piras, F. , Rodriguez‐Cruces, R. , Royer, J. , Sachdev, P. S. , Satterthwaite, T. D. , Saykin, A. J. , Schumann, G. , Sevaggi, P. , Smoller, J. W. , Soares, J. C. , Spalletta, G. , Tamnes, C. K. , Trollor, J. N. , Van't Ent, D. , Vecchio, D. , Walter, H. , Wang, Y. , Weber, B. , Wen, W. , Wierenga, L. M. , Williams, S. C. R. , Wu, M.‐J. , Zunta‐Soares, G. B. , Bernhardt, B. , Thompson, P. , Frangou, S. , Ge, R. , & ENIGMA‐Lifespan Working Group (2024). Brain‐age prediction: Systematic evaluation of site effects, and sample age range and size. Human Brain Mapping, 45(10), e26768. 10.1002/hbm.26768
Yuetong Yu and Hao‐Qi Cui are co‐first authors.
DATA AVAILABILITY STATEMENT
The data that support the findings of this study are available on request from the corresponding author. The data are not publicly available due to privacy or ethical restrictions.
REFERENCES
- Baecker, L. , Dafflon, J. , da Costa, P. F. , Garcia‐Dias, R. , Vieira, S. , Scarpazza, C. , Calhoun, V. D. , Sato, J. R. , Mechelli, A. , & Pinaya, W. H. L. (2021). Brain age prediction: A comparison between machine learning models using region‐ and voxel‐based morphometric data. Human Brain Mapping, 42(8), 2332–2346. 10.1002/hbm.25368 [DOI] [PMC free article] [PubMed] [Google Scholar]
- Baecker, L. , Garcia‐Dias, R. , Vieira, S. , Scarpazza, C. , & Mechelli, A. (2021). Machine learning for brain age prediction: Introduction to methods and clinical applications. EbioMed, 72, 103600. 10.1016/j.ebiom.2021.103600 [DOI] [PMC free article] [PubMed] [Google Scholar]
- Ball, G. , Kelly, C. E. , Beare, R. , & Seal, M. L. (2021). Individual variation underlying brain age estimates in typical development. NeuroImage, 235, 118036. 10.1016/j.neuroimage.2021.118036 [DOI] [PubMed] [Google Scholar]
- Beck, D. , de Lange, A. G. , Maximov, I. I. , Richard, G. , Andreassen, O. A. , Nordvik, J. E. , & Westlye, L. T. (2021). White matter microstructure across the adult lifespan: A mixed longitudinal and cross‐sectional study using advanced diffusion models and brain‐age prediction. NeuroImage, 224, 117441. 10.1016/j.neuroimage.2020.117441 [DOI] [PubMed] [Google Scholar]
- Beheshti, I. , Ganaie, M. A. , Paliwal, V. , Rastogi, A. , Razzak, I. , & Tanveer, M. (2022). Predicting brain age using machine learning algorithms: A comprehensive evaluation. IEEE Journal of Biomedical and Health Informatics, 26(4), 1432–1440. 10.1109/JBHI.2021.3083187 [DOI] [PubMed] [Google Scholar]
- Beheshti, I. , Nugent, S. , Potvin, O. , & Duchesne, S. (2019). Bias‐adjustment in neuroimaging‐based brain age frameworks: A robust scheme. Neuroimage: Clinical, 24, 102063. 10.1016/j.nicl.2019.102063 [DOI] [PMC free article] [PubMed] [Google Scholar]
- Bethlehem, R. A. I. , Seidlitz, J. , White, S. R. , Vogel, J. W. , Anderson, K. M. , Adamson, C. , Adler, S. , Alexopoulos, G. S. , Anagnostou, E. , Areces‐Gonzalez, A. , Astle, D. E. , Auyeung, B. , Ayub, M. , Bae, J. , Ball, G. , Baron‐Cohen, S. , Beare, R. , Bedford, S. A. , Benegal, V. , … Alexander‐Bloch, A. F. (2022). Brain charts for the human lifespan. Nature, 604(7906), 525–533. 10.1038/s41586-022-04554-y [DOI] [PMC free article] [PubMed] [Google Scholar]
- Bittner, N., Jockwitz, C., Franke, K., Gaser, C., Moebus, S., Bayen, U. J., Amunts, K., & Caspers, S. (2021). When your brain looks older than expected: combined lifestyle risk and BrainAGE. Brain structure & function, 226(3), 621–645. 10.1007/s00429-020-02184-6 [DOI] [PMC free article] [PubMed]
- Brouwer, R. M. , Schutte, J. , Janssen, R. , Boomsma, D. I. , Hulshoff Pol, H. E. , & Schnack, H. G. (2021). The speed of development of adolescent brain age depends on sex and is genetically determined. Cerebral Cortex, 31(2), 1296–1306. 10.1093/cercor/bhaa296 [DOI] [PMC free article] [PubMed] [Google Scholar]
- Chen, A. , Beer, J. , Tustison, N. , Cook, P. , Shinohara, R. , & Shou, H. (2021). The Alzheimer's Disease Neuroimaging Initiative. Mitigating site effects in covariance for machine learning in neuroimaging data. Human Brain Mapping, 43, 1179–1195. 10.1002/hbm.25688 [DOI] [PMC free article] [PubMed] [Google Scholar]
- Cole, J. H. (2020). Multimodality neuroimaging brain‐age in UK biobank: Relationship to biomedical, lifestyle, and cognitive factors. Neurobiology of Aging, 92, 34–42. 10.1016/j.neurobiolaging.2020.03.014 [DOI] [PMC free article] [PubMed] [Google Scholar]
- Cole, J. H. , & Franke, K. (2017). Predicting age using neuroimaging: Innovative brain ageing biomarkers. Trends in Neurosciences, 40(12), 681–690. 10.1016/j.tins.2017.10.001 [DOI] [PubMed] [Google Scholar]
- Cole, J. H., Ritchie, S. J., Bastin, M. E., Valdés Hernández, M. C., Muñoz Maniega, S., Royle, N., Corley, J., Pattie, A., Harris, S. E., Zhang, Q., Wray, N. R., Redmond, P., Marioni, R. E., Starr, J. M., Cox, S. R., Wardlaw, J. M., Sharp, D. J., & Deary, I. J. (2018). Brain age predicts mortality. Molecular psychiatry, 23(5), 1385–1392. 10.1038/mp.2017.62 [DOI] [PMC free article] [PubMed]
- Couvy‐Duchesne, B. , Faouzi, J. , Martin, B. , Thibeau‐Sutre, E. , Wild, A. , Ansart, M. , Durrleman, S. , Dormont, D. , Burgos, N. , & Colliot, O. (2020). Ensemble learning of convolutional neural network, support vector machine, and best linear unbiased predictor for brain age prediction: ARAMIS contribution to the predictive analytics competition 2019 challenge. Frontiers in Psychiatry, 11, 593336. 10.3389/fpsyt.2020.593336 [DOI] [PMC free article] [PubMed] [Google Scholar]
- de Lange, A. G. , & Cole, J. H. (2020). Commentary: Correction procedures in brain‐age prediction. Neuroimage: Clinical, 26, 102229. 10.1016/j.nicl.2020.102229 [DOI] [PMC free article] [PubMed] [Google Scholar]
- de Lange, A. G. , Anatürk, M. , Rokicki, J. , Han, L. K. M. , Franke, K. , Alnaes, D. , Ebmeier, K. P. , Draganski, B. , Kaufmann, T. , Westlye, L. T. , Hahn, T. , & Cole, J. H. (2022). Mind the gap: Performance metric evaluation in brain‐age prediction. Human Brain Mapping, 43(10), 3113–3129. 10.1002/hbm.25837 [DOI] [PMC free article] [PubMed] [Google Scholar]
- Desikan, R. S. , Ségonne, F. , Fischl, B. , Quinn, B. T. , Dickerson, B. C. , Blacker, D. , Buckner, R. L. , Dale, A. M. , Maguire, R. P. , Hyman, B. T. , Albert, M. S. , & Killiany, R. J. (2006). An automated labeling system for subdividing the human cerebral cortex on MRI scans into gyral based regions of interest. NeuroImage, 31(3), 968–980. 10.1016/j.neuroimage.2006.01.021 [DOI] [PubMed] [Google Scholar]
- Dima, D. , Modabbernia, A. , Papachristou, E. , Doucet, G. E. , Agartz, I. , Aghajani, M. , Akudjedu, T. N. , Albajes‐Eizagirre, A. , Alnaes, D. , Alpert, K. I. , Andersson, M. , Andreasen, N. C. , Andreassen, O. A. , Asherson, P. , Banaschewski, T. , Bargallo, N. , Baumeister, S. , Baur‐Streubel, R. , Bertolino, A. , … Frangou, S. (2022). Karolinska Schizophrenia Project (KaSP). Subcortical volumes across the lifespan: Data from 18,605 healthy individuals aged 3‐90 years. Human Brain Mapping, 43(1), 452–469. 10.1002/hbm.25320 [DOI] [PMC free article] [PubMed] [Google Scholar]
- Elliott, M. L. , Belsky, D. W. , Knodt, A. R. , Ireland, D. , Melzer, T. R. , Poulton, R. , Ramrakha, S. , Caspi, A. , Moffitt, T. E. , & Hariri, A. R. (2021). Brain‐age in midlife is associated with accelerated biological aging and cognitive decline in a longitudinal birth cohort. Molecular Psychiatry, 26(8), 3829–3838. 10.1038/s41380-019-0626-7 [DOI] [PMC free article] [PubMed] [Google Scholar]
- Fischl, B. , Salat, D. H. , Busa, E. , Albert, M. , Dieterich, M. , Haselgrove, C. , van der Kouwe, A. , Killiany, R. , Kennedy, D. , Klaveness, S. , Montillo, A. , Makris, N. , Rosen, B. , & Dale, A. M. (2002). Whole brain segmentation: Automated labeling of neuroanatomical structures in the human brain. Neuron, 33(3), 341–355. 10.1016/s0896-6273(02)00569-x [DOI] [PubMed] [Google Scholar]
- Frangou, S. , Modabbernia, A. , Williams, S. C. R. , Papachristou, E. , Doucet, G. E. , Agartz, I. , Aghajani, M. , Akudjedu, T. N. , Albajes‐Eizagirre, A. , Alnaes, D. , Alpert, K. I. , Andersson, M. , Andreasen, N. C. , … Dima, D. (2022). Cortical thickness across the lifespan: Data from 17,075 healthy individuals aged 3‐90 years. Human Brain Mapping, 43(1), 431–451. 10.1002/hbm.25364 [DOI] [PMC free article] [PubMed] [Google Scholar]
- Franke, K. , & Gaser, C. (2019). Ten years of BrainAGE as a neuroimaging biomarker of brain aging: What insights have we gained? Frontiers in Neurology, 10, 789. 10.3389/fneur.2019.00789 [DOI] [PMC free article] [PubMed] [Google Scholar]
- Franke, K. , Gaser, C. , Manor, B. , & Novak, V. (2013). Advanced BrainAGE in older adults with type 2 diabetes mellitus. Frontiers in Aging Neuroscience, 5, 90. 10.3389/fnagi.2013.00090 [DOI] [PMC free article] [PubMed] [Google Scholar]
- Ge, R. , Liu, X. , Long, D. , Frangou, S. , & Vila‐Rodriguez, F. (2021). Sex effects on cortical morphological networks in healthy young adults. NeuroImage, 233, 117945. 10.1016/j.neuroimage.2021.117945 [DOI] [PubMed] [Google Scholar]
- Ge, R. , Yu, Y. , Qi, Y. X. , Fan, Y. V. , Chen, S. , Gao, C. , Haas, S. S. , New, F. , Boomsma, D. I. , Brodaty, H. , Brouwer, R. M. , Buckner, R. , Caseras, X. , Crivello, F. , Crone, E. A. , Erk, S. , Fisher, S. E. , Franke, D. B. , Glahn, D. C. , … Frangou, S. (2024). Normative modeling of brain morphometry across the lifespan using CentileBrain: Algorithm benchmarking and model optimization. Lancet Digit Health, 6, E211–E221. 10.1016/S2589-7500(23)00250-9 [DOI] [PMC free article] [PubMed] [Google Scholar]
- Goyal, M. S. , Blazey, T. M. , Su, Y. , Couture, L. E. , Durbin, T. J. , Bateman, R. J. , Benzinger, T. L. , Morris, J. C. , Raichle, M. E. , & Vlassenko, A. G. (2019). Persistent metabolic youth in the aging female brain. Proceedings of the National Academy of Sciences of the United States of America, 116(8), 3251–3255. 10.1073/pnas.1815917116 [DOI] [PMC free article] [PubMed] [Google Scholar]
- Grinsztajn, L. , Oyallon, E. , & Varoquaux, G. (2022). Why do tree‐based models still outperform deep learning on typical tabular data? In 36th conference on neural information processing systems (NeurIPS2022), track on datasets and benchmarks. NeurIPS. [Google Scholar]
- Han, L. K. M. , Dinga, R. , Hahn, T. , Ching, C. R. K. , Eyler, L. T. , Aftanas, L. , Aghajani, M. , Aleman, A. , Baune, B. T. , Berger, K. , Brak, I. , Filho, G. B. , Carballedo, A. , Connolly, C. G. , Couvy‐Duchesne, B. , Cullen, K. R. , Dannlowski, U. , Davey, C. G. , Dima, D. , … Schmaal, L. (2021). Brain aging in major depressive disorder: Results from the ENIGMA major depressive disorder working group. Molecular Psychiatry, 26(9), 5124–5139. 10.1038/s41380-020-0754-0 [DOI] [PMC free article] [PubMed] [Google Scholar]
- He, T. , Kong, R. , Holmes, A. J. , Nguyen, M. , Sabuncu, M. R. , Eickhoff, S. B. , Bzdok, D. , Feng, J. , & Yeo, B. T. T. (2020). Deep neural networks and kernel regression achieve comparable accuracies for functional connectivity prediction of behavior and demographics. NeuroImage, 206, 116276. 10.1016/j.neuroimage.2019.116276 [DOI] [PMC free article] [PubMed] [Google Scholar]
- Hogstrom, L. J. , Westlye, L. T. , Walhovd, K. B. , & Fjell, A. M. (2013). The structure of the cerebral cortex across adult life: Age‐related patterns of surface area, thickness, and gyrification. Cerebral Cortex, 23(11), 2521–2530. 10.1093/cercor/bhs231 [DOI] [PubMed] [Google Scholar]
- Jiang, R. , Woo, C. W. , Qi, S. , Wu, J. , & Sui, J. (2022). Interpreting brain biomarkers: Challenges and solutions in interpreting machine learning‐based predictive neuroimaging. IEEE Signal Processing Magazine, 39(4), 107–118. 10.1109/MSP.2022.3155951 [DOI] [PMC free article] [PubMed] [Google Scholar]
- Kim, W. , Heo, D. , Maeng, J. , Shen, J. , Tsogt, U. , Odkhuu, S. , Zhang, X. , Cheraghi, S. , Kim, S. , Ham, B. , Rami, F. Z. , Sui, J. , Kang, C. Y. , Suk, H. , & Chung, Y. (2023). Deep learning‐based brain age prediction in patients with schizophrenia spectrum disorders. Schizophrenia Bulletin, 2023, sbad167. [DOI] [PMC free article] [PubMed] [Google Scholar]
- Liang, H. , Zhang, F. , & Niu, X. (2019). Investigating systematic bias in brain age estimation with application to post‐traumatic stress disorders. Human Brain Mapping, 40(11), 3143–3152. 10.1002/hbm.24588 [DOI] [PMC free article] [PubMed] [Google Scholar]
- Liu, S. , Seidlitz, J. , Blumenthal, J. D. , Clasen, L. S. , & Raznahan, A. (2020). Integrative structural, functional, and transcriptomic analyses of sex‐biased brain organization in humans. Proceedings of the National Academy of Sciences of the United States of America, 117(31), 18788–18798. 10.1073/pnas.1919091117 [DOI] [PMC free article] [PubMed] [Google Scholar]
- Lombardi, A. , Amoroso, N. , Diacono, D. , Monaco, A. , Tangaro, S. , & Bellotti, R. (2020). Extensive evaluation of morphological statistical harmonization for brain age prediction. Brain Sciences, 10(6), 364. 10.3390/brainsci10060364 [DOI] [PMC free article] [PubMed] [Google Scholar]
- Luna, A. , Bernanke, J. , Kim, K. , Aw, N. , Dworkin, J. D. , Cha, J. , & Posner, J. (2021). Maturity of gray matter structures and white matter connectomes, and their relationship with psychiatric symptoms in youth. Human Brain Mapping, 42(14), 4568–4579. 10.1002/hbm.25565 [DOI] [PMC free article] [PubMed] [Google Scholar]
- Lund, M. J. , Alnæs, D. , de Lange, A. G. , Andreassen, O. A. , Westlye, L. T. , & Kaufmann, T. (2022). Brain age prediction using fMRI network coupling in youths and associations with psychiatric symptoms. Neuroimage: Clinical, 33, 102921. [DOI] [PMC free article] [PubMed] [Google Scholar]
- Modabbernia, A. , Whalley, H. C. , Glahn, D. C. , Thompson, P. M. , Kahn, R. S. , & Frangou, S. (2022). Systematic evaluation of machine learning algorithms for neuroanatomically‐based age prediction in youth. Human Brain Mapping, 43(17), 5126–5140. 10.1002/hbm.26010 [DOI] [PMC free article] [PubMed] [Google Scholar]
- More, S. , Antonopoulos, G. , Hoffstaedter, F. , Caspers, J. , Eickhoff, S. B. , & Patil, K. R. (2023). Alzheimer's Disease Neuroimaging Initiative. Brain‐age prediction: A systematic comparison of machine learning workflows. NeuroImage, 270, 119947. 10.1016/j.neuroimage.2023.119947 [DOI] [PubMed] [Google Scholar]
- Moyer, D. , Ver Steeg, G. , Tax, C. M. W. , & Thompson, P. M. (2020). Scanner invariant representations for diffusion MRI harmonization. Magnetic Resonance in Medicine, 84, 2174–2189. 10.1002/mrm.28243 [DOI] [PMC free article] [PubMed] [Google Scholar]
- Niu, X. , Zhang, F. , Kounios, J. , & Liang, H. (2020). Improved prediction of brain age using multimodal neuroimaging data. Human Brain Mapping, 41(6), 1626–1643. 10.1002/hbm.24899 [DOI] [PMC free article] [PubMed] [Google Scholar]
- Pomponio, R. , Erus, G. , Habes, M. , Doshi, J. , Srinivasan, D. , Mamourian, E. , Bashyam, V. , Nasrallah, I. M. , Satterthwaite, T. D. , Fan, Y. , Launer, L. J. , Masters, C. L. , Maruff, P. , Zhuo, C. , Völzke, H. , Johnson, S. C. , Fripp, J. , Koutsouleris, N. , Wolf, D. H. , … Davatzikos, C. (2020). Harmonization of large MRI datasets for the analysis of brain imaging patterns throughout the lifespan. NeuroImage, 208, 116450. 10.1016/j.neuroimage.2019.116450 [DOI] [PMC free article] [PubMed] [Google Scholar]
- Rokicki, J. , Wolfers, T. , Nordhøy, W. , Tesli, N. , Quintana, D. S. , Alnaes, D. , Richard, G. , de Lange, A. G. , Lund, M. J. , Norbom, L. , Agartz, I. , Melle, I. , Naerland, T. , Selbaek, G. , Persson, K. , Nordvik, J. E. , Schwarz, E. , Andreassen, O. A. , Kaufmann, T. , & Westlye, L. T. (2021). Multimodal imaging improves brain age prediction and reveals distinct abnormalities in patients with psychiatric and neurological disorders. Human Brain Mapping, 42(6), 1714–1726. 10.1002/hbm.25323 [DOI] [PMC free article] [PubMed] [Google Scholar]
- Schulz, M. A. , Yeo, B. T. T. , Vogelstein, J. T. , Mourao‐Miranada, J. , Kather, J. N. , Kording, K. , Richards, B. , & Bzdok, D. (2020). Different scaling of linear models and deep learning in UKBiobank brain images versus machine‐learning datasets. Nature Communications, 11(1), 4238. 10.1038/s41467-020-18037-z [DOI] [PMC free article] [PubMed] [Google Scholar]
- Schölkopf, B. , & Smola, A. J. (2002). Learning with kernels: Support vector machines, regularization, optimization, and beyond. MIT Press. [Google Scholar]
- Sone, D., Beheshti, I., Shinagawa, S., Niimura, H., Kobayashi, N., Kida, H., Shikimoto, R., Noda, Y., Nakajima, S., Bun, S., Mimura, M., & Shigeta, M. (2022). Neuroimaging‐derived brain age is associated with life satisfaction in cognitively unimpaired elderly: A community‐based study. Translational psychiatry, 12(1), 25. 10.1038/s41398-022-01793-5 [DOI] [PMC free article] [PubMed]
- Tanveer, M. , Ganaie, M. , Behashti, I. , Goel, T. , Ahmad, N. , Lai, K. , Huang, K. , Zhang, Y. , Del Ser, J. , & Lin, C. (2023). Deep learning for brain age estimation: A systematic review. Information Fusion, 96, 130–142. 10.1016/j.inffus.2023.03.007 [DOI] [Google Scholar]
- Valizadeh, S. A. , Hänggi, J. , Mérillat, S. , & Jäncke, L. (2017). Age prediction on the basis of brain anatomical measures. Human Brain Mapping, 38(2), 997–1008. 10.1002/hbm.23434 [DOI] [PMC free article] [PubMed] [Google Scholar]
- Wang, Y. , Chen, X. , & Yan, C. (2023). Comprehensive evaluation of harmonization on functional brain imaging for multisite data‐fusion. NeuroImage, 274, 120089. 10.1016/j.neuroimage.2023.120089 [DOI] [PubMed] [Google Scholar]
- Wood, D. A. , Kafiabadi, S. , Busaidi, A. , Guilhem, E. , Montvila, A. , Lynch, J. , Townend, M. , Agarwal, S. , Mazumder, A. , Barker, G. J. , Ourselin, S. , Cole, J. , & Booth, T. C. (2022). Accurate brain‐age models for routine clinical MRI examinations. NeuroImage, 249, 118871. 10.1016/j.neuroimage.2022.118871 [DOI] [PubMed] [Google Scholar]
- Zhou, Z. , Li, H. , Srinivasan, D. , Abdulkadir, A. , Nasrallah, I. M. , Wen, J. , Doshi, J. , Erus, G. , Mamourian, E. , Bryan, N. R. , Wolk, D. A. , Beason‐Held, L. , Resnick, S. M. , Satterthwaite, T. D. , Davatzikos, C. , Shou, H. , Fan, Y. , & ISTAGING Consortium . (2023). Multiscale functional connectivity patterns of the aging brain learned from harmonized rsfMRI data of the multi‐cohort iSTAGING study. NeuroImage, 269, 119911. 10.1016/j.neuroimage.2023.119911 [DOI] [PMC free article] [PubMed] [Google Scholar]
Associated Data
This section collects any data citations, data availability statements, or supplementary materials included in this article.
Supplementary Materials
Figure S1. Distribution of participants' chronological age.
Figure S2. Model performance by site handling approach in the discovery sample in females.
Figure S3. Model performance by site handling approach in the discovery sample in males.
Figure S4. Performance metrics derived from the application of the models pre‐trained on the discovery sample to the different age bins of the replication sample.
Figure S5. Scatterplots of the relationship between brain age and chronological age in different age bins.
Figure S6. Model performance as a function of sample size for the preferred model.
Table S1. Details of the discovery sample.
Table S2. Details of the replication and consistency samples.
Table S3. Females only. Mean and standard deviation (SD) of the mean absolute error (MAE) and of the correlation coefficient between the chronological age and brain‐age in the discovery sample (CORR); adjusted MAE and adjusted CORR were corrected for age‐bias.
Table S4. Males only. Mean and standard deviation (SD) of the mean absolute error (MAE) and of the correlation coefficient (CORR) between the chronological age and brain‐age in the discovery sample; adjusted MAE and adjusted CORR were corrected for age‐bias.
Table S5. Females only. Mean and standard deviation (SD) of the mean absolute error (MAE) and of the correlation coefficient (CORR) between the chronological age and brain‐age in the replication sample; adjusted MAE and adjusted CORR were corrected for age‐bias.
Table S6. Males only. Mean and standard deviation (SD) of the mean absolute error (MAE) and of the correlation coefficient (CORR) between the chronological age and brain‐age in the replication sample; adjusted MAE and adjusted CORR were corrected for age‐bias.
Table S7. Pre‐trained model performances in the independent longitudinal‐consistency sample with different age ranges of female participants. CORR, correlation coefficient between the chronological age and predicted brain age; MAE, mean absolute error.
Table S8. Pre‐trained model performances in the independent longitudinal‐consistency sample with different age ranges of male participants. CORR, correlation coefficient between the chronological age and predicted brain age; MAE, mean absolute error.
Data Availability Statement
The data that support the findings of this study are available on request from the corresponding author. The data are not publicly available due to privacy or ethical restrictions.