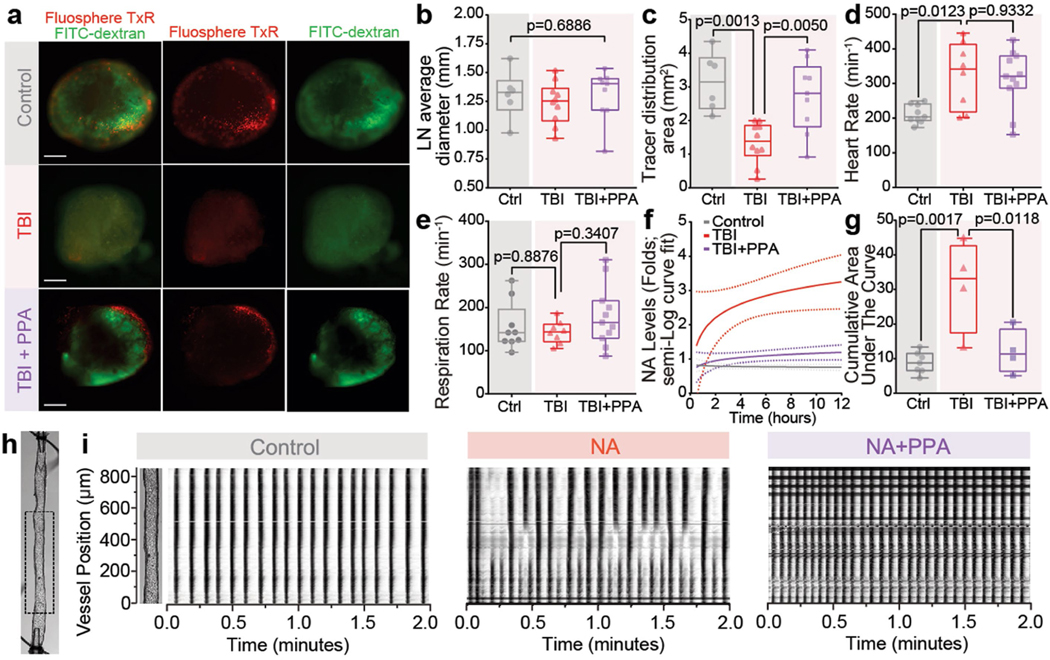
Extended Data Fig. 8 |. Comparison of size of cervical lymph nodes upon injury and PPA treatment. TBI alters cardiac but not respiratory rates in mice. Post traumatic linear increase in NA levels is counteracted by PPA treatment. NA treatment of CLVs ex vivo results in loss of entrainment while preemptive treatment with PPA nullifies the effect.
a, Mice, implanted with cisterna magna cannulas, were injected with a mixture of FITC dextran and fluorophore Tx Red, lymph nodes were isolated 40–60 min post-injury with or without PPA treatment, and the sizes of lymph nodes (LN) were measured in images acquired using a fluorescent dissecting microscope (MVX10, Olympus). b-c, LN diameter and tracer distribution area (n = 25 mice; Control (n = 6), TBI-saline (n = 10), TBI + PPA (n = 9), multiple cervical lymph nodes averaged per mouse) were compared using one-way ANOVA. b, Diameter; F2,22 = 0.3796, p = 0.6886. c, Tracer distribution area, F2,22 = 10.46, p = 0.0006, Tukey’s multiple comparison test, Control vs TBI-saline, p = 0.0013, TBI-saline vs TBI + PPA, p = 0.005). d-e, Respiratory and cardiac rates of anaesthetized mice (n = 28 mice; Control (n = 6), TBI-saline (n = 10), TBI + PPA (n = 9), one-way ANOVA followed by Tukey’s multiple comparison test). Recordings were obtained using a small animal physiological monitoring system (Harvard Apparatus). The recording duration was synchronized with the Thorlabs 2 P imager while performing lymphatic vessel imaging experiments. d, Heart rate (F2,25 = 6.2, p = 0.0065; Control vs TBI-saline, p = 0.0123, TBI-saline vs TBI + PPA, p = 0.933), e, respiratory rate (F2,25 = 1.101, p = 0.3482; Control vs TBI-saline, p = 0.8876; TBI-saline vs TBI + PPA, p = 0.3407). f, Semi-log curve fit of NA levels depicts a steady increase over time. g, Cumulative area under the curve of NA levels with or without injury and PPA treatment (n = 15 mice; Control (n = 7), TBI-saline (n = 4), TBI + PPA (n = 4), one-way ANOVA, F2,12 = 2.75, p = 0.0019, Tukey’s multiple comparison test; Control vs TBI-saline, p = 0.0017, TBI-saline vs TBI + PPA, p = 0.0118). h, Image of an isolated cervical lymphatic vessel with the area used for spatiotemporal map generation marked by a rectangular box. i, Spatiotemporal maps showing CLV contraction pattern in control, NA, and NA + PPA treatment. Continuous vertical bands correspond to single contraction waves that conduct over the entire length of the vessel. The intensity of each line is inversely proportional to the magnitude of the constriction. All contractions initiate at the top of the segment. Horizontal lines are diameter tracking artifacts due to small pieces of fat or connective tissue remaining on the outside of the vessel that rotated during contraction. Data shown as box and whisker plots with the lower and upper quartile (box limits), median and min-max values (b–e, g) and sigmoid line graph (f); the dots are biological replicates/mice (b–e, g). Scale: 500 μm.

