Abstract
Glycans are fundamental biological macromolecules, yet despite their prevalence and recognized importance, a number of unique challenges hinder routine characterization. The multiplicity of OH groups in glycan monomers easily afford branched structures and alternate linkage sites, which can result in isomeric structures that differ by minute details. Herein, radical chemistry is employed in conjunction with mass spectrometry to enable rapid, accurate, and high throughput identification of a challenging series of closely related glycan isomers. The results are compared with analysis by collision-induced dissociation, higher-energy collisional dissociation, and ultraviolet photodissociation (UVPD) at 213 nm. In general, collision-based activation struggles to produce characteristic fragmentation patterns, while UVPD and radical-directed dissociation (RDD) could distinguish all isomers. In the case of RDD, structural differentiation derives from radical mobility and subsequent fragmentation. For glycans, the energetic landscape for radical migration is flat, increasing the importance of three-dimensional structure. RDD is therefore a powerful and straightforward method for characterizing glycan isomers.
Introduction
Glycans are ubiquitous biomolecules that serve vital functions across the entire spectrum of life on Earth.1 Despite their simple origins, arising from carbon dioxide and water to form simple sugars via photosynthesis, assembled glycans can be exceptionally diverse and complex. Unlike DNA and proteins, which assemble in a consistent fashion into linear polymers formed from chemically distinct monomers, glycans can adopt branched structures with a diverse regio- and stereochemistry. For example, a standard hexose has five highly similar connectivity sites, each with isomeric linkage configurations.2 As a result of these extra dimensions of structural variability, glycan complexity scales far more rapidly than that of DNA or proteins.
Changes to any stage of glycan assembly can impact the assembled polymer properties. As an example, the most abundant organic compound on Earth, cellulose, is an inedible component of cell walls,3 while starch, which provides the bulk of human energy needs,4 differs only by the configuration of the glycosidic bonds linking their glucose monomers. Although cellulose and starch neatly demonstrate the importance of glycan polymorphism, these isolated carbohydrate repeats represent only a small subset of biologically relevant glycans.
Commonly, glycans are attached to cell surfaces or biomolecules to enable or modulate a certain function.5 Perhaps the most well-known example of this is the ABO blood group system, which originates from the glycan structure of antigens on the surface of red blood cells; these glycans govern an individual’s ability to receive a blood transfusion. Arguably, the ABO system was the first form of personalized medicine, predating the human genome project by a full century.6 Although these extra dimensions of structural variability enable remarkable diversity in chemical characteristics, this comes with the cost of complicating analysis. Consequently, advances in the field of glycomics, which comprises the study of isolated and conjugated glycan biomolecules, have not kept pace with the closely related fields of proteomics and genomics due to paucity of analytical tools capable of handling this extra complexity.1
Glycan structure is defined by the monomeric sugar building blocks in the same manner that DNA and proteins are dependent on nucleic acid and amino acid content, respectively. However, glycans can form branched structures with a more a complex regio- and stereochemistry. Figure 1 depicts a series of highly similar trisaccharide isomers that exhibit subtle variations in connectivity, configuration, and composition. Glycan analysis is often convoluted by the isomeric nature of the building blocks, which results in compositional isomers (i.e., isomers 1 and 2 as well as 4 and 5). Further complication arises because there are two possible configurations at each anomeric center, α and ß (see isomers 2 and 3 as well as 5 and 6). Finally, the monomers can be linked with a different regiochemistry for example by (1→3) or (1→4) glycosidic bonds (compare isomers 1–3 with 4–6). This collection of oligomers represents an extreme set of isomers and serves as a rigorous benchmark for evaluating new analytical methods.7,8
Figure 1.
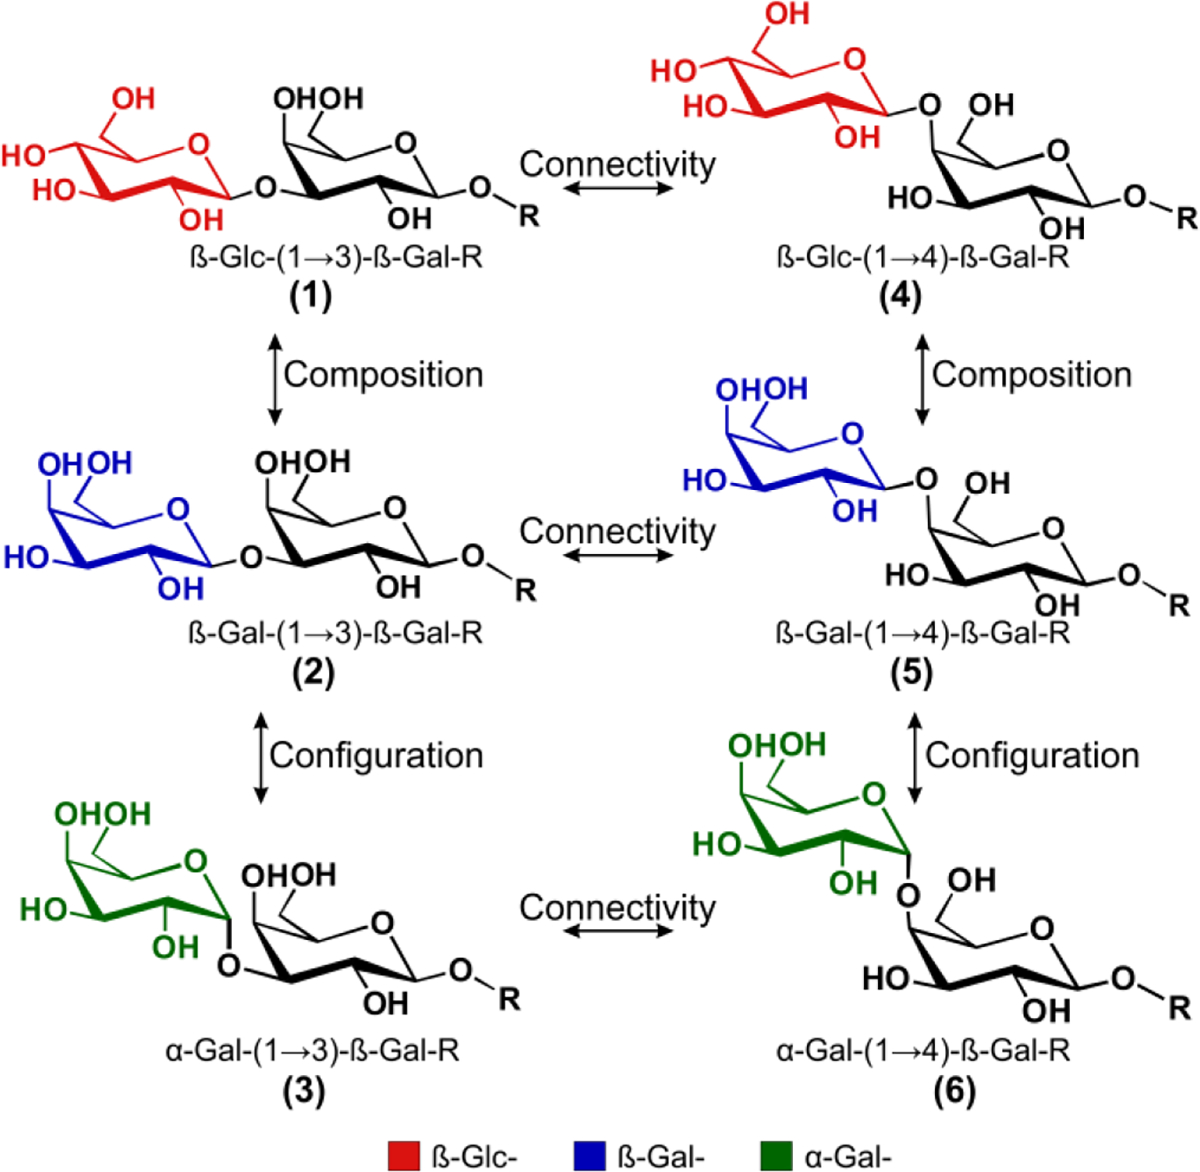
A succinct family of glycan isomers that differ in one or more of three structural aspects: connectivity, configuration, and composition. To simplify the structural comparisons, the R- group containing a ß-(1→4) glucose and C5H10-NH3 linker that remains consistent between the oligomers is not shown.
An ideal analytical technique should be able to differentiate all isomers shown in Figure 1 in a rapid, robust, and high-throughput manner. Although, nuclear magnetic resonance (NMR) has been successfully employed for glycan structural analysis, the characterization is often incomplete, relatively slow, and requires large amounts of purified material.9,10,11 Mass spectrometry (MS) offers advantages in speed and sensitivity, and tandem mass spectrometry-based fragmentation (MSn) excels at sequence determination in peptides.12 MS has also shown tremendous promise in glycan structural elucidation,13,14 but extending characterization beyond sequence information often requires odd-electron dissociation such as electron capture dissociation,15 electron transfer dissociation,16,17 electronic excitation dissociation,18 or electron detachment dissociation.19 Furthermore, glycans exhibit poor adsorption behavior on conventional reversed phase LC columns11 which limits the potential for meaningful separation. Recently, by utilizing porous graphitized carbon and nanoflow liquid chromatography, the Lebrilla group has achieved quantitative analysis of glycopeptides, including several isomers.2 Alternatively, coupling ion mobility to mass spectrometry has been recognized as a powerful tool for differentiating isomers without the need for solution phase separation.20,-21,22,23
A variety of fragmentation-based methods have also proven valuable in the structural characterization of glycans. Ultraviolet photodissociation (UVPD) has been demonstrated to improve sequence coverage of linear24 and various branched glycans,25 in addition to identifying native glycan isomers from ovalbumin.26 Similarly, tunable infrared multiple photon dissociation (IRMPD) has been utilized to determine disaccharide linkage configuration,27 as well as de novo sequencing.28 Cold-ion infrared spectroscopy can be used for vibrational fingerprinting,29,30 which can distinguish even the most similar compositional isomers, but the method also requires specialized equipment that is not widely available.7 Radical chemistry has also found utility in glycan characterization.31,32,33 The Beauchamp group reported excellent radical-based structural probing in conjunction with collisional activation, which also exhibited promising results for discrimination of several glycan isomers. These advances, and others, have positioned MS at the center of glycan profiling efforts even though complete characterization of all isomeric possibilities remains challenging.34
The present work seeks to explore the utility of novel fragmentation methods for discriminating highly similar trisaccharide glycan isomers. Radical directed dissociation (RDD), which generates a radical upon UV laser photodissociation inside a mass spectrometer,35 has been previously demonstrated to have excellent structural sensitivity.36,37 In RDD, a radical is generated in a site-specific manner, making subsequent radical migration via hydrogen abstraction highly sensitive to three-dimensional structure. RDD can readily distinguish all of the trisaccharide isomers in Figure 1. Comparisons are made between 213 nm UVPD, RDD, and traditional dissociation techniques, such as collision-induced dissociation (CID) and higher-energy collisional dissociation (HCD). Finally, the mechanistic and energetic basis for differences in fragmentation are elucidated.
Experimental Section
Synthesis of oligosaccharides 1–6 was performed using automated solid-phase glycan assembly.38 Briefly, different compositions are generated by the sequential assembly of building blocks. Each assembly step consists of a defined procedure involving coupling, washing and deprotection. The connectivity is controlled by the choice of protecting groups that exclusively enable the formation of a glycosidic bond at a specific position. Configurational selectivity is aided by participating protecting groups. After the synthetic route is completed, the crude molecules are cleaved from the resin, confirmed by MS- and NMR-analysis and additionally validated via HPLC. Before and after deprotection, the oligosaccharides were purified by preparative HPLC and again confirmed using the analytical techniques described above.
A simple nanoelectrospray source was built in-house to accommodate small volumes of glycan analytes. A ~10 cm length of silica (360 μm outer diameter x 100 μm inner diameter) is pulled to a ~5 μm emitter using a Sutter P-2000 laser tip puller. Empty emitters are loaded by applying vacuum to one end of the emitter while the opposite end is submerged in sample. The emitter is housed in a stainless-steel union and 1–2 kV is applied to the conductive union. A second capillary is joined in the union to provide a reservoir of solvent which prevent air from entering the emitter. Upon applying voltage, the sample electrosprays spontaneously (i.e., without a mechanical pump) at a rate of ~50 nL/min. Underivatized oligomers were electrosprayed from a solution of 50/50/1 methanol/water/acetic acid (v/v) and analyzed as [M+H]+ cations. Modified oligomers were analyzed as [M+Na]+ cations.
Oligomers were modified with para-iodobenzoate (4IB) via amide bond formation between the linker amine to the 4IB carboxylic acid, to provide a photocleavable C-I bond for radical directed dissociation. Succinimidyl-4IB was synthesized following previously established protocols.35 Oligomer modification was carried out in 1.5 mM borate buffer at pH 8.6 in a 37 °C incubator. Succinimidyl-4IB was added from a 2.5 mM stock at a molar ratio of ~25:1. The majority of the oligomer is found to be modified within one hour. The modified oligomers were diluted into 50/50/1 methanol/water/acetic acid (v/v) and electrosprayed without further work-up.
RDD was performed using a Thermo Fisher LTQ linear ion trap. The LTQ has been modified with a quartz window to allow fourth harmonic (266 nm) pulses from a Continuum Minilite II Nd:YAG laser to irradiate the trapped ion cloud. The modified analyte is isolated in an MS2 step and irradiated with a single pulse from the laser. The radical analyte generated via photodissociation is subsequently isolated in an MS3 step and activated via CID with a relative energy of 15. UVPD was performed on a Thermo Fisher Orbitrap Velos Pro. The orbitrap has been modified with a quartz window to allow photodissociation experiments on ions trapped in the HCD cell using a 213 nm laser from CryLas GmbH operating at 1 kHz. UVPD was performed with 100 laser pulses. Traditional CID and HCD was also performed on the Orbitrap with relative collision energies of 25 and 30 respectively. During CID and HCD operation, the laser is not in use.
Oligomers are distinguished using MSn fragmentation patterns. To quantitatively determine the differences between two spectra, values are calculated using Equation 1 where and refer to the ratios of two pairs of fragment ions that vary the most in relative abundance between different MSn spectra. Identical fragmentation patterns result in values of 1 thereby indicating no discrimination, while larger values reflect a higher degree of discrimination.
| (1) |
Bond dissociation energy calculations were performed using Gaussian 09 Rev. B.01.39 Structural optimizations and energy calculations were performed with hybrid density functional theory B3LYP at the 6–31G(d) basis set. All BDEs were calculated by the isodesmic reaction method using experimentally determined BDEs.40 Galactose was modelled as shown below, with a simple ether representing the glyosidic linkage.
Results and Discussion
We begin by examining the most common MS/MS method, CID. Collisional activation of protonated glycans 1-6 yields a limited number of fragments that are found in similar abundances, (Figure 2, left panel) in agreement with previous results.41,42 Disappointingly, the fragmentation patterns for all six oligomers are quite similar. The spectra are dominated by the loss of one and two galactose rings, observed at 428 and 266 m/z respectively. Fragmentation sites and the resulting fragment-ion m/z values for each isomer are shown on the right side of Figure 2. Less abundant water losses are also noted, but the origins of these fragments are ambiguous due to the high number of hydroxyl groups in any given saccharide. Higher-energy collisional dissociation (HCD) yields similar fragmentation pathways, with a preference for the loss of two rings (Figure 2, middle). Because glucose and galactose are isobaric, each resulting in 162 Dalton (Da) losses, the fragmentation patterns for 4 and 5 are indistinguishable. Similarly, comparisons between 5 and 6 indicate that the losses are insensitive to the anomeric configuration.
Figure 2.
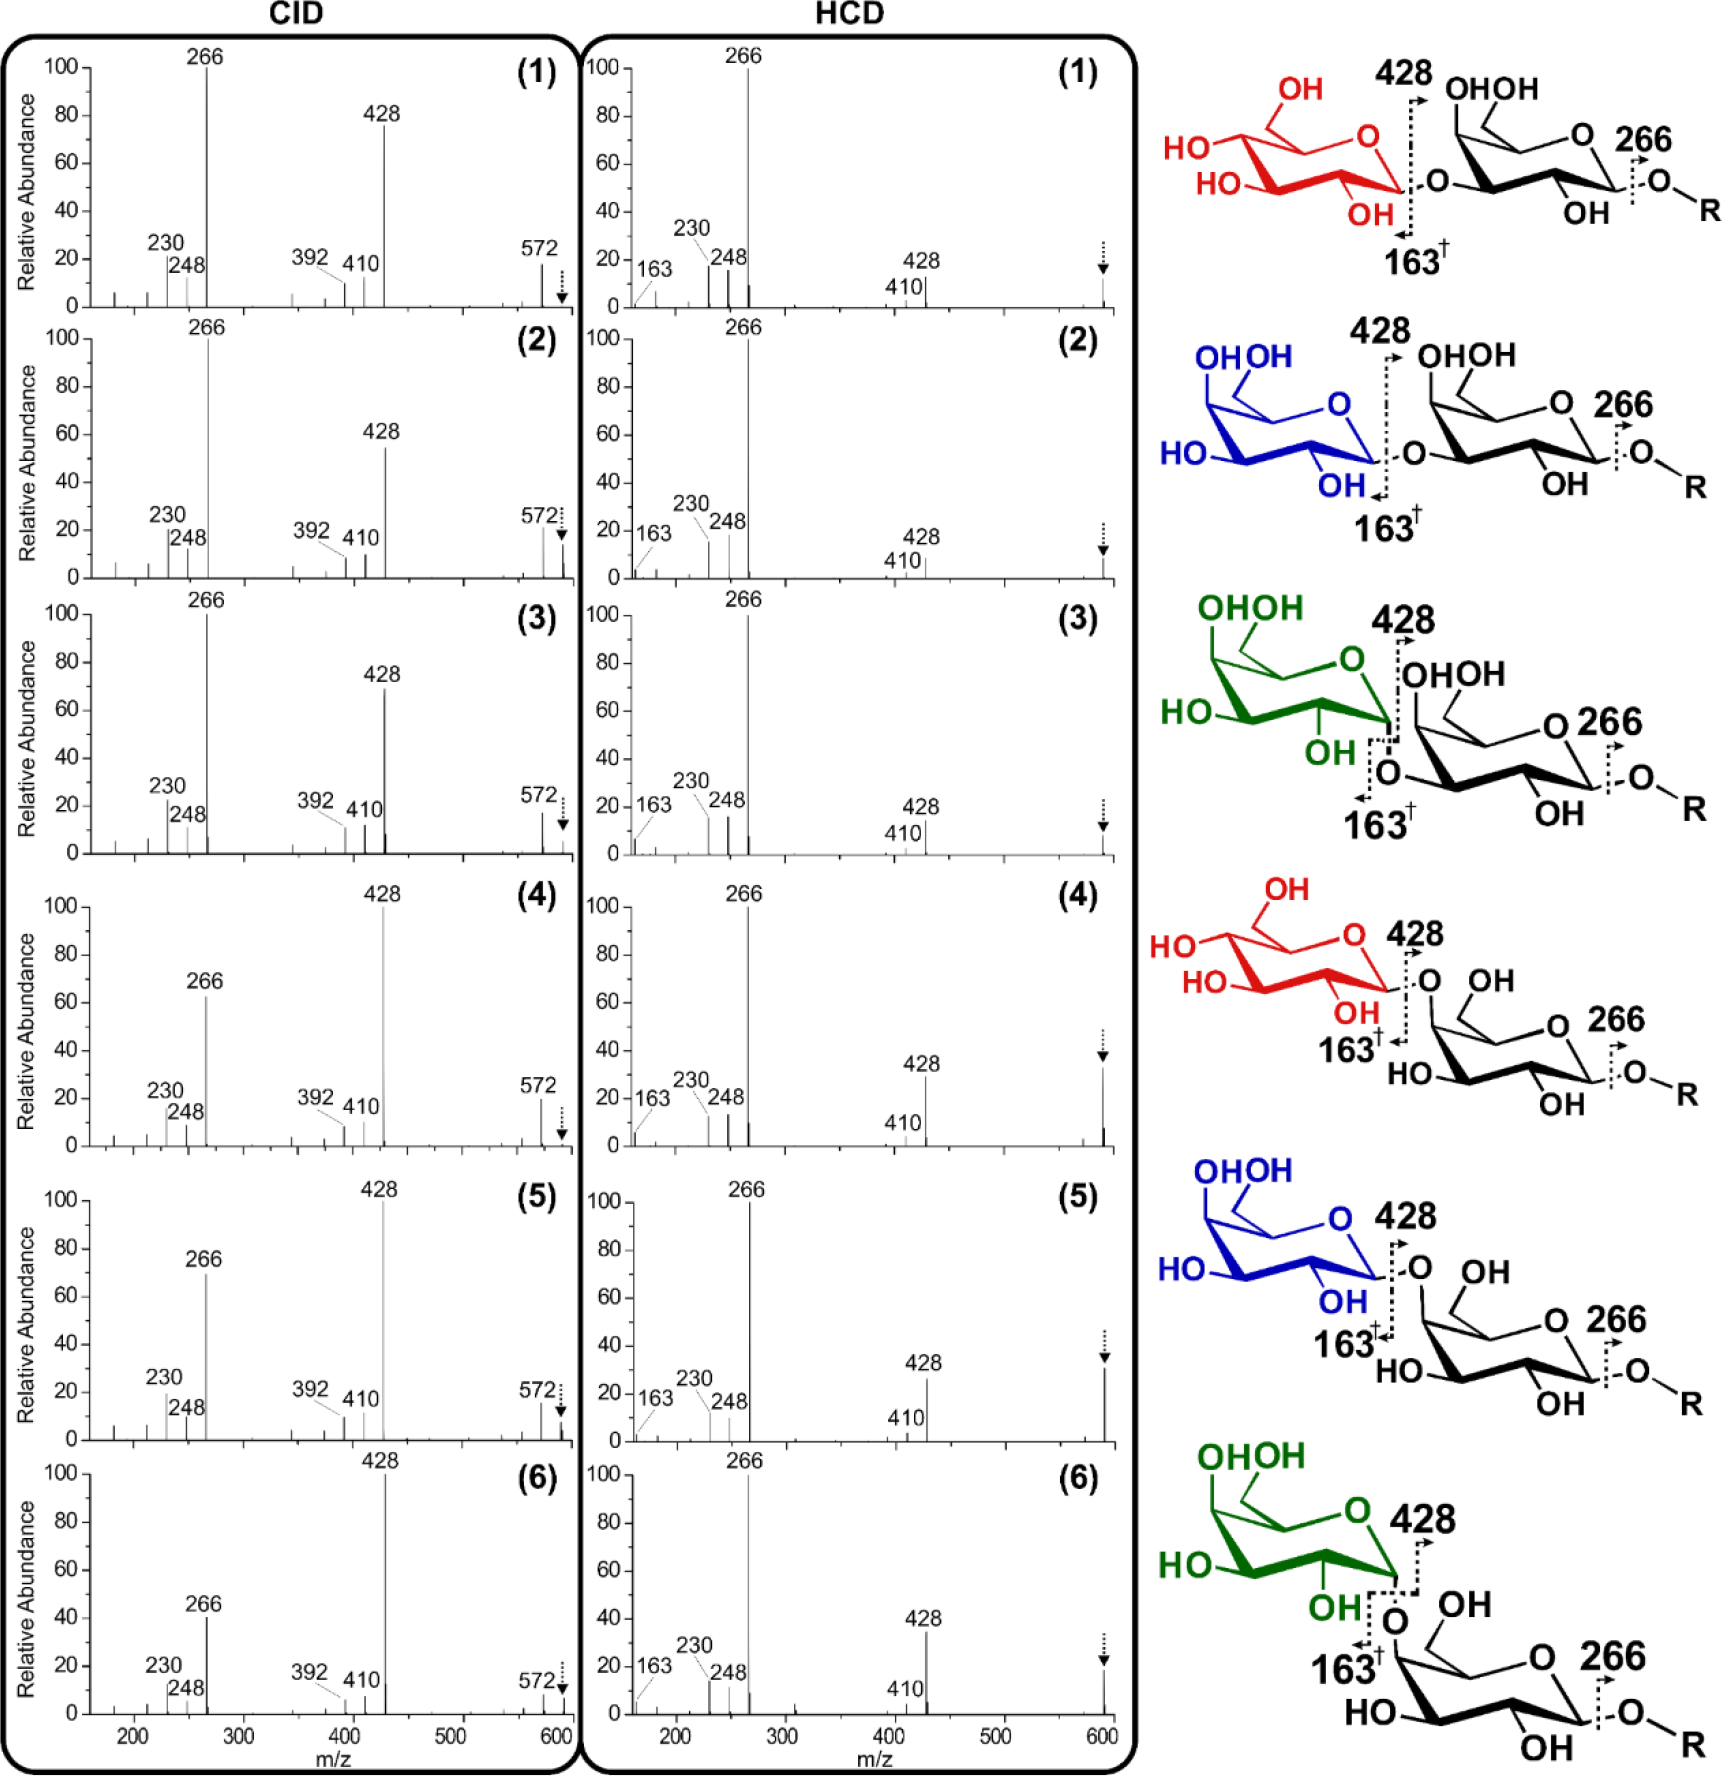
Collisional activation fragmentation spectra (CID and HCD) of isomers 1-6 and peak identifications for each oligomer. † indicates a fragment containing a double bond. The [M+H]+1 precursor observed at 590 m/z is indicated with an arrow.
Despite the similarity between spectra in Figure 2, there are subtle differences in the relative intensities for some fragments in both CID and HCD. For example, within the CID spectra, the ratio of 428 m/z to 266 m/z is inverted between 2 and 6. Changes such as this can be used to quantitate the difference between similar spectra. Commonly, the ratio of fragment intensities that change most between spectra are used to discriminate isomers using R-values.43 R-values reflect the degree of difference for the fragment ions that vary the most in intensity between a pair of independently collected fragmentation spectra (the equation is provided in the Experimental section). Higher R-values indicate greater differences between spectra. We have previously established the statistically significant R thresholds for CID fragmentation.36 Given these thresholds, some of the isomers in Figure 2 should be distinguishable by CID or HCD. For instance, comparing the 428 m/z and 266 m/z peaks for 2 and 6 yields a R-value of 4.5, which is well above the threshold of 1.9 for CID. Conversely, the largest difference between 2 and 3 results in an R-value of 1.6, which is insignificant (see the SI for a complete list of R-values). To simplify comparison between different fragmentation methods, we report the minimum R-value after cross-comparison of all isomers, which indicates whether all isomers can be distinguished, and the median value which reflects the magnitude of differences typically observed. The minimum R-value for CID is 1.6, and the median is 2.1. These values indicate minimal capability for distinguishing isomers with CID. Interestingly, HCD fares slightly better at discriminating the oligomers even though similar fragment ions are produced. Some of the difference is attributed to production of a protonated sugar monomer, observed at 163 m/z, which is not observed during CID. For HCD, the minimum R-value is 1.4, while the median is 3.1. Neither technique was able to discern all six isomers. Furthermore, quantitation in mixtures would likely not be possible with such low R-values.44
The scarcity of fragments and overall similarity between CID and HCD point to a fundamental limitation of collisional activation, which often relies on a mobile proton to facilitate fragmentation.45 The limited number of fragmentation sites observed for the oligomers suggest that the glycosidic bonds are susceptible to proton mediated fragmentation, while the remainder of the molecule is relatively inert. This may be due, in part, to the polycyclic nature of glycan oligomers, which requires a minimum of two cleavages to observe cross-ring fragmentation. In effect, the oligomers are resistant to double fragmentation by CID and HCD.
UVPD is an emerging dissociation technique46,47 that can access both vibrational and excited-state electronic dissociation.48 In order to utilize UVPD and radical dissociation, the oligomers were modified with para-iodobenzoate (4IB), which favors loss of iodine upon UV excitation.35 The 213 nm UVPD spectra for 4IB modified oligomers is presented in the left panel of Figure 3. UVPD was carried out with 100 shots of 213 nm light at ~1.5 μJ/pulse, resulting in ~50% photodissociation yield. Several differences between the oligomers are visually apparent, with the α- linked isomers, 3 and 6 yielding intense -I• peaks at 715 m/z while all other oligomers preferentially generate the 554 m/z fragment. Less abundant cross-ring cleavage fragments are also observed at 582 and 420 m/z for several isomers, along with the less favorable glycosidic bond cleavage products at 536 and 537 m/z. Importantly, the relative abundance of -I•, and radical directed fragmentation pathways varies greatly among the different isomers resulting in an R-value minimum of 5.9, and a median of 149.7. This represents a substantial improvement in isomer discrimination for every comparison relative to CID and HCD (see SI for complete score comparisons).
Figure 3.
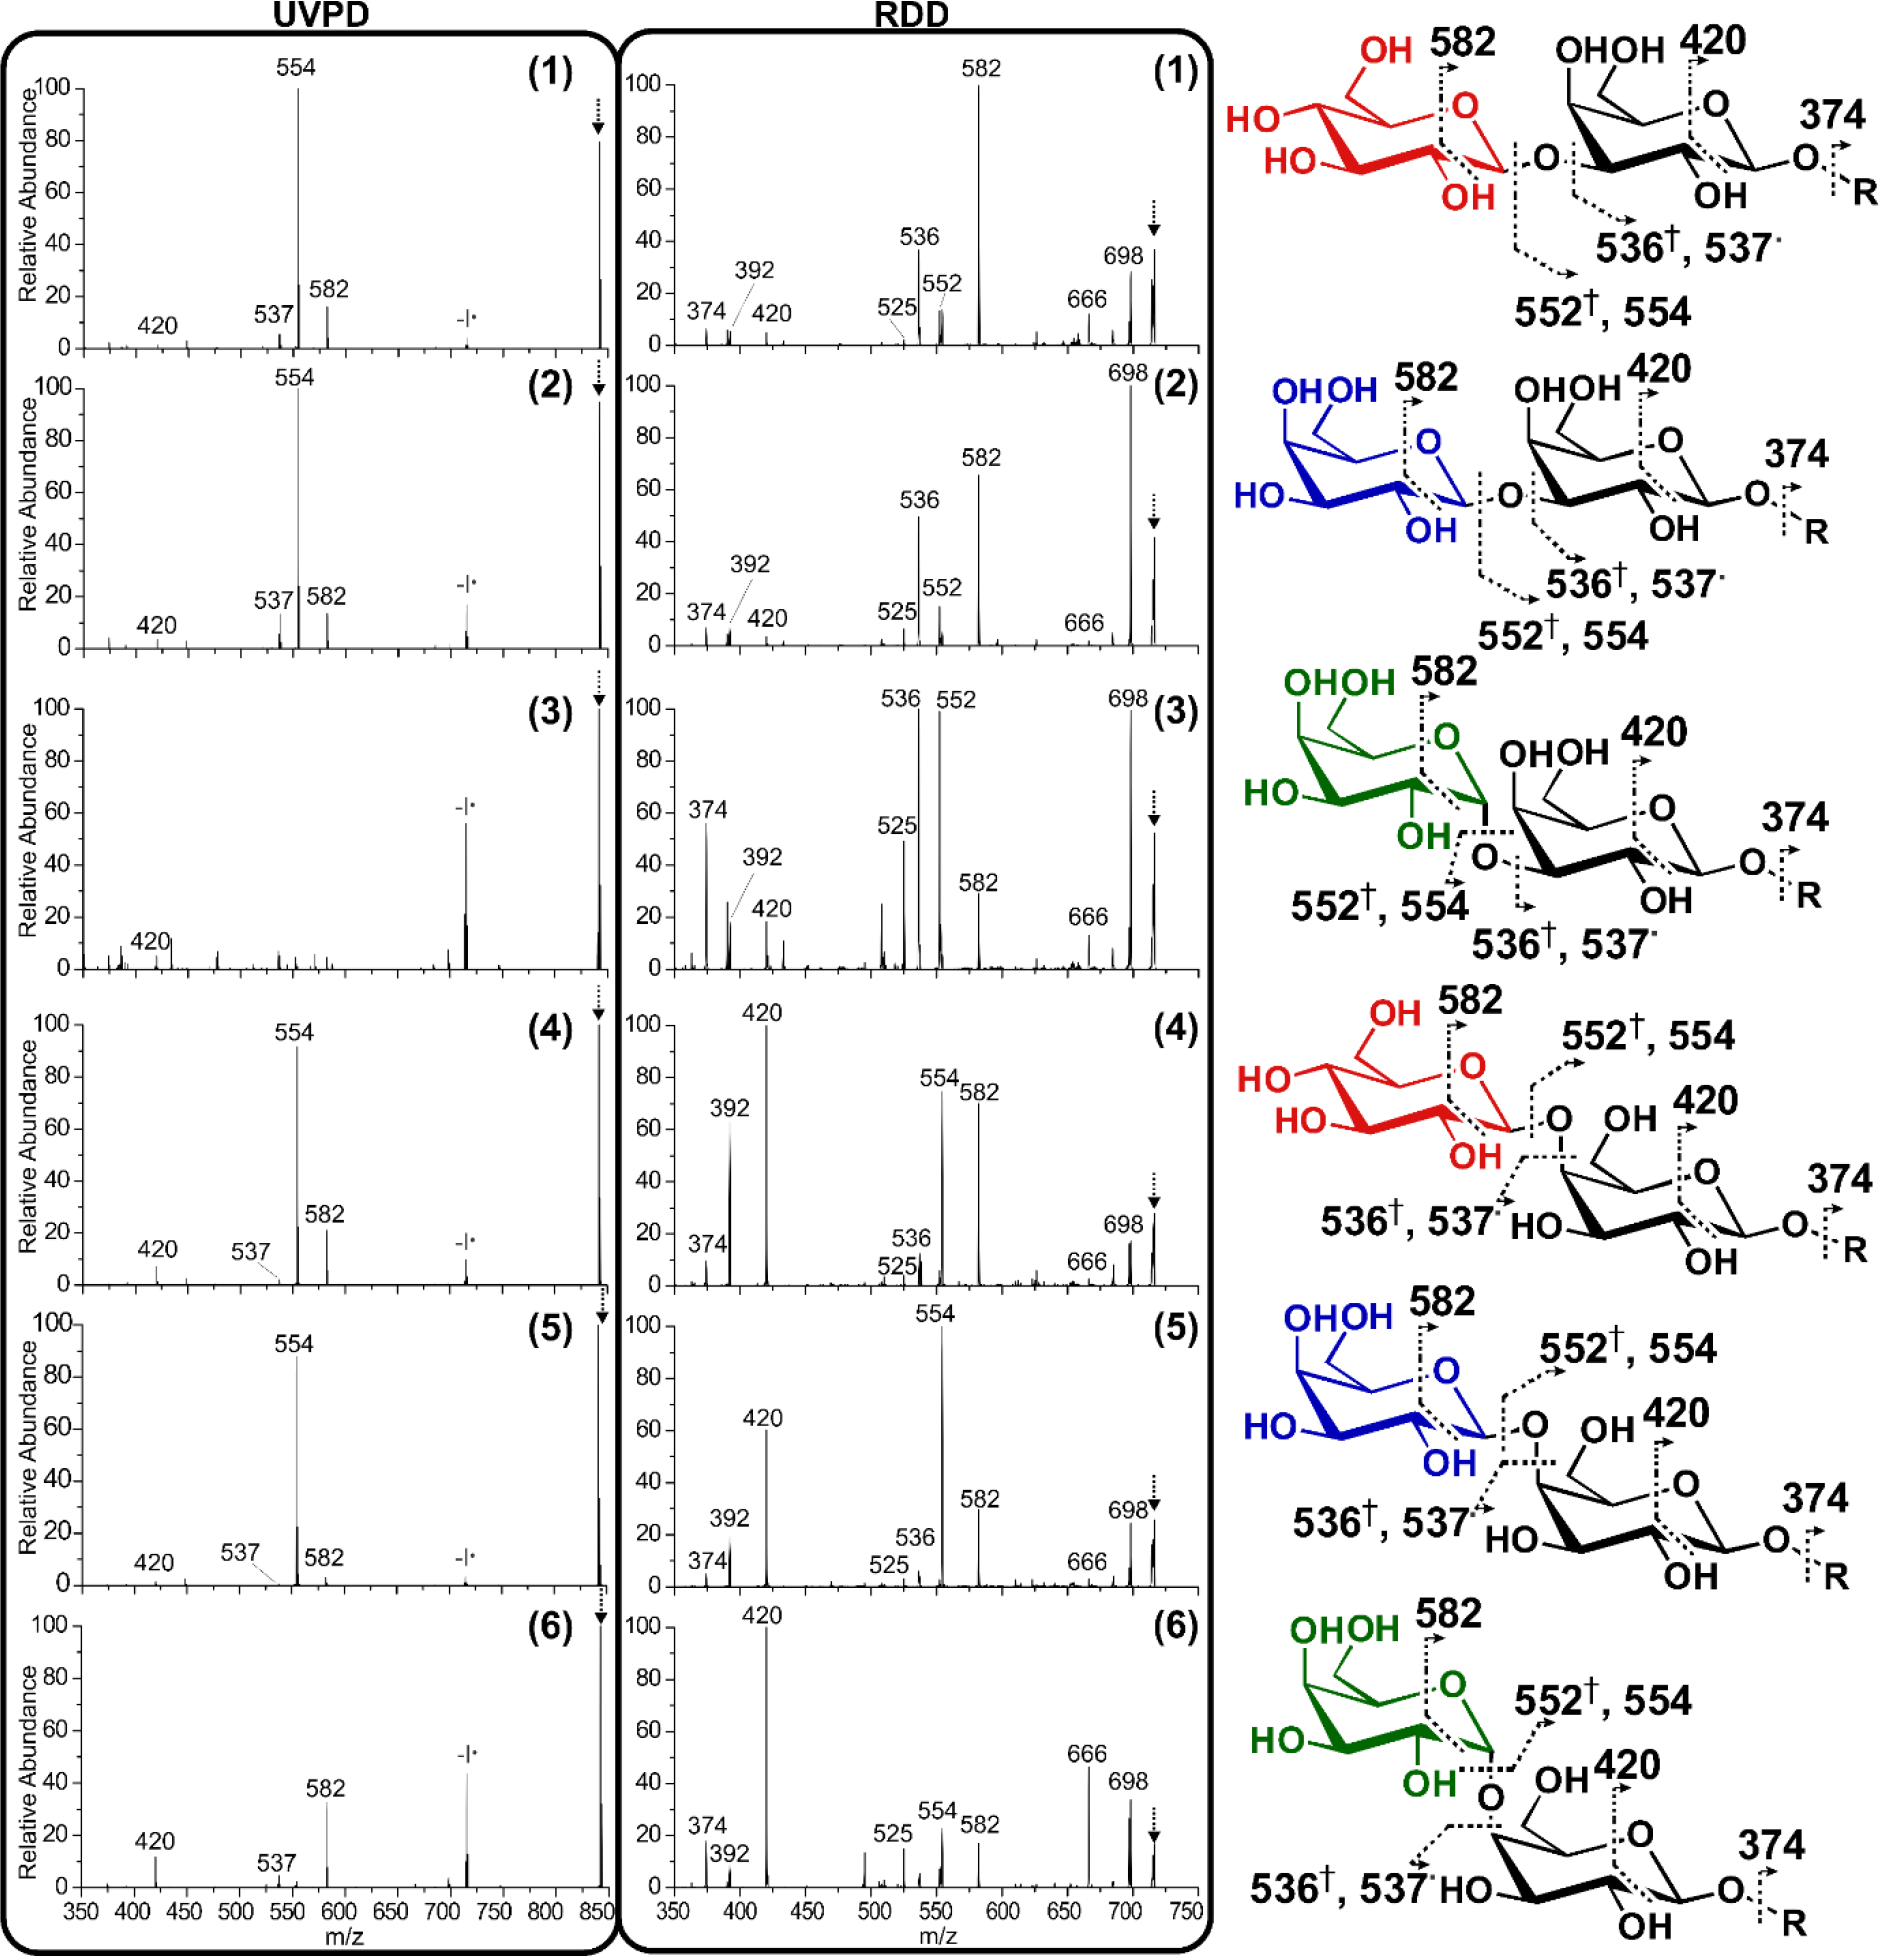
Radical fragmentation spectra afforded by UVPD and RDD. Peak identifications for each oligomer. The dot indicates radical products, the dagger indicates that the product forms a double bond. The [4IB M+Na]+1 precursor observed at 842 m/z during UVPD, and the -I• radical precursor observed at 715 m/z during RDD, is indicated with an arrow.
213 nm irradiation preferentially yields homolytic C-I bond cleavage (labeled -I•), but several oligomers undergo spontaneous subsequent fragmentation, indicating that the radical is formed close to the cleavage site, enabling facile migration. Radical migration occurs via hydrogen abstraction, and even subtle differences in the isomer structure lead to pronounced differences in the UVPD spectra. For instance, the abundance of the 554 m/z fragment, which arises from loss of one galactose ring and the glycosidic bond oxygen, is found to be very favorable for ß-, but not α-, glycosidic bonds (note the low abundance of 554 for α-oligomers 3 and 6. These data indicate that the linker configuration has a considerable impact on the radical mobility, which is governed by the three-dimensional structure and proximity of abstractable hydrogen atoms. Although additional cleavage products from either side of the glycosidic linkage are also present, the abundances are generally low.
Collisional activation of the radical generated by loss of iodine following UVPD yields an RDD spectrum. Even a cursory examination of the spectra afforded by RDD (Figure 3 middle panel) reveals striking differences in fragment intensities and obvious isomer discrimination. RDD yields far greater abundance and variety of radical-derived fragments relative to UVPD alone. Collisional activation gradually heats the radical ion, thereby enabling migration and exploration of the proximal structural features. Importantly, the relative abundances of fragment ions vary significantly between isomers, often by more than an order of magnitude. These remarkable differences enable unambiguous discrimination of each isomer. Importantly, RDD yields a minimum R-value of 10.9 and a median of 170.9. Again, these values represent significant improvements over collisional activation, and notable increases over UVPD.
Furthermore, all six isomers can be fully distinguished by examining just four RDD peaks, as shown in Figure 4. Many isomers exhibit quite distinct 552:554 peak ratios, with (1→4) linked oligomers preferentially forming the 554 Da fragment, while the (1→3) linkage provides a competitive pathway for generating the 552 Da fragment. Unsurprisingly, comparisons between the compositional isomers (1 vs. 2) and (4 vs. 5), which differ only by the orientation of a single hydroxyl group, are the most difficult to discern. However, isomers 1 and 2 are readily distinguished by the relative abundance of the 582 and 698 m/z fragments. When comparing 4 vs. 5, the nearby 582 ring cleavage fragment can be monitored to supplement the 552:554 ratio. Oligomer 4 is characterized by a 554:582 ratio of ~1, while oligomer 5 produces a ratio of 3.6. Together, these three fragments readily identify and discriminate each of the oligomers, and further hint at the mechanistic basis of isomeric discrimination. Proposed mechanisms for each of these diagnostic fragments are provided in the SI.
Figure 4.
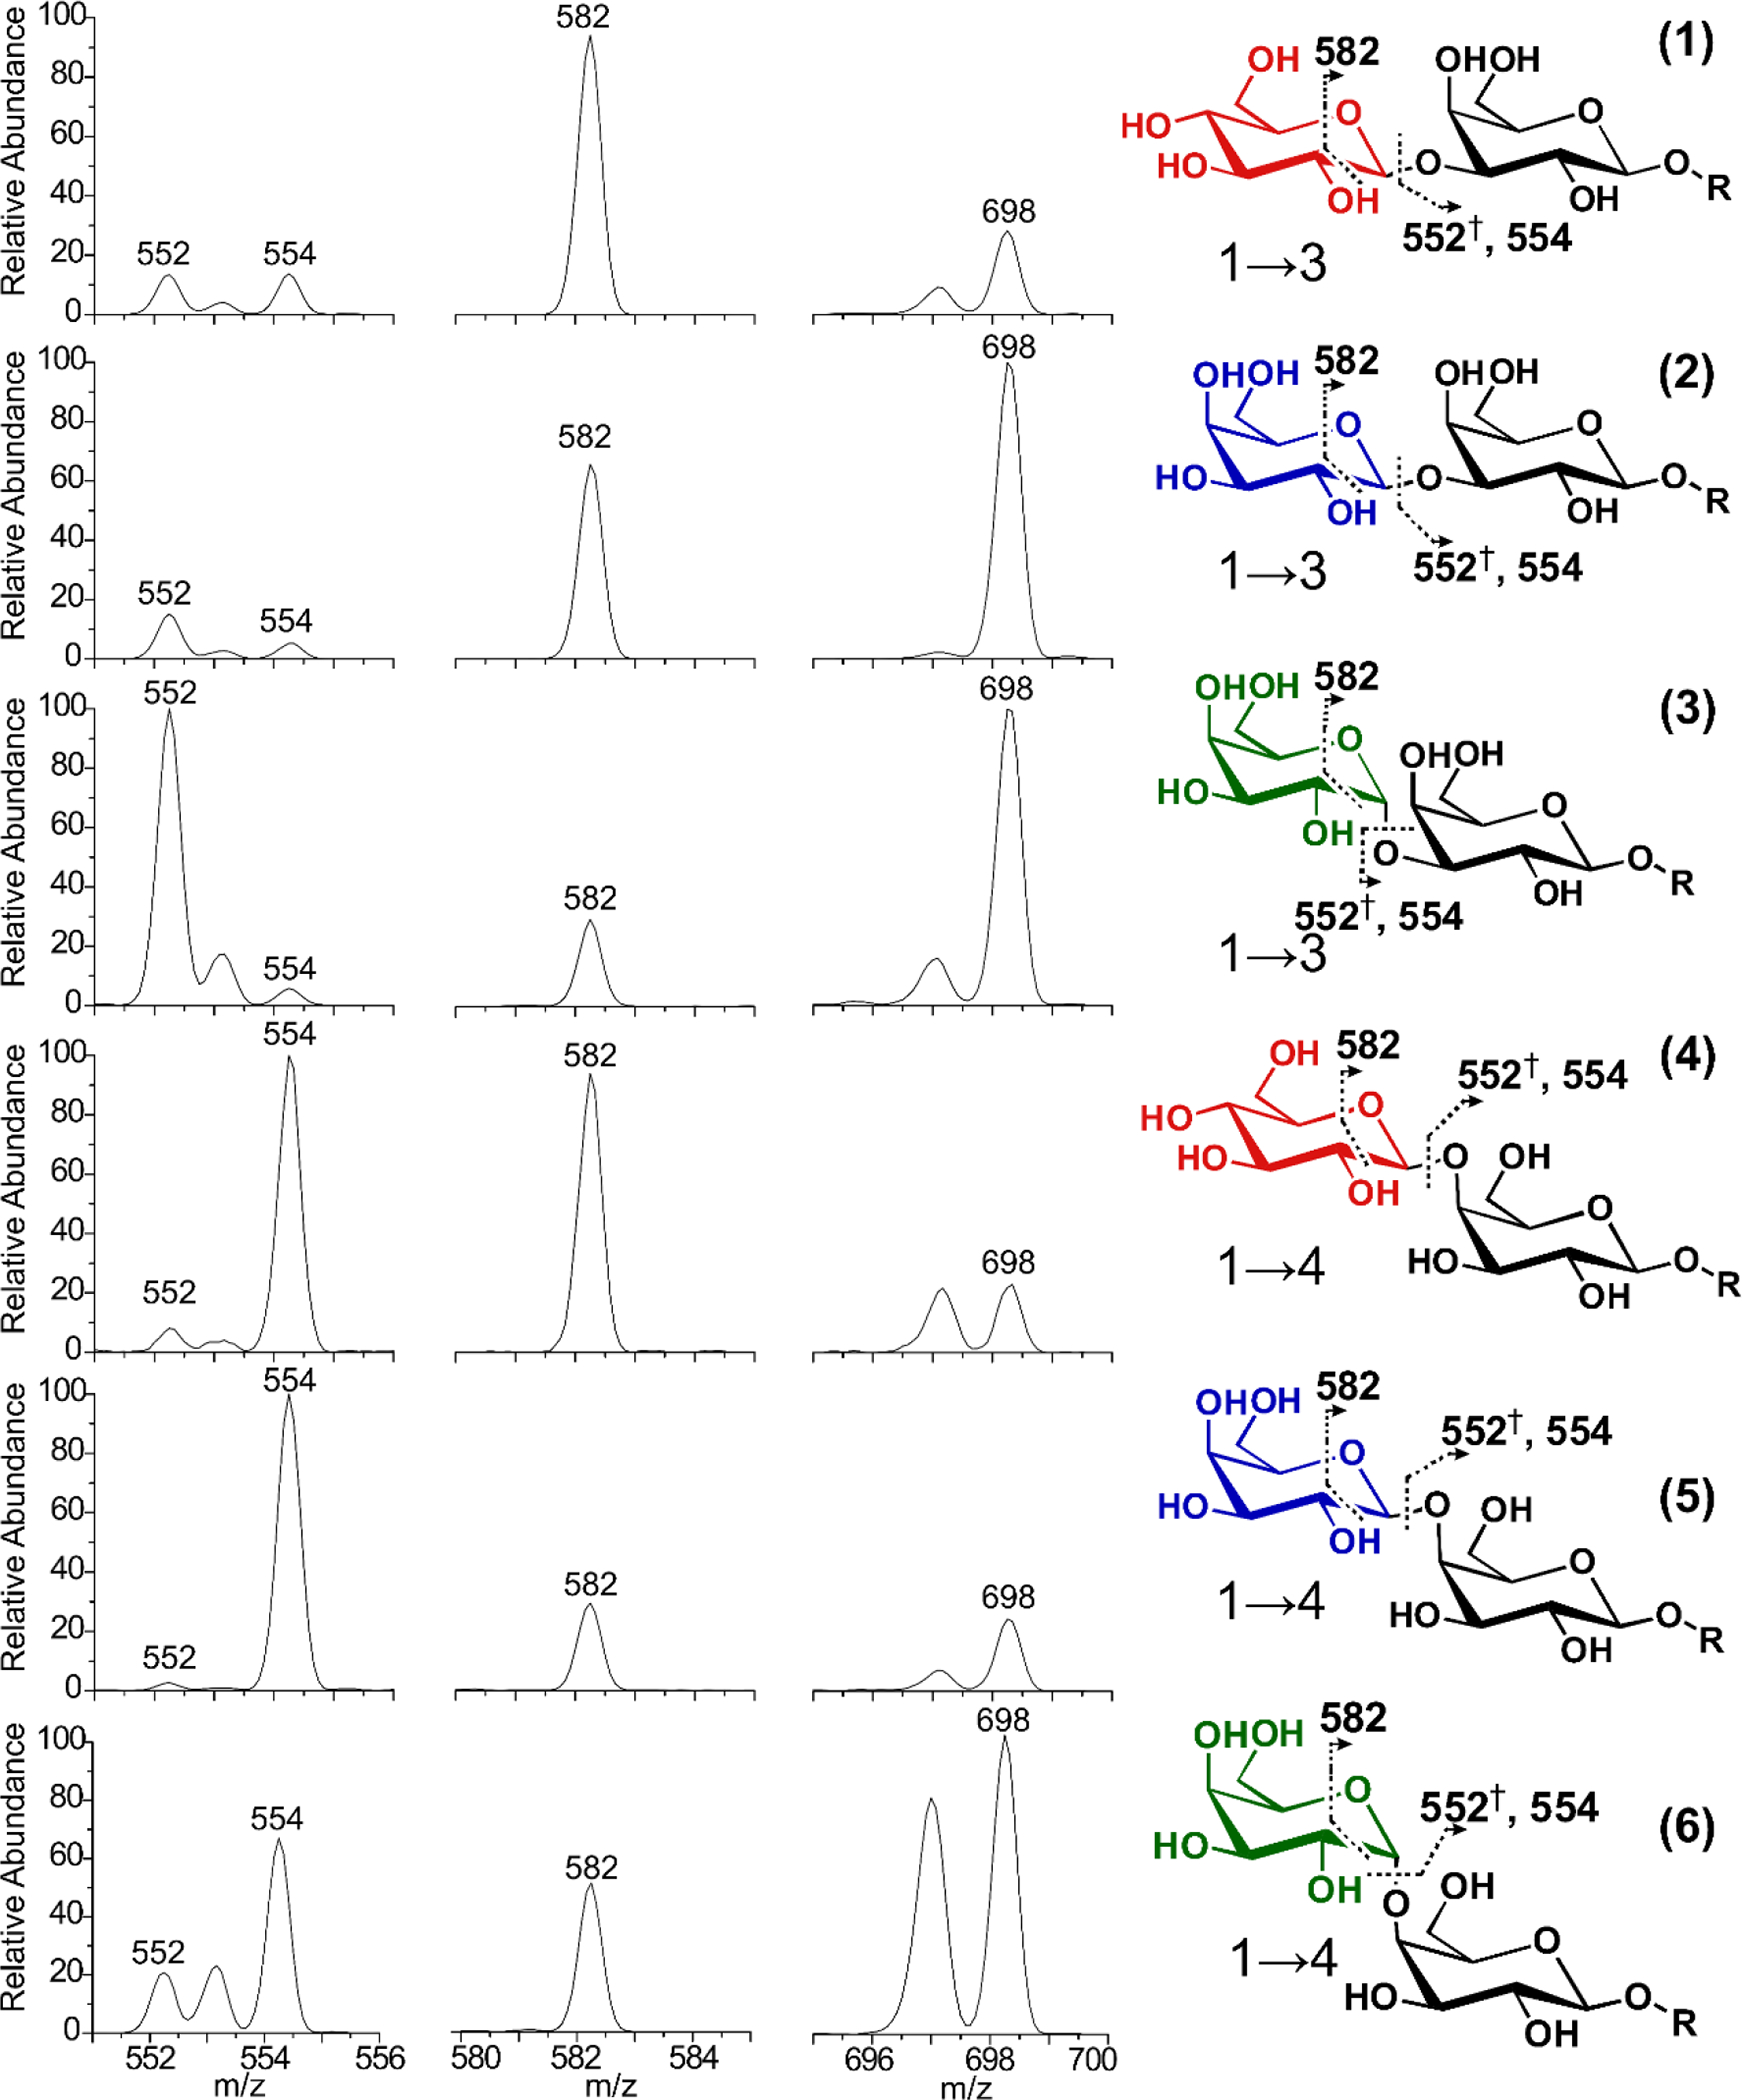
RDD fragmentation discriminates oligomers based on fragmentation abundances. The dagger indicates that the observed fragment contains a double bond.
Many of the R-values produced by UVPD and RDD represent some of the largest we have observed, and are far greater than typical values obtained for peptide isomers.44,45,49,50 Although initially perplexing, we posit that the relative chemical uniformity exhibited by glycans (relative to peptides) impacts hydrogen abstraction and therefore radical migration. Two of the most important parameters that govern hydrogen abstraction are bond dissociation energy and sterics. For migration to occur, the radical and hydrogen must be in close proximity, and the bond dissociation energy (BDE) must be sufficiently low. Distance and sterics are primarily functions of three-dimensional structure, while the BDE is influenced by local chemical environment (i.e., the functional group). In contrast to peptides, which are composed of diverse chemical side chains, glycans are made up of relatively few unique functional groups.
To explore potential radical migration pathways, we calculated the C–H BDEs for every abstractable hydrogen in galactose, and the results are shown in Figure 5. In short, isodesmic reactions were used with quantum mechanical calculations at the B3LYP/6–31G(d) level of theory, as described previously.51 In contrast to peptides, where BDEs vary from 319 kJ mol−1 to 527 kJ mol−1, the range for galactose is only 372 kJ/mol to 396 kJ mol−1. This indicates that with respect to hydrogen abstraction, the energetic landscape is relatively flat for glycans. Therefore, every C-H bond represents a competitive site for migration and offers an energetically favorable hydrogen for abstraction when accessible by the 4IB radical, which has a BDE of 474 kJ/mol.52 This effectively diminishes the energetic considerations for radical migration within glycans, thereby elevating the importance of three-dimensional structure.
Figure 5.
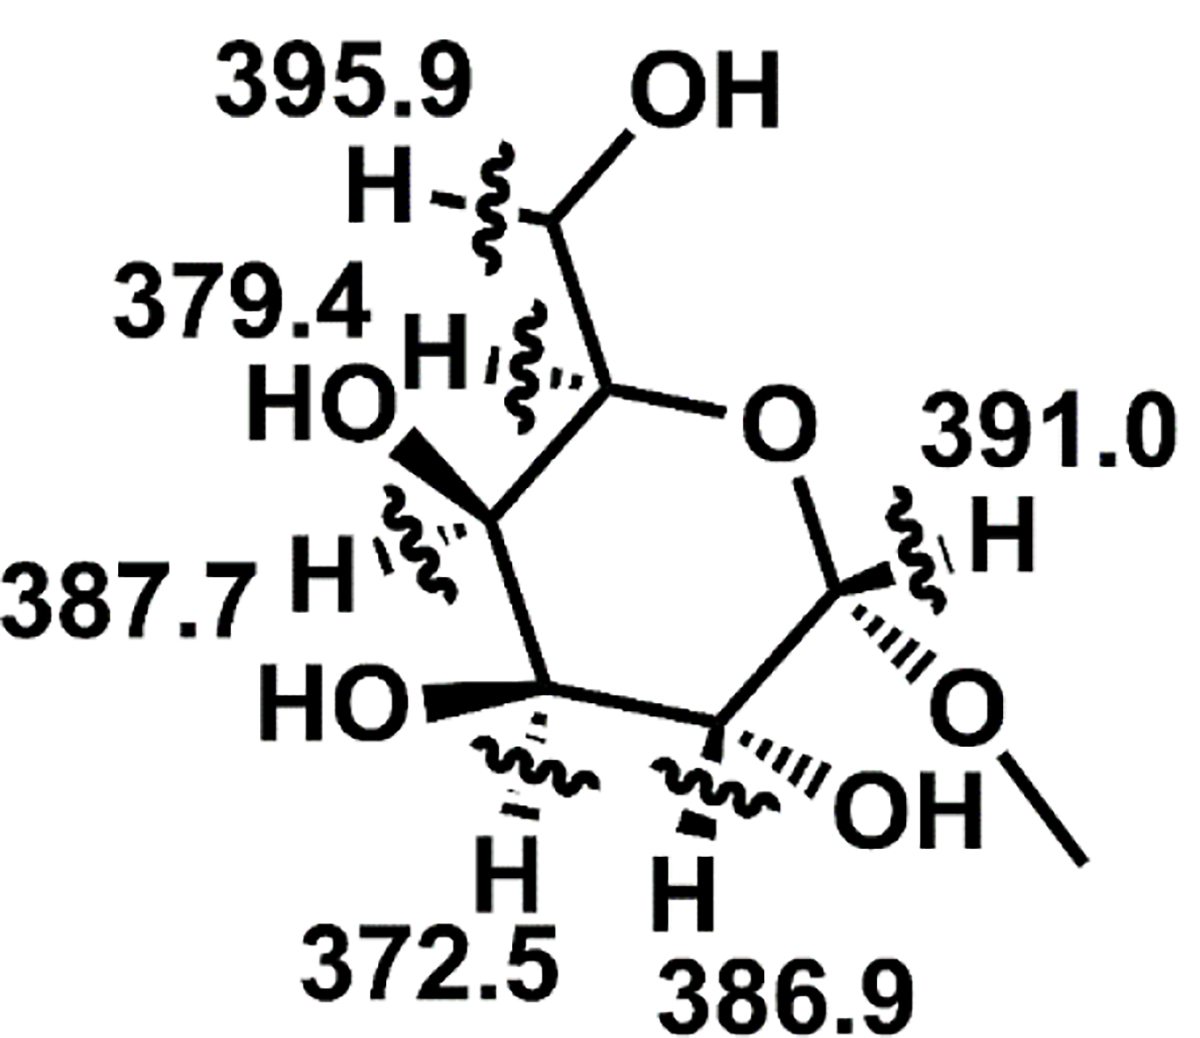
Bond dissociation energies for C-H bonds in galactose.
Collectively, these results demonstrate the remarkably utility of RDD in discriminating a full suite of isomeric oligomers. In contrast to traditional dissociation techniques, which exhibit a limited selection of favorable dissociation channels, radical migration proceeds to numerous sites, with hydrogen abstraction being dictated by oligomer structure. This structural sensitivity leads to unparalleled isomer discrimination while retaining the rapid and high throughput nature of mass spectrometry analysis. Importantly, the radical chemistry depicted can be carried out using 213 nm solid state lasers that are currently available on commercial mass spectrometers.
Conclusion
Both radical directed dissociation and UVPD exhibit excellent isomer discrimination for a complete family of glycan oligomers. The radical migration pathways and bond fragmentation tendencies reveal specific structural alterations that emerge as a function of glycan connectivity, configuration, and composition. Importantly, isomeric discrimination is accomplished via mass-spectrometry based fragmentation which is rapid, robust, and requires minimal amounts of sample. This work directly addresses the long-term roadmap goal of glycan structural determination established by the National Academy of Sciences1 by providing a high-throughput methodology that is accessible to non-experts and can be implemented in a wide variety of labs. Furthermore, demonstrating that this established proteomic approach is amenable to glycomics, and can be implemented on commercially available instruments, may ease the union of these two closely related but often isolated fields.
Supplementary Material
Acknowledgements
The authors are grateful for funding from the NIH (NIGMS grant R01GM107099 to RRJ). JH, HSH, PHS and KP thank the Max Planck Society and the Freie Universität Berlin for financial support.
Footnotes
Supporting Information
Proposed radical fragmentation mechanisms and a complete table of R-values obtained for each isomer are available as supporting information.
References
- 1.National Research Council. Transforming Glycoscience: A Roadmap for the Future. The National Academies Press, Washington, DC, 2012. [PubMed] [Google Scholar]
- 2.Hua S; Nwosu CC; Strum JS; Seipert RR; An HJ; Zivkovic AM; German JB; Lebrilla CB Anal. Bioanal. Chem. 2012, 403 (5), 1291–1302. [DOI] [PubMed] [Google Scholar]
- 3.Li R; Fei J; Cai Y; Li Y; Feng J; Yao J Carbohydr. Polym. 2009, 76 (1), 94–99. [Google Scholar]
- 4.Flatt JP Am. J. Clin. Nutr. 1995, 61 (4), 952S–959S. [DOI] [PubMed] [Google Scholar]
- 5.Service RF Science 2012, 338 (6105), 321–323. [DOI] [PubMed] [Google Scholar]
- 6.Schwarz HP; Dorner F Br. J. Haematol. 2003, 121 (4), 556–565. [DOI] [PubMed] [Google Scholar]
- 7.Mucha E, González Flórez AI, Marianski M, Thomas DA, Hoffmann W, Struwe WB, Hahm HS, Gewinner S, Schöllkopf W, Seeberger, Mucha E; González Flórez AI; Marianski M; Thomas DA; Hoffmann W; Struwe WB; Hahm HS; Gewinner S; Schöllkopf W; Seeberger PH; von Helden G, Pagel K. Angew. Chem. Int. Ed. 2017, 56 (37), 11248–11251. [DOI] [PubMed] [Google Scholar]
- 8.Hofmann J; Hahm HS; Seeberger PH; Pagel K Nature 2015, 526 (7572), 241–244. [DOI] [PubMed] [Google Scholar]
- 9.Duus JØ; Gotfredsen CH; Bock K Chem. Rev. 2000, 100 (12), 4589–4614. [DOI] [PubMed] [Google Scholar]
- 10.Pabst M; Altmann F Proteomics 2011, 11 (4), 631–643. [DOI] [PubMed] [Google Scholar]
- 11.Harvey DJ Proteomics 2001, 1 (2), 311–328. [DOI] [PubMed] [Google Scholar]
- 12.Han X; Aslanian A; Yates JR Curr. Opin. Chem. Biol. 2008, 12 (5), 483–490. [DOI] [PMC free article] [PubMed] [Google Scholar]
- 13.Hofmeister GE; Zhou Z; Leary JA J. Am. Chem. Soc. 1991, 113 (16), 5964–5970. [Google Scholar]
- 14.An HJ; Lebrilla CB Mass Spectrom. Rev. 2011, 30 (4), 560–578. [DOI] [PubMed] [Google Scholar]
- 15.Adamson JT; Håkansson K Anal. Chem. 2007, 79 (7), 2901–2910. [DOI] [PubMed] [Google Scholar]
- 16.Wolff JJ; Leach FE; Laremore TN; Kaplan DA; Easterling ML; Linhardt RJ; Amster IJ Anal. Chem. 2010, 82 (9), 3460–3466. [DOI] [PMC free article] [PubMed] [Google Scholar]
- 17.Han L; Costello CE J. Am. Soc. Mass Spectrom. 2011, 22 (6), 997–1013. [DOI] [PMC free article] [PubMed] [Google Scholar]
- 18.Yu X; Jiang Y; Chen Y; Huang Y; Costello CE; Lin C Anal. Chem. 2013, 85 (21), 10017–10021. [DOI] [PMC free article] [PubMed] [Google Scholar]
- 19.Wolff JJ; Amster IJ; Chi L; Linhardt RJ J. Am. Soc. Mass Spectrom. 2007, 18 (2), 234–244. [DOI] [PMC free article] [PubMed] [Google Scholar]
- 20.Mookherjee A; Guttman M Curr. Opin. Chem. Biol. 2018, 42, 86–92. [DOI] [PubMed] [Google Scholar]
- 21.Morrison KA; Clowers BH Curr. Opin. Chem. Biol. 2018, 42, 119–129. [DOI] [PubMed] [Google Scholar]
- 22.Chen Z; Glover MS; Li L Curr. Opin. Chem. Biol. 2018, 42, 1–8. [DOI] [PMC free article] [PubMed] [Google Scholar]
- 23.Hofmann J; Pagel K Angew. Chem. Int. Ed. 2017, 56 (29), 8342–8349. [DOI] [PubMed] [Google Scholar]
- 24.Devakumar A; Thompson MS; Reilly JP Rapid Commun. Mass Spectrom. 2005, 2313–2320. [DOI] [PubMed] [Google Scholar]
- 25.Devakumar A; Mechref Y; Kang P; Novotny MV; Reilly JP Rapid Commun. Mass Spectrom. 2007, 1452–1460. [DOI] [PubMed] [Google Scholar]
- 26.Devakumar A; Mechref Y; Kang P; Novotny MV; Reilly JP J. Am. Soc. Mass Spectrom. 2008, 19 (7), 1027–1040. [DOI] [PMC free article] [PubMed] [Google Scholar]
- 27.Polfer NC; Valle JJ; Moore DT; Oomens J; Eyler JR; Bendiak B Anal. Chem. 2006, 78 (3), 670–679. [DOI] [PubMed] [Google Scholar]
- 28.Schindler B; Barnes L; Renois G; Gray C; Chambert S; Fort S; Flitsch S; Loison C; Allouche AR; Compagnon I Nat. Commun. 2017, 8 (1). [DOI] [PMC free article] [PubMed] [Google Scholar]
- 29.Masellis C; Khanal N; Kamrath MZ; Clemmer DE; Rizzo TR J. Am. Soc. Mass Spectrom. 2017, 28 (10), 2217–2222. [DOI] [PMC free article] [PubMed] [Google Scholar]
- 30.Kamrath MZ; Rizzo TR Acc. Chem. Res. 2018, 51, 1487–1495. [DOI] [PubMed] [Google Scholar]
- 31.Gao J; Thomas DA; Sohn CH; Beauchamp JL J. Am. Chem. Soc. 2013, 135 (29), 10684–10692. [DOI] [PubMed] [Google Scholar]
- 32.Desai N; Thomas DA; Lee J; Gao J; Beauchamp JL Chem. Sci. 2016, 7 (8), 5390–5397. [DOI] [PMC free article] [PubMed] [Google Scholar]
- 33.Zhang X; Julian RR Int. J. Mass Spectrom. 2014, 372, 22–28. [Google Scholar]
- 34.Ruhaak LR; Xu G; Li Q; Goonatilleke E; Lebrilla CB Chem. Rev. 2018, 10.1021/acs.chemrev.7b00732. [DOI] [PMC free article] [PubMed] [Google Scholar]
- 35.Ly T; Zhang X; Sun Q; Moore B; Tao Y; Julian RR Chem. Commun. 2011, 47 (10), 2835. [DOI] [PubMed] [Google Scholar]
- 36.Tao Y; Quebbemann NR; Julian RR Anal. Chem. 2012, 84 (15), 6814–6820. [DOI] [PubMed] [Google Scholar]
- 37.Zhang X; Julian RR J. Am. Soc. Mass Spectrom. 2013, 24 (4), 524–533. [DOI] [PubMed] [Google Scholar]
- 38.Hahm HS; Schlegel MK; Hurevich M; Eller S; Schuhmacher F; Hofmann J; Pagel K; Seeberger PH Proc. Natl. Acad. Sci. 2017, 114 (17), E3385–E3389. [DOI] [PMC free article] [PubMed] [Google Scholar]
- 39.Gaussian 09, Revision B01, Frisch MJ, Trucks GW, Schlegel HB, Scuseria GE, Robb MA, Cheeseman JR, Scalmani G, Barone V, Petersson GA, Nakatsuji H, Li X, Caricato M, Marenich A, Bloino J, Janesko BG, Gomperts R, Mennucci B, Hratchian HP, Ortiz JV, Izmaylov AF, Sonnenberg JL, Williams-Young D, Ding F, Lipparini F, Egidi F, Goings J, Peng B, Petrone A, Henderson T, Ranasinghe D, Zakrzewski VG, Gao J, Rega N, Zheng G, Liang W, Hada M, Ehara M, Toyota K, Fukuda R, Hasegawa J, Ishida M, Nakajima T, Honda Y, Kitao O, Nakai H, Vreven T, Throssell K, Montgomery JA Jr., Peralta JE, Ogliaro F, Bearpark M, Heyd JJ, Brothers E, Kudin KN, Staroverov VN, Keith T, Kobayashi R, Normand J, Raghavachari K, Rendell A, Burant JC, Iyengar SS, Tomasi J, Cossi M, Millam JM, Klene M, Adamo C, Cammi R, Ochterski JW, Martin RL, Morokuma K, Farkas O, Foresman JB, and Fox DJ, Gaussian, Inc., Wallingford CT, 2016. [Google Scholar]
- 40.Blanksby SJ, and Ellison GB (2003) Bond dissociation energies of organic molecules. Acc. Chem. Res. 36, 255–263. [DOI] [PubMed] [Google Scholar]
- 41.Rauk a; Yu D; Taylor J; Shustov GV; Block DA; Armstrong DA. Biochemistry 1999, 38 (28), 9089–9096. [DOI] [PubMed] [Google Scholar]
- 42.Leymarie N; Zaia J Anal. Chem. 2012, 84 (7), 3040–3048. [DOI] [PMC free article] [PubMed] [Google Scholar]
- 43.Tao WA; Zhang D; Nikolaev EN; Cooks RG J. Am. Chem. Soc. 2000, 122 (43), 10598–10609. [Google Scholar]
- 44.Riggs DL; Gomez SV; Julian RR ACS Chem. Biol. 2017, 12 (11), 2875–2882. [DOI] [PMC free article] [PubMed] [Google Scholar]
- 45.Wysocki VH; Tsaprailis G; Smith LL; Breci LA J. Mass Spectrom. 2000, 35 (12), 1399–1406. [DOI] [PubMed] [Google Scholar]
- 46.Brodbelt JS Chem. Soc. Rev. 2014, 43 (8), 2757. [DOI] [PMC free article] [PubMed] [Google Scholar]
- 47.Halim MA; Girod M; MacAleese L; Lemoine J; Antoine R; Dugourd PJ Am. Soc. Mass Spectrom. 2016, 27 (3), 474–486. [DOI] [PubMed] [Google Scholar]
- 48.Julian R, Am RJ. Soc. Mass Spectrom. 2017, 28 (9), 1823–1826. [DOI] [PMC free article] [PubMed] [Google Scholar]
- 49.Lyon YA; Sabbah GM; Julian RR J. Proteome Res. 2017, 16 (4), 1797–1805. [DOI] [PMC free article] [PubMed] [Google Scholar]
- 50.Lyon YA; Sabbah GM; Julian RR Exp. Eye Res. 2018, 171 (January), 131–141. [DOI] [PMC free article] [PubMed] [Google Scholar]
- 51.Moore B; Sun Q; Hsu JC; Lee AH; Yoo GC; Ly T; Julian RR J. Am. Soc. Mass Spectrom. 2012, 23 (3), 460–468. [DOI] [PubMed] [Google Scholar]
Associated Data
This section collects any data citations, data availability statements, or supplementary materials included in this article.


