
Figure 6.
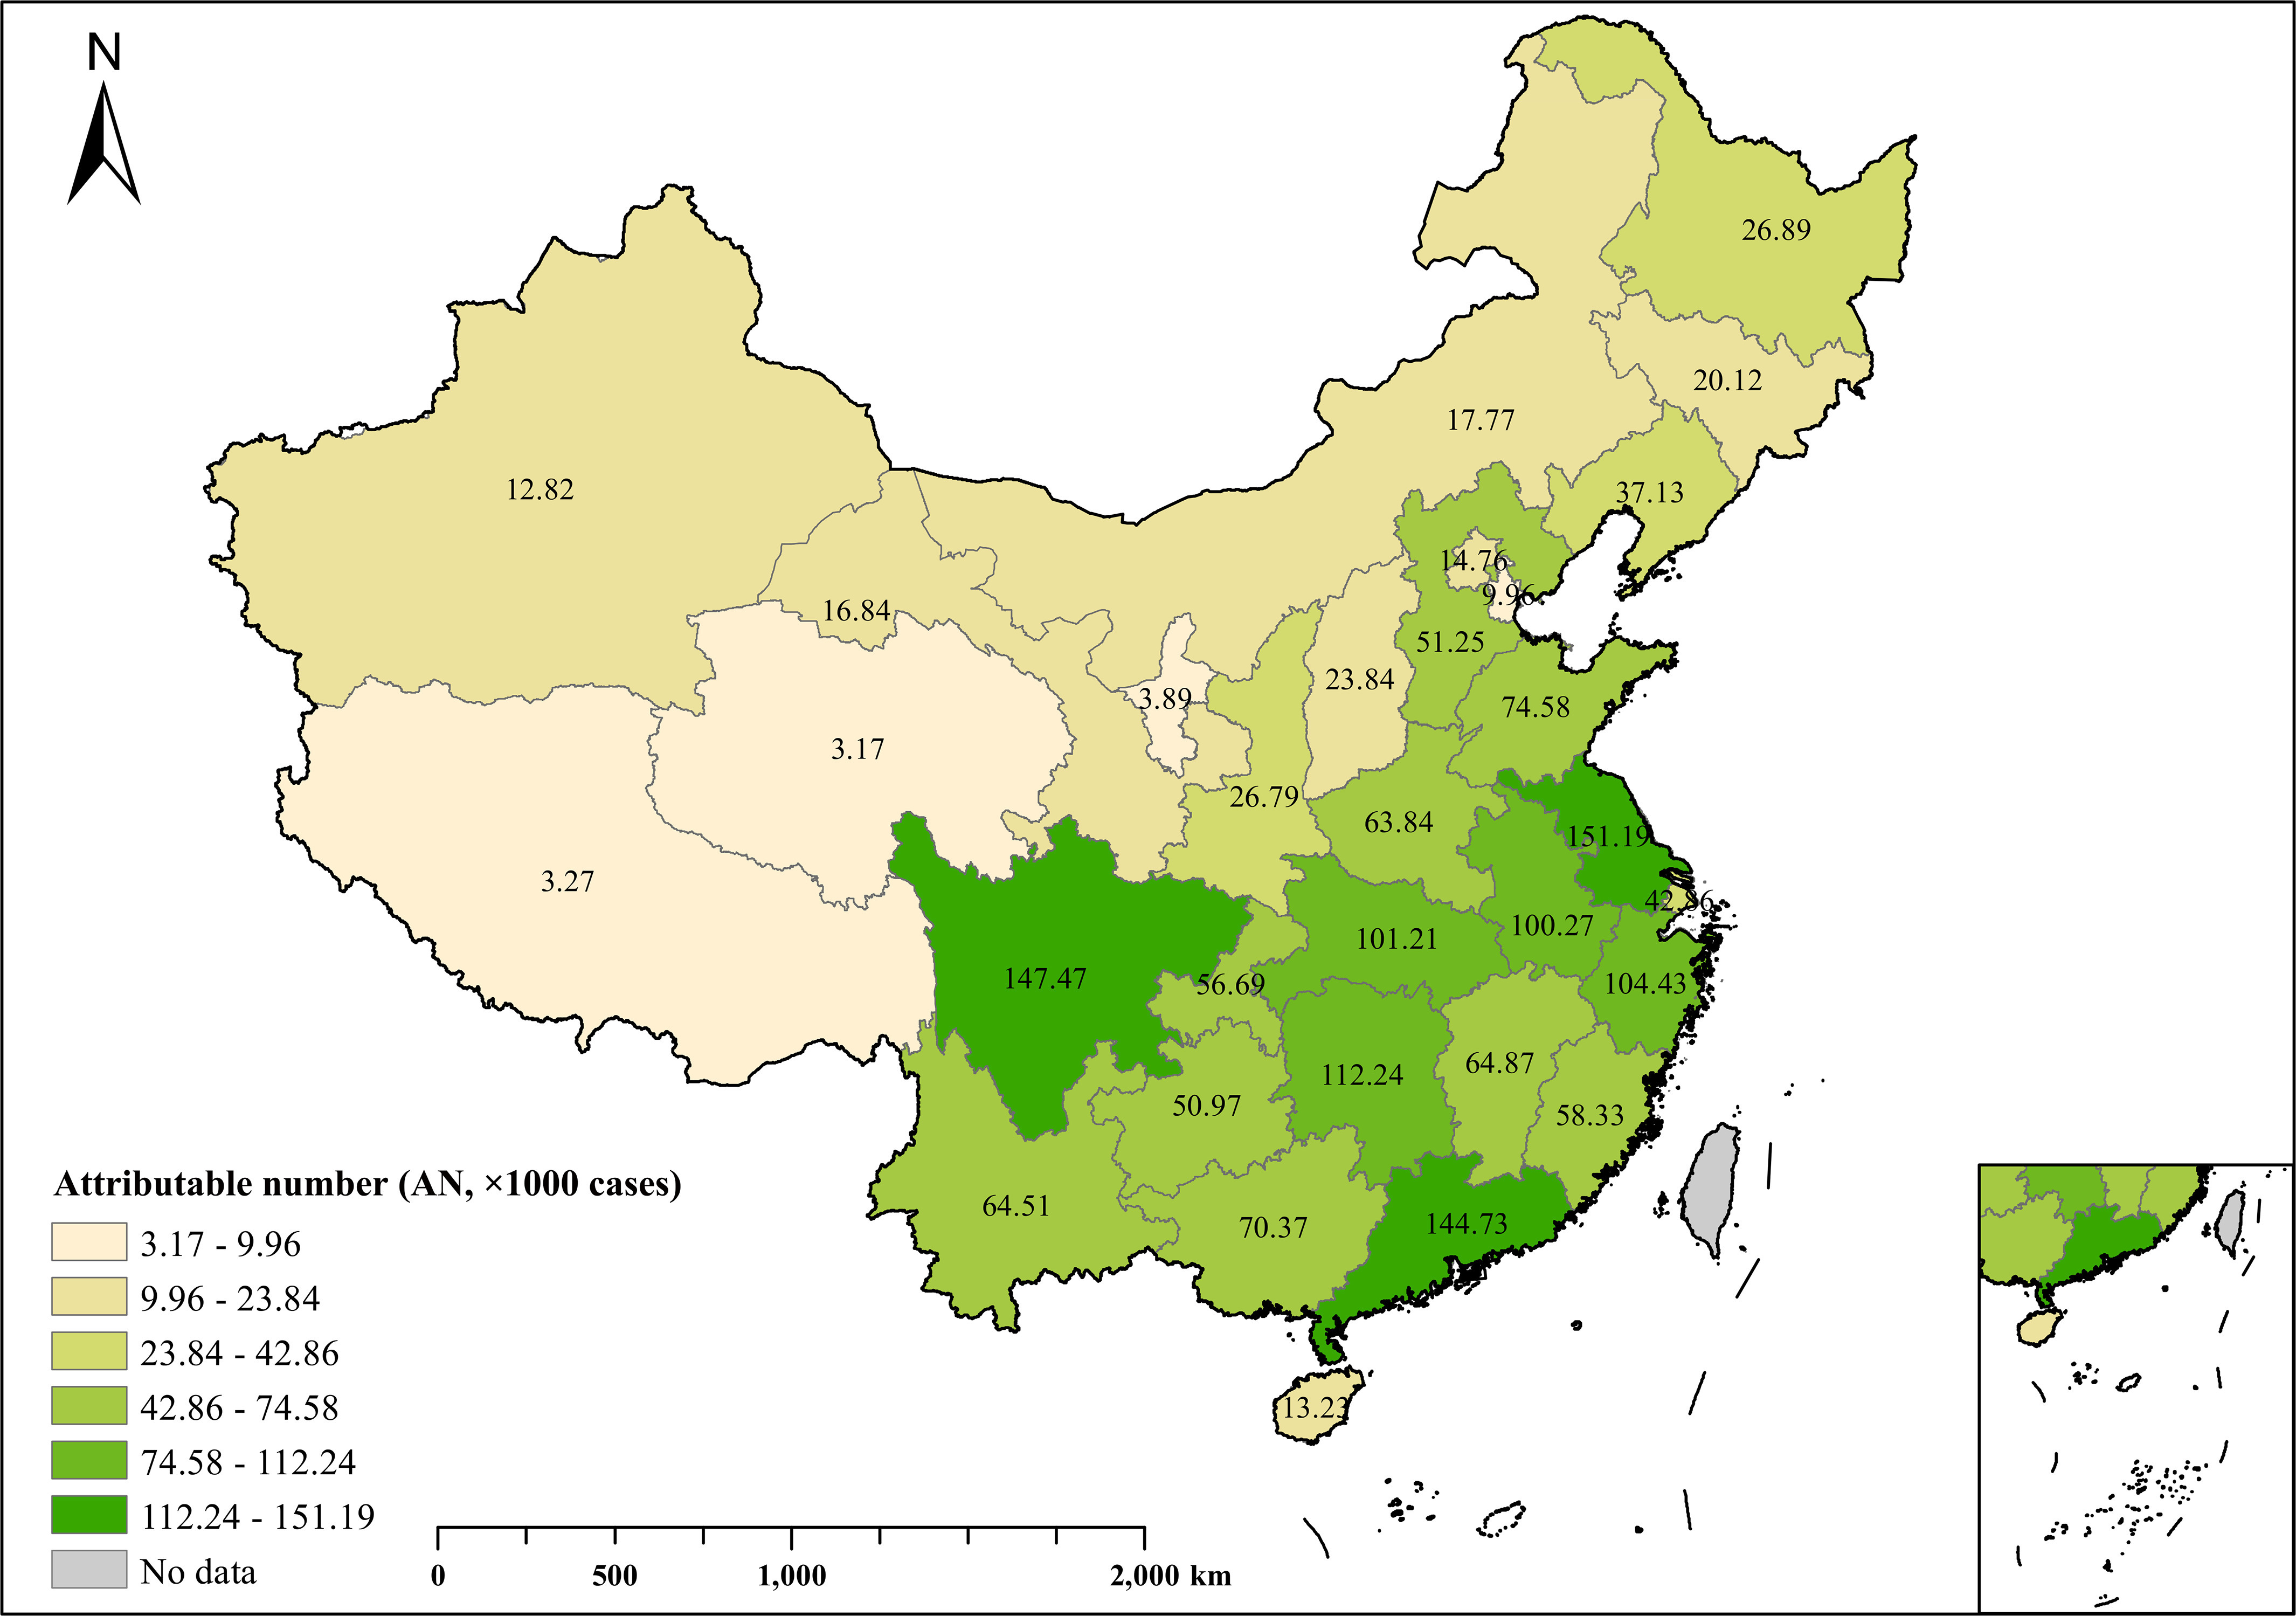
New depression cases prevented by residential greenness exposure at the provincial level in China in 2020. In the figure, the numbers on the map represent AN. Unit: in thousands. The figure was produced using R software based on the background map (https://www.resdc.cn) and results from the study. Table S10 corresponds to this table. Hong Kong, Macau, and Taiwan were not in this analysis. Note: AN, attributable number.