

Abstract
Background:
Depression is a social and public health problem of great concern globally. Identifying and managing the factors influencing depression are crucial for preventing and decreasing the burden of depression.
Objectives:
Our objectives are to explore the association between residential greenness and the incidence of depression in an older Chinese population and to calculate the disease burden of depression prevented by greenness exposure.
Methods:
This study was the Chinese part of the World Health Organization Study on Global AGEing and Adult Health (WHO SAGE). We collected the data of 8,481 residents years of age in China for the period 2007–2018. Average follow-up duration was 7.00 () years. Each participant was matched to the yearly maximum normalized difference vegetation index (NDVI) at their residential address. Incidence of depression was assessed using the Composite International Diagnostic Interview (CIDI), self-reports of depression, and/or taking depression medication. Association between greenness and depression was examined using the time-dependent Cox regression model with stratified analysis by sex, age, urbanicity, annual family income, region, smoking, drinking, and household cooking fuels. Furthermore, the prevented fraction (PF) and attributable number (AN) of depression prevented by exposure to greenness were estimated.
Results:
Residential greenness was negatively associated with depression. Each interquartile range (IQR) increase in NDVI buffer was associated with a 40% decrease [; 95% confidence interval (CI): 0.37, 0.97] in the risk of depression incidence among the total participants. Subgroup analyses showed negative associations in urban residents (; 95% CI: 0.12, 0.86) vs. rural residents, in high-income residents (; 95% CI: 0.11, 0.71) vs. low-income residents, and in southern China (; 95% CI: 0.26, 0.95) vs. northern China. Over 8.0% (; 95% CI: 1.38%, 15.40%) and 1,955,199 (95% CI: 310,492; 3,464,909) new cases of depression may be avoided by increasing greenness exposures annually across China.
Discussion:
The findings suggest protective effects of residential greenness exposure on depression incidence in the older population, particularly among urban residents, high-income residents, and participants living in southern China. The construction of residential greenness should be included in community planning. https://doi.org/10.1289/EHP13947
Introduction
Mental disorders are social and public health problems that are attracting increasing attention globally. Depression is one of the mental disorders characterized by a persistent low mood, decreased interest in activities of daily living, memory loss, and inability to concentrate.1 The Global Burden of Diseases, Injuries, and Risk Factors Study 2019 (GBD 2019) showed that depression is a common cause of disability worldwide.2 It was reported that an estimated about 246 million people suffered from depression worldwide in 2020.3
As life expectancy increases and population aging accelerates in China, depression among older adults has become a serious public health challenge. The China Mental Health Survey (CMHS), a representative cross-sectional survey of Chinese adults over 18 years of age from 157 representative population-based monitoring sites in 31 provinces, showed that the 12-month prevalence rates (weighted by age, sex, and residence distribution) of depression were 4.1% and 3.8% in those 50–64 years of age and those older than 65 years, respectively.4 Compared to the younger population, older people with depression more often suffer cognitive impairment and anxiety.5–7 For example, a study showed that the prevalence of cognitive symptoms was higher in depression patients over 45 years of age (45–54 years: 31.1%; 55–64 years: 30.2%; 65–74 years: 28.8%; and years: 26.6%) than in patients aged younger than 45 years (18–29 years: 17.4% and 30–44 years: 21.2%).6 Specific social, physiological, and psychosocial factors like ageing-related processes and loneliness contribute to the high prevalence of depression in older adults, while factors such as diseases, physical illness, and long-term drug usage can lead to the escalation of depression symptoms.8,9 Furthermore, depression in older people can contribute to increased health care costs, nonadherence to therapeutic proceedings, reduced personal quality of life, and even suicide.10 Therefore, identifying and managing influencing factors of depression is crucial to prevent and decrease the disease burden.
Previous studies have identified many natural environmental factors influencing mental health, including sunlight, climate change, temperature, and air pollutants.11–13 Several studies suggested greenspace to be another influential factor for preventing depression.14–16 Greenspace is usually defined as land with vegetation cover, including undeveloped land with natural vegetation such as flowers, grasses, and trees, and developed greenspaces such as parks, gardens, and streets with green cover.17 Several studies have illustrated the association of greenness with reduced depression in older adults in various populations, such as in Americans, Swedes, and Africans.18–20 But due to the large variations in green vegetation exposure metrics, exposure assessment methods, and greenness levels between these studies, the findings were largely heterogeneous. Some results suggest that exposure to greenness can improve subjective well-being and reduce the odds of depression in the older adult population.21–22 However, other studies have not found such protective effects of greenness on depression incidence.20,23 Therefore, more studies are needed to comprehensively estimate the association between exposure to greenness and depression incidence.
Several issues regarding the association between greenness and depression remain unelucidated. China is a vast country with varying greenness, health status, climate, and demographic characteristics. However, previous cohort studies conducted in China were based on a single city or a single province, and a holistic study between greenness and depression across China is needed.24 As a result, the disease burden that could be prevented by exposure to greenness across China remains unknown. Therefore, further studies are needed to investigate the association between greenness exposure and incidence of depression in China. Recently, at a workshop organized by the National Academy of Sciences, Engineering, and Medicine (NASEM), specialists emphasized the importance of health-promoting environments, such as urban green spaces, and called for actions to focus on the contribution of greenness to mental health.25
In this study, we conducted an analysis based on the World Health Organization Study on Global AGEing and Adult Health (WHO SAGE) to estimate the association between residential greenness exposure and the risk of depression incidence in a Chinese population over 50 years of age.
Methods
Study Settings and Subjects
The WHO SAGE is a cohort study conducted in six countries (China, Ghana, India, Mexico, Russia, and South Africa). In each included country, nationally representative samples of people years of age were selected as primary samples, and samples of people 18–49 years of age were selected as additional and comparison samples.26 This study was the Chinese part of the WHO SAGE (https://www.who.int/data/data-collection-tools/study-on-global-ageing-and-adult-health). Considering the geographical and demographic characteristics, we set the study areas in seven provinces (Shaanxi, Hubei, Shandong, Jilin, Yunnan, Guangdong, and Zhejiang) and one municipality (Shanghai). One rural and one urban site were selected from each province and municipality. Study participants were selected using stratified multistage random cluster sampling from 2007 to 2018. Figure 1 illustrates the provinces and municipality selected for this study. To increase the sample size, new participants were included in each wave of the follow-up investigation. A total of 18,673 people were included in the first wave (baseline investigation, 2007–2010), second wave (follow-up investigation, 2014–2015), and third wave (follow-up investigation, 2018). We excluded data from participants lost to follow-up, with depression at baseline, those younger than 50 years, and with missing morbidity information and key variables (demographic information, including sex, age; socioeconomic factors, including marital status, urbanicity, education, annual family income, and region; and health risk behaviors, including smoking status, drinking status, and household cooking fuel). A total of 8,481 participants were finally selected for this study. The details of the participant selection process are shown in Figure 2.
Figure 1.
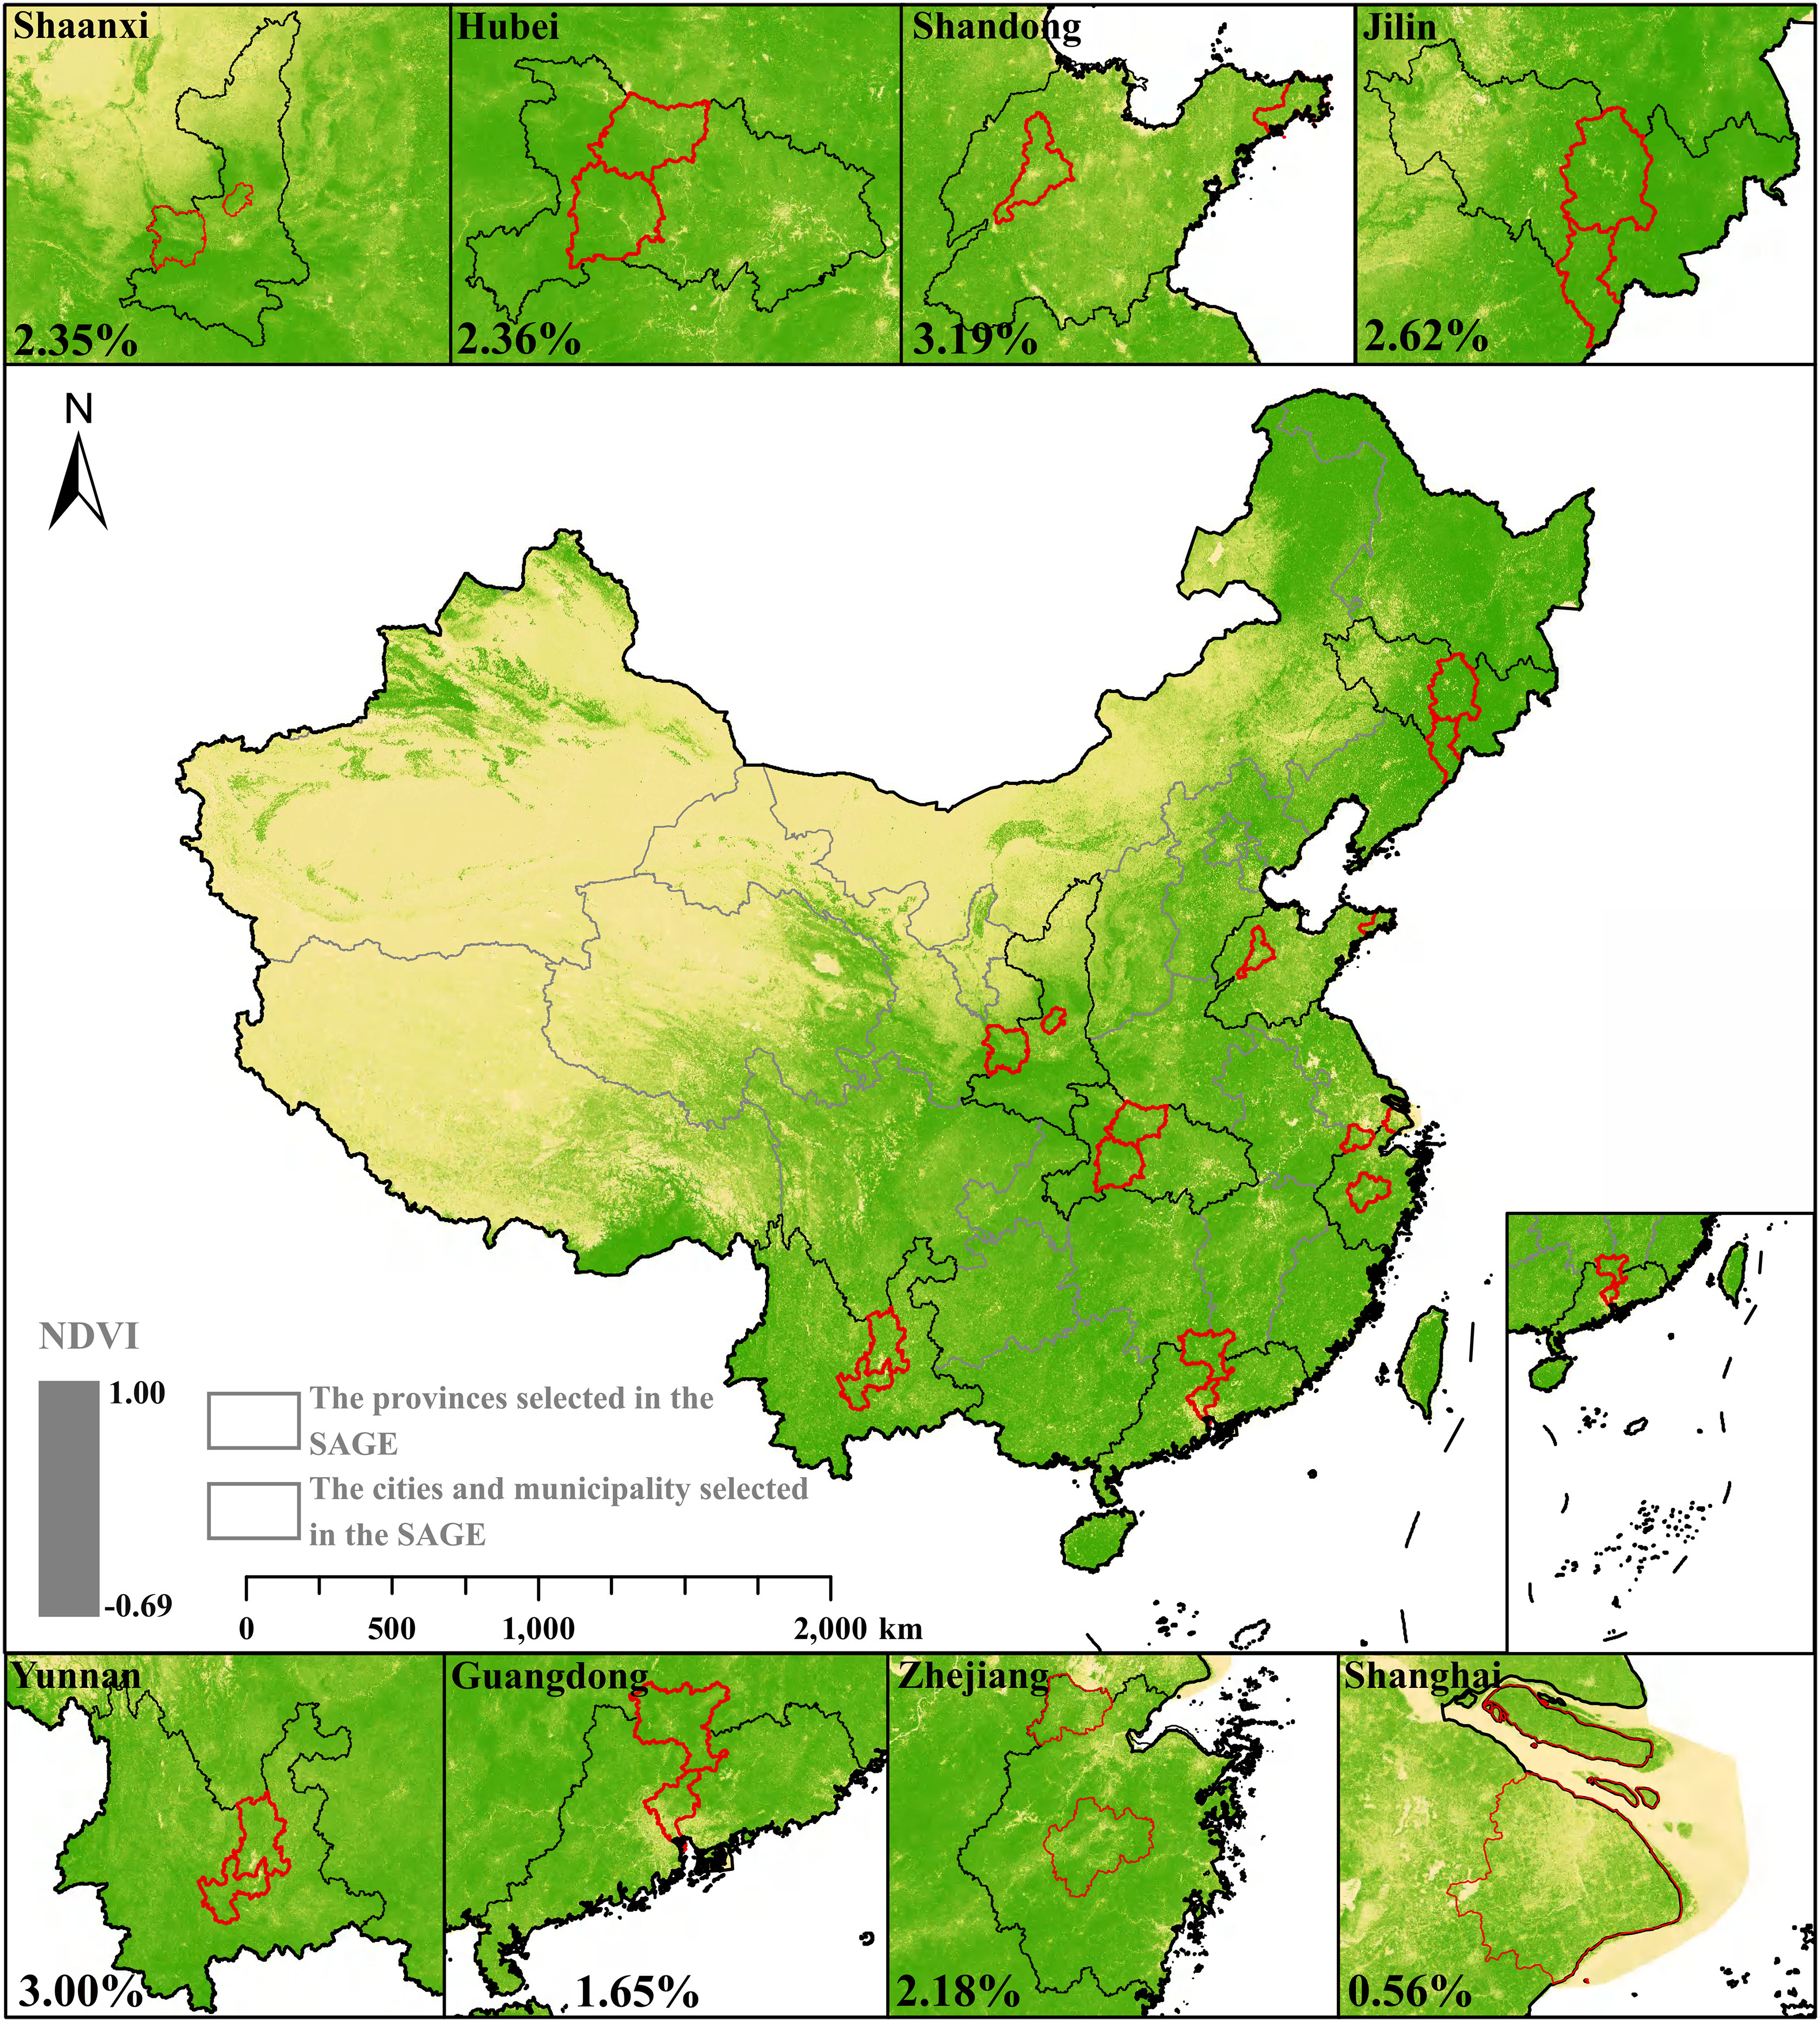
Annual average maximum NDVI across China during the SAGE study period (2007–2018). In the figure, the color shades of yellow and green represent the NDVI, the black ranges represent the provinces where the study was conducted, and the red ranges represent the cities and municipality where the study was conducted. The percentage in each selected province/municipality indicates the incidence rate of depression during the study period. The figure was produced using R software based on the background map (https://www.resdc.cn), NDVI data (http://www.nesdc.org.cn), and results from the study. Note: NDVI, normalized difference vegetation index; SAGE, Study on Global Ageing and Adult Health.
Figure 2.

The selection process of SAGE study participants in China. Missing key information includes drinking status (), body mass index (), household cooking fuel (), annual family income (), smoking status (), and marital status (). Note: SAGE, Study on Global Ageing and Adult Health.
Data Collection
In the baseline investigation, we collected the information of each participant entering the cohort by a face-to-face interview. The collected information included demographic characteristics, residential address, basic health status, and health risk behavior. Newly recruited participants in the later waves completed the same investigation as those recruited from the baseline. In the second and third waves, participants recruited in the previous waves and newly recruited were also interviewed face-to-face to collect changes in their baseline information, including residence, health influence factors like the utilization of health-care services, health risk behaviors like smoking status and drinking status, and information on morbidity and loss to follow-up. This study was approved by the Ethics Committee of the Chinese Center for Disease Control and Prevention (approval number 200601) for the baseline investigation and by the Shanghai Municipal Center for Disease Control and Prevention (approval number 2014-8, 2018-1) for the second and third waves of investigation. Informed consent was obtained from each participant before the investigation.
Assessment of Residential Greenness Exposure
We assessed participants’ residential greenness exposure using the normalized difference vegetation index (NDVI). NDVI is a value derived from satellite images that can measure the relative abundance and spatial distribution of vegetation. NDVI calculates the ratio of the difference between the near-infrared region and red reflectance to the sum of these two measures, which ranges from to 1, with the larger values indicating higher levels of vegetative density in the area.27,28 The NDVI dataset across China from 2007 to 2018 was obtained from National Ecosystem Science Data Center, National Science & Technology Infrastructure of China (http://www.nesdc.org.cn),29,30 which was calculated based on Google Earth Engine (GEE). The authors used Landsat 5/7/8/9 remote sensing data for the year to obtain the maximum NDVI for each image element through de-clouding, de-shading, and data smoothing. The spatial resolution of this dataset was and the temporal resolution was years.
R software was used to match the greenness data. Based on the above datasets and the latitude and longitude of the participants’ residential addresses obtained from the portable satellite devices (Garmin eTrex) in each on-site investigation, we matched the annual maximum greenness exposure data to individual participant addresses. Each participant was assigned greenness exposure data averaged over the year before the investigation and the current year (2 years’ average). For example, if the participants developed depression during the second wave investigation or were lost to follow-up, their greenness exposure was the average vegetation index for the year before and during the current year of the follow-up investigation. If participants developed depression during the third wave of the investigation or did not develop depression during any of the waves, the average vegetation index for the year before and during the current year of the follow-up investigation were calculated as the participants’ greenness exposure.
We extracted the average NDVI at each residential address within , , , and buffers. We also extracted NDVI in buffers at and for sensitivity analysis. According to previous studies,31,32 and buffers represent greenness that is directly accessible, a buffer represents greenness that can be reached in about 5–10 min walking, and a buffer represents 10–15 min walking. We additionally defined and buffers, which have shown significant associations between greenness and health within these buffer sizes,33 to simulate the distance participants would visit or travel to green environments further from residential addresses, such as cropland, natural forests, and grasslands.
Assessment of Depression
Individuals who met at least one of the following three criteria were defined as having incident depression based on: a) self-reported being clinically diagnosed with depression; b) taking depression medication in the past 12 months before the interview; and c) meeting the diagnosis criteria of major depressive episode (MDE) by the World Mental Health Survey version of the Composite International Diagnostic Interview (CIDI) during the follow-up period.34 There were 18 items in the CIDI, which had been used in previous studies to assess depression.35 It has been reported that an excellent concordance was found in CIDI and the Structured Clinical Interview for DSM-IV Axis I Disorders (SCID-I, gold standard) [area under the receiver operator characteristic curve ], which indicates acceptable validity of CIDI in diagnosing mood disorders and better agreement with clinical assessments.36,37 We used specific algorithms to calculate the results of the individual symptom items to obtain participants’ depressive episodes during the past 12 months.38 Two dimensions’ scores were calculated to determine depression, and participants were identified as having depression if they met both the first dimension (6 items) and the second dimension (12 items). Details of the scale content and algorithm can be found in Tables S1 and S2.
Covariates
We applied a directed acyclic graph (DAG) to select covariates from previous studies (Figure S1), and the following factors were selected: sex, age, marital status, urbanicity, education, annual family income, and region. Sex was divided into “male” and “female.” Age was divided into “ years” and “ years.” Marital status was divided into “married” (currently married and cohabiting) and “unmarried” (never married, separated, divorced, and widowed). According to the criteria published by the National Bureau of Statistics of China, urbanicity was divided into “rural” and “urban.” Education was divided into “low” (no formal education, below primary school, and primary school completed) and “moderate and high” (middle school, high school, college, and post-graduate degree).39 The median was used to divide the family annual income into “low” ( Yuan) and “high” ( Yuan). The study regions were divided into “southern China” (Zhejiang, Guangdong, Hubei, Yunnan, and Shanghai) and “northern China” (Jilin, Shandong, and Shaanxi), based on the Qinling Mountains-Huaihe River Line.40
In addition, we also included smoking status, drinking status, household cooking fuel, vegetable intake, and fruit intake as covariates and tested their potential confounding effects, as previous studies have suggested them as confounders in the associations between greenness and human health.41–44 Smoking status was divided into “nonsmoker” and “smoker,” and drinking status was divided into “nondrinker” and “drinker.” Household cooking fuel was divided into “clean” (included liquefied petroleum gas, natural gas, and electricity) and “unclean” (included kerosene, paraffin, coal, charcoal, wood, agriculture crops, dung, shrubs, and grass).45 Vegetable and fruit intakes were measured as the number of servings on a typical day, and were divided into “sufficient intake” (having five or more servings) and “insufficient intake” (having fewer than five servings).46 Details of the covariates’ definitions are shown in Table S3.
Statistical Analysis
In this study, proportions and means with standard deviations (SD) and medians with interquartile ranges (IQR) were used to describe the basic characteristics of the participants. Spearman’s correlation analyses were used to estimate the correlations among the NDVI exposures with different years. A time-dependent Cox proportional hazards regression model (waves of the investigation were used as time scale) was developed to investigate the association between residential greenness and depression incidence, with and without adjustment for covariates identified by the DAG (sex, age, marital status, urbanicity, education, annual family income, and region). We calculated the hazard ratios (HRs) and corresponding 95% confidence intervals (95% CIs) for each IQR increase in NDVI. A series of univariate analyses were used to estimate the associations of covariates with depression incidence. We also explored the nonlinear association between NDVI and depression by applying a natural spline with 3 degrees of freedom (df). Likelihood ratio test was used to test the nonlinearity.47 We mainly reported the results of each IQR for NDVI with buffers of , , , and .
Multicollinearity was diagnosed using the variance inflation factor (VIF) for the included covariates. The results showed that the VIFs of all variables in the adjusted model were , suggesting a lower risk of multicollinearity. Stratified analyses were conducted separately by sex, age, urbanicity, annual family income, region, smoking, drinking, and household cooking fuels to explore their modification effects. The results of the stratified analysis of the NDVI in a buffer were mainly reported. Two-sample z-tests were conducted to explore whether statistical differences existed among the subgroups.48
We used the following formula to calculate the population attributable fraction (PAF) (%) of depression attributable to residential greenness exposure49:
| (1) |
where denotes the proportion of greenness exposure in category i. We used the average exposure across all waves of the investigation to estimate the greenness exposure category. denotes the relative risk of depression in each exposure category. We used to estimate , which has also been used in previous studies.50,51 Due to the negative association between greenness and depression, the PAF estimated above was negative. To make it easier to explain the PAF, we introduced the prevented fraction (PF) (%), which means that if everyone was exposed to residential greenness, the proportion of outcomes could be avoided52:
| (2) |
Using southern and northern China-specific PAFs and PFs, we also calculated the number of new depression cases prevented by residential greenness exposure at the provincial level [attributable number (AN)] using the following formula:
| (3) |
The population numbers used in the calculations were all those aged 50 and older. Where IR denotes the incidence of depression in China in 2019. We calculated the IR by using the estimated incident depression cases from the GBD 2019 study (https://www.healthdata.org/) divided by the population size in 2019, which was obtained from World Population Prospect 2022 (WPP 2022).53 denotes the population size of province i in 2020 from the Seventh Census of China.54 denotes the region-specific (southern and northern China) PF estimated by Equation 2. Finally, the national AN was calculated using the national PF and population data.
Sensitivity analyses were performed to test the robustness of the results. Several models were developed to adjust for the covariates identified by the DAG and other covariates, including smoking status, drinking status, and household cooking fuel. As information on vegetable intake (2.87%) and fruit intake (6.30%) was missing, we tested the robustness of our findings by including or excluding these covariates only in participants with complete information. The NDVI in the and buffers were also used in the sensitivity analysis. We also applied different exposure durations to assess residential greenness levels, such as an average of 1 year (the year of the investigation) and an average of 3 years (2 years before and the year of the investigation).
All statistical analyses were performed using R version 4.2.2 (R Foundation for Statistical Computing). R packages such as “mgcv,” “ggplot2,” and “survival” were used for the analysis. In these packages, we used the “coxph” function from the “survival” package to build the time-dependent Cox proportional hazards regression models. The “ns” in “mgcv” package was used to estimate the exposure–response curves between NDVI and depression incidence. The DAG were constructed using DAGitty v3.1 (https://dagitty.net/).55 Statistical significance was set at .
Results
Basic Characteristics of the Study Population
Table 1 summarizes the general characteristics of study participants. A total of 8,481 participants were included in the analysis, with a mean age of 62.05 () years. The mean follow-up duration was 7.00 () years, and 58,972 person-years were recorded. Of the total participants, 4,355 (51.35%) were female, 4,524 (53.34%) were aged 60 years or older, 7,336 (86.50%) were married, 4,834 (57.00%) lived in rural areas, 5,615 (66.21%) were nonsmokers, 5,722 (67.47%) were nondrinkers, and 4,694 (55.35%) used clean household cooking fuels. The general characteristics of the study participants in each province and municipality are shown in Table S4.
Table 1.
Baseline characteristics of the study participants in the SAGE.
| Characteristics | Total participants (%) | Person years of follow-up | Depression incidence | |
|---|---|---|---|---|
| No (%) | Yes (%) | |||
| Total | 8,481 (100.00) | 58,972 | 8,291 (97.76) | 190 (2.24) |
| Sex | ||||
| Male | 4,126 (48.65) | 29,263 | 4,060 (98.40) | 66 (1.60) |
| Female | 4,355 (51.35) | 29,709 | 4,231 (97.15) | 124 (2.85) |
| Age (years) | ||||
| 3,957 (46.66) | 27,930 | 3,890 (98.31) | 67 (1.69) | |
| 4,524 (53.34) | 31,042 | 4,401 (97.28) | 123 (2.72) | |
| Marital status | ||||
| Married | 7,336 (86.50) | 51,007 | 7,190 (98.01) | 146 (1.99) |
| Unmarried | 1,145 (13.50) | 7,965 | 1,101 (96.16) | 44 (3.84) |
| Urbanicity | ||||
| Rural | 4,834 (57.00) | 34,034 | 4,730 (97.85) | 104 (2.15) |
| Urban | 3,647 (43.00) | 24,938 | 3,561 (97.64) | 86 (2.36) |
| Education | ||||
| Low | 3,587 (42.29) | 24,896 | 3,481 (97.04) | 106 (2.96) |
| Moderate and high | 4,894 (57.71) | 34,076 | 4,810 (98.28) | 84 (1.72) |
| Annual family income (Yuan) | ||||
| Low () | 4,363 (51.44) | 32,127 | 4,244 (97.27) | 119 (2.73) |
| High () | 4,118 (48.56) | 26,845 | 4,047 (98.28) | 71 (1.72) |
| Region | ||||
| Southern China | 5,291 (62.39) | 36,916 | 5,190 (98.09) | 101 (1.91) |
| Northern China | 3,190 (37.61) | 22,056 | 3,101 (97.21) | 89 (2.79) |
| Smoking status | ||||
| Nonsmoker | 5,615 (66.21) | 38,210 | 5,474 (97.49) | 141 (2.51) |
| Smoker | 2,866 (33.79) | 20,762 | 2,817 (98.29) | 49 (1.71) |
| Drinking status | ||||
| Nondrinker | 5,722 (67.47) | 38,687 | 5,587 (97.64) | 135 (2.36) |
| Drinker | 2,759 (32.53) | 20,285 | 2,704 (98.01) | 55 (1.99) |
| Household cooking fuel | ||||
| Clean fuel | 4,694 (55.35) | 30,610 | 4,600 (98.00) | 94 (2.00) |
| Unclean fuel | 3,787 (44.65) | 28,362 | 3,691 (97.47) | 96 (2.53) |
| Vegetable intake | ||||
| Sufficient intake | 5,828 (70.75) | 43,103 | 5,697 (97.75) | 131 (2.25) |
| Insufficient intake | 2,410 (29.25) | 14,308 | 2,354 (97.68) | 56 (2.32) |
| Missing | 243 | 1,561 | 240 (98.77) | 3 (1.23) |
| Fruit intake | ||||
| Sufficient intake | 1,252 (15.75) | 9,341 | 1,232 (98.40) | 20 (1.60) |
| Insufficient intake | 6,695 (84.25) | 46,072 | 6,536 (97.63) | 159 (2.37) |
| Missing | 534 | 3,559 | 523 (97.94) | 11 (2.06) |
Note: SAGE, Study on Global Ageing and Adult Health.
Table 2 shows the residential NDVI for the different buffers. Taking the buffer as an example, the mean NDVI in all participants was 0.57 (), the minimum value was 0.19, and the maximum value was 0.93. We found that residential greenness was highly correlated (0.92–0.99) between study period, suggesting that these participants had a stable greenness exposure (Figure S2). Residential NDVI levels in the subgroups are presented in Table S5.
Table 2.
Residential greenness levels with different buffers among SAGE participants ().
| NDVI in buffer | Median, IQR | Minimum | Maximum | |||
|---|---|---|---|---|---|---|
| 0.50, 0.35 | 0.35 | 0.71 | 0.18 | 0.93 | ||
| 0.54, 0.36 | 0.37 | 0.73 | 0.22 | 0.92 | ||
| 0.60, 0.36 | 0.38 | 0.74 | 0.19 | 0.93 | ||
| 0.61, 0.35 | 0.39 | 0.74 | 0.25 | 0.92 | ||
| 0.62, 0.33 | 0.40 | 0.73 | 0.23 | 0.91 | ||
| 0.63, 0.31 | 0.42 | 0.73 | 0.26 | 0.91 |
Note: Residential greenness levels (NDVI) were all NDVI values measured at previous timepoint. IQR, interquartile range; NDVI, normalized difference vegetable index; , 25th percentile; , 75th percentile; SAGE, Study on Global Ageing and Adult Health; SD, standard deviation.
A total of 190 participants (2.24%) were newly identified with depression during the study period. Among the study regions, we found a lower incidence in Shanghai (0.56%), Guangdong (1.65%), and Zhejiang (2.18%) and a higher incidence in Shandong (3.19%), Yunnan (3.00%), and Jilin (2.62%) (Figure 1; Table S6).
Associations of Residential Greenness Exposure with Depression Incidence
Figure 3 shows the negative relationship between NDVI and the incidence of depression. As NDVI () increases, the risk of depression incidence decreases sharply between 0.2 and 0.4 of NDVI, and after that the risk of depression was flattened.
Figure 3.

Exposure–response curve of NDVI with depression incidence among SAGE participants in China (). Adjustment for sex, age, marital status, urbanicity, education, annual family income, and region. A time-dependent Cox proportional hazards regression model with natural spline function () was used to analyze the nonlinear relationship. Likelihood ratio test was used to test the nonlinearity. The solid line is the HR, the dashed lines are the 95% CI of the HR, and the green shaded area represents the population density. (A) NDVI in buffer. (B) NDVI in buffer. (C) NDVI in buffer. (D) NDVI in buffer. Note: CI, confidence interval; df, degrees of freedom; HR, Hazard ratio; NDVI, normalized difference vegetation index; SAGE, Study on Global Ageing and Adult Health.
In the linear models adjusted for covariates from the DAG, the HR of depression incidence for each IQR increase in NDVI buffer was 0.60 (95% CI: 0.37, 0.97) in all included participants. For each IQR increase in NDVI , , and buffers, the HRs were 0.68 (95% CI: 0.47, 0.98), 0.65 (95% CI: 0.43, 0.98), and 0.61 (95% CI: 0.38, 0.97), respectively (Figure 4; Table S7). We also found significantly negative associations between NDVI and depression in urban participants (; 95% CI: 0.12, 0.86) vs. rural participants, in high-income participants (; 95% CI: 0.11, 0.71) vs. low-income participants, in southern China (; 95% CI: 0.26, 0.95) vs. northern China, in nonsmokers (; 95% CI: 0.29, 0.98) vs. smokers, in nondrinkers (; 95% CI: 0.23, 0.83) vs. drinkers, and in clean cooking fuel users (; 95% CI: 0.16, 0.83) vs. unclean cooking fuel uses (Figure 5). The associations between greenness and the covariates are shown in Table S8.
Figure 4.

Hazard ratios (HRs) and 95% confidence intervals (CIs) for the effect of residential greenness at different buffers on depression incidence (per IQR increase) among SAGE participants in China (). Model 1 included crude models without controlling for any covariates. Model 2 included models adjusted for the covariates from the DAG, including sex, age, marital status, urbanicity, education, annual family income, and region. A time-dependent Cox proportional hazards regression model was used to analyze the linear relationship. The error bars in the figure are the 95% CI and the dots and triangles are the HR. Table S7 corresponds to this figure. Note: CI, confidence interval; DAG, directed acyclic graph; HR, hazard ratio; IQR, interquartile range; SAGE, Study on Global Ageing and Adult Health.
Figure 5.

The HRs and 95% CIs of depression incidence for residential greenness (each IQR increment in NDVI buffer) among SAGE participants in China (). Adjustment for sex, age, marital status, urbanicity, education, annual family income, region, smoking status, drinking status, and household cooking fuel. In subgroup analyses, other confounders except for the subgroup category variable, analyzed as an independent variable, were adjusted for. A time-dependent Cox proportional hazards regression model was used. For difference values were calculated by Z-tests. The error bars in the figure are its 95% CI, the dots are the HR. Note: CI, confidence interval; HR, hazard ratio; IQR, interquartile range; NDVI, normalized difference vegetation index; Ref, Reference group; SAGE, Study on Global Ageing and Adult Health.
PAF, PF, and AN of Depression Incidence Attributable to Residential Greenness
We calculated the PAFs and PFs of depression incidence due to residential greenness exposure. In the total participants, 8.69% of new cases of depression could be avoided (; 95% CI: 15.40%, 1.38%). In addition, 9.93% of new cases of depression in southern China (; 95% CI: 18.18%, 0.74%) and 4.23% of new cases of depression in northern China (; 95% CI: 14.98%, ) could be avoided. The details of the subgroup analyses are presented in Table S9.
Figure 6 and Table S10 show the number of new cases of depression prevented by residential greenness exposure at the national and provincial levels. In total, 1,955,199 (95% CI: 310,492; 3,464,909) people over 50 years of age may be protected from depression by exposure to residential greenness across China in 2020. Jiangsu (; 95% CI: 11,267; 276,809), Sichuan (; 95% CI: 10,989; 269,982), and Guangdong (; 95% CI: 10,785; 264,967) had the highest number of new cases of depression prevented by greenness, while the ANs were less in Qinghai (; 95% CI: , 11,211), Tibet (; 95% CI: 244; 5,992), and Ningxia (; 95% CI: ; 13,785).
Figure 6.
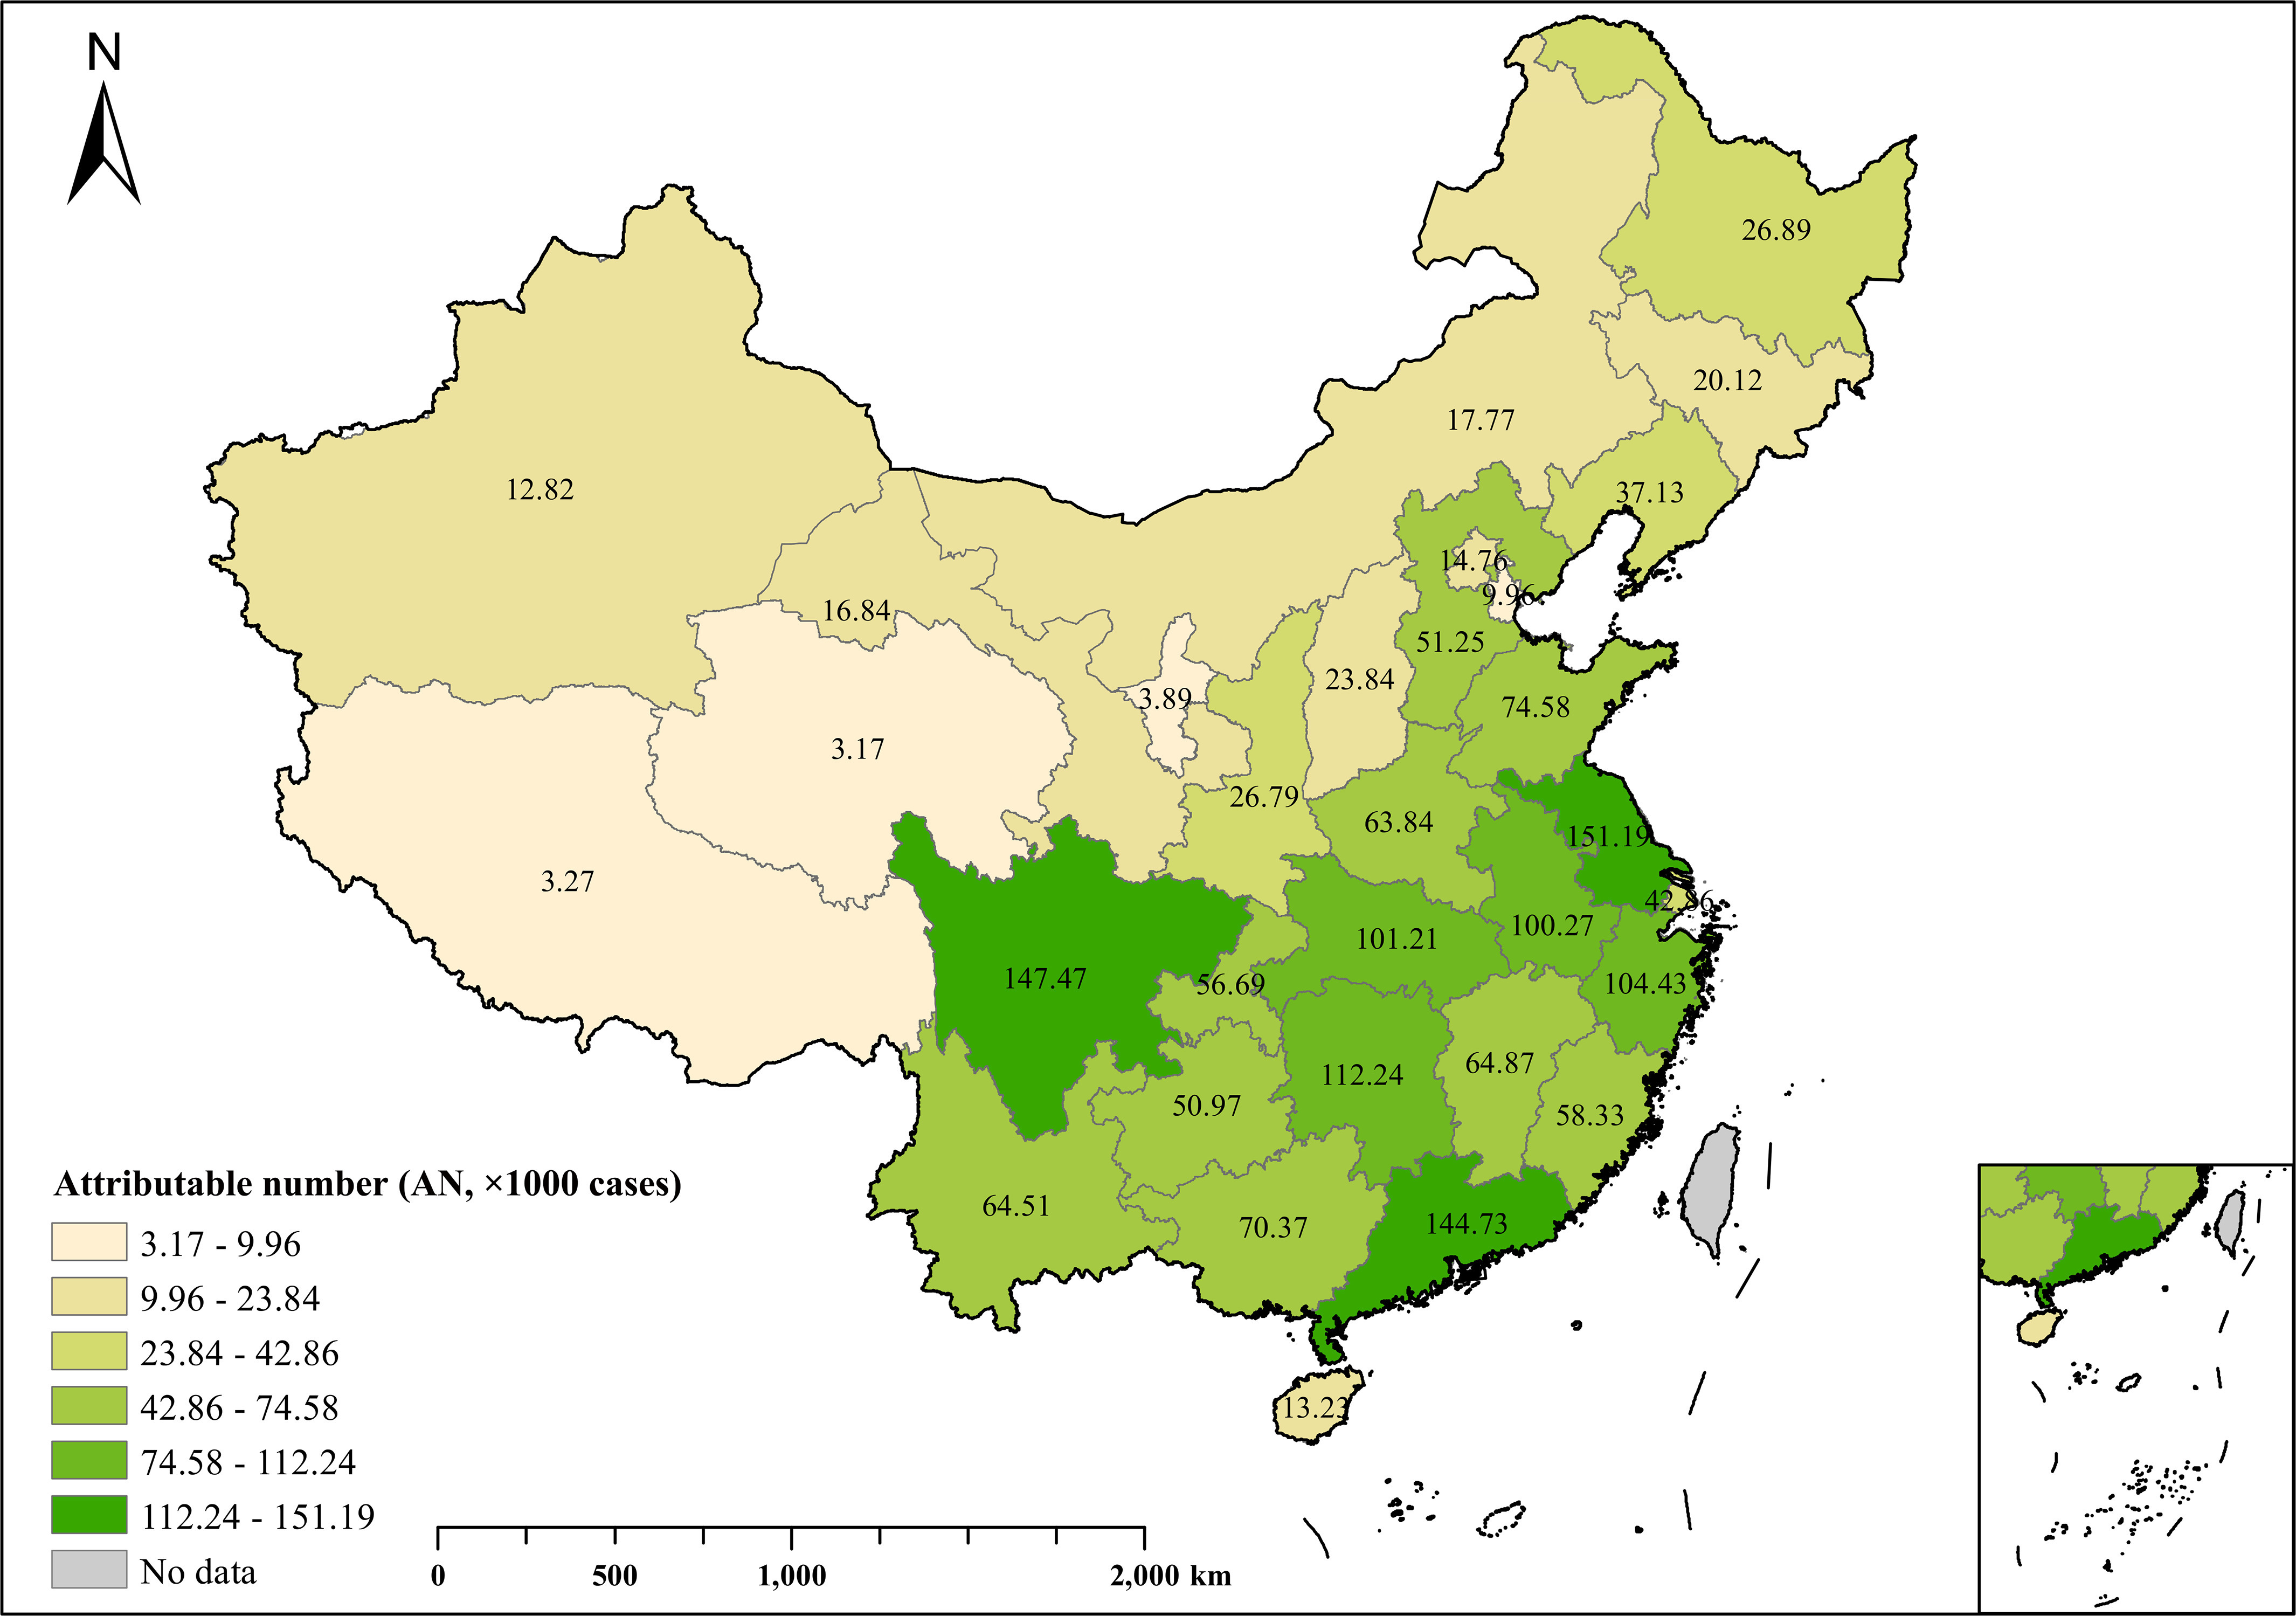
New depression cases prevented by residential greenness exposure at the provincial level in China in 2020. In the figure, the numbers on the map represent AN. Unit: in thousands. The figure was produced using R software based on the background map (https://www.resdc.cn) and results from the study. Table S10 corresponds to this table. Hong Kong, Macau, and Taiwan were not in this analysis. Note: AN, attributable number.
Sensitivity Analysis
The results of the sensitivity analyses are presented in Table S11. We found that adjusting for vegetable and fruit intake did not significantly change the association between greenness and incidence of depression. Similarly, the different buffers ( and ) and exposure durations (average of 1 year and average of 3 years) of selecting NDVI did not substantially change the association.
Discussion
In this national prospective cohort study of an older population in China, we observed that higher levels of NDVI exposure were associated with a reduced risk of depression among all participants. We also found that greenness exposure had significant protective effects in some subgroups, including urban residents, high-income participants, the southern population, nonsmokers, nondrinkers, and users of clean cooking fuels. The results provide valuable information for the development of greenspace planning programs.
Our finding on the protective effects of residential greenness exposure on depression incidence was consistent with some previous studies.22,24,41,56,57 A study in Ningbo, Zhejiang found a protective association of greenness with depression incidence,24 and a study conducted in Henan (a province in northern China) showed that higher greenness exposures may decrease the depression scale score [Patient Health Questionnaire-2 (PHQ-2)].41 The pooled analysis from eight cohort studies in the Netherlands showed that greater green space was associated with a lower prevalence of depression.56 A cohort study conducted in Finland also reported negative associations between depression and cumulative residential greenness exposure in the 5-years and 14-years follow-ups.57 Another study conducted in older adults in Miami, USA observed that compared with individuals living in the lowest tertile of greenness, individuals living in medium and high greenness had 8% and 16% lower odds of depression, respectively.22
However, other studies did not find any significant protective effects of NDVI exposure on depression. For example, a study conducted in Barcelona, Spain, showed a nonsignificant association between surrounding greenness within a buffer and self-reported history of depression.58 The results of a study from Brussels, Belgium also showed a nonsignificant association between urban greenness and depressive disorders.23 The inconsistency may come from the following reasons. First, these two studies were cross-sectional, whereas our study is a cohort study. Longitudinal studies provide stronger epidemiological and causal evidence. Second, this may be related to the inherent characteristics of the area and the greenness assessment methods. Barcelona’s residential greenness assessment was limited to the city and had narrower greenness exposure (), which may have limited its ability to estimate the potential protective effects of greenness on depression effectively. In contrast, this study used a wider greenness exposure (NDVI ) and investigated the effects of greenness at different exposure levels. Previous studies have indicated that ignoring the quality and the time individuals interact with greenness is likely to contribute to the differences between studies.59 Third, the association between greenness and mental health is sensitive to the type of depression assessment, residential greenness indicators, and the spatial scale of analysis,57 which could partly explain the difference between previous studies and our study. For example, the Barcelona study used a single-day NDVI for exposure, whereas we used the annual maximum NDVI to obtain more representative results. The Brussels study used the closest Google Street View panorama to assess the residential greenness exposure, which is a disadvantageous method as the images were not collected simultaneously, and the limited number of monitoring sites made it difficult to gauge the true greenness exposure.60 In contrast, NDVI as a value from satellite images is more temporally accurate and has a wider monitoring range.
Previous studies have explored the mechanisms of residential greenness affecting mental health.61–63 One study summarized the potential pathways linking greenness and health into three domains: restoring capacities (e.g., physiological stress recovery), reducing harm (e.g., reducing exposure to noise and heat), and building capacities (e.g., encouraging physical activity).64 Overall, residential greenness can improve mental health through physiological, living environment, and social channels. First, greenness can affect health through some physiological mechanisms. Green environments could promote people participating in more outdoor activities, which is conducive to weight control, reducing overweight and obesity risks, easing mental stress, and reducing the incidence of depression.65 It also could increase sunlight exposure, which in turn promotes vitamin D synthesis, and reduces oxidative stress.66 Exposure to greenness also has the potential to alter the composition of the human microbiota, and some microorganisms in the soil may help improve emotions, thereby limiting anxiety and depression.67 Second, greenness can improve unhealthy environments, such as cooling urban environments to mitigate the urban heat island effect,68 and reduce air pollution and noise disturbance,69,70 which can help reduce the incidence of chronic diseases and thus maintain mental health. Third, residential greenness can also provide places for outdoor activities and encourages social participation, which helps build good interpersonal relationships, promotes contact and interaction among residents, and increases subjective well-being.27
We found urban residents were more protected by residential greenness. One explanation for this is that urban and rural residents use greenness for different purposes. Urban residents are more likely to use greenness for leisure and social purposes than rural residents. In contrast, rural residents tend to use green space for agricultural needs,71 and greenness for agricultural purposes tends to have lower landscape quality.72 Furthermore, urban residents are more aware of the health benefits of greenness than rural residents, which encourages them to use greenness more actively.73 Another explanation is that there are differences in the type of greenness between rural and urban areas. Compared to urban greenspaces (e.g., parks, gardens, and greenways), greenspaces in rural areas may be undeveloped or inadequately equipped (e.g., natural forests) and not suitable for social activities.74 In addition, it may also be related to urbanization and population density. With higher population densities in urban areas, city residents are more likely to have contact with neighbors and friends, which is beneficial for their mental health.75
This study also suggests that residential greenness has more protective effects in southern China than northern China, which may be partially related to differences in greenness characteristics. For example, southern China is exposed to greenness year-round, whereas northern China is exposed to less greenness in winter because of leaf-fall and snow cover. In addition, people in southern China typically spend more time outdoors than those in northern China, which could increase their chances of greenness exposure in southern China.76
We found modifications by other variables. Smokers and those who drank alcohol were less protected by residential greenness. These results could be attributed to several factors. Alcohol and tobacco consumption were strongly associated with depression. For example, to escape from bad feelings, people with psychological problems may choose to drink alcohol or smoke as a coping strategy.77,78 Previous clinical reports have indicated that of people with major depressive disorder have alcohol use disorder.79 From a biological perspective, smoking could also lead to frequent nicotine withdrawal symptoms (including depression).80 The above effects may change the motivation for greenness usage, leading to a reduction in the protective association between depression and greenness. Our results also show that the protective effect of residential greenness was weaker for participants who used unclean household cooking fuels. The type of fuel could indirectly reflect exposure to pollutants, with people using unclean fuels being more likely to be exposed to high levels of air pollution.81,82 Air pollutants, such as fine particulate matter with aerodynamic diameter () and particulate matter with aerodynamic diameter (), could increase the risk of mental disorders by inducing inflammation and oxidative stress,83 which may have the potential to impair the protective effects of greenness on depression.84 In addition, poverty would make people face stronger budget constraints on energy use and choose to use cheaper unclean fuel.85 This suggests that cooking fuel may be on the pathway between poverty and depression.
We calculated the PF to quantify the disease burden of greenness-related depression, and these results can help us gain a clearer understanding of the health benefits provided by residential greenness. These results suggest that residential greenness has important public health significance and provides a basis for the development of specific recommended values for greenness exposure. The GBD 2019 study reported that the incidence of major depressive disorders in China for those 50 years of age and older in 2019 was ,86 and our findings suggest that people may be protected from depression by exposure to residential greenness. Our results also showed that there were geographic variations in the protective effects of greenness, with Jiangsu, Sichuan, and Guangdong Provinces receiving the greatest benefits from residential greenness. In contrast, greenness was less beneficial in Qinghai, Tibet, and Ningxia. Geographical differences in PF and AN may be related to different factors, such as population size, incidence rate, and greenness characteristics. Jiangsu, Sichuan, and Guangdong are China’s economically powerful provinces with larger population sizes and higher levels of urbanization. Greenness for entertainment is well developed in these provinces. In contrast, the regions of Qinghai, Tibet, and Ningxia are sparsely populated and mostly have undeveloped vegetation with lower urbanization values.
Overall, the results of this study have important public health implications. To maximize the health benefits of green environments, residential greenness factors should be incorporated into health policies and city and community building plans to build harmonious and low-carbon residential environments. At the population level, our findings suggest that controlling alcohol and tobacco consumption and increasing population welfare are effective ways to enhance the protective effects of greenness. It is necessary to raise awareness of the effects of green health among older adults and cultivate their subjective motivation to use green spaces. At the level of environmental settings, to address the unbalanced distribution of greenness levels in some subgroups (e.g., urban and rural) in China, promoting the rational distribution of living environments, developing greenness in urban and rural areas, and adopting better greenness utilization and management measures is required. For example, when planning an urban green space, the accessibility and ornamental nature of that green space should be considered, and the 3-30-300 rule should be met as much as possible (a recommendation for urban greenness, requires three trees to be visible from the home or working area, 30% tree canopy cover in the neighborhood, and from the public greenspace).87 Vertical green space can also be constructed according to different area characteristics to increase exposure to rate of residential greenness.
Strengths and Limitations of the Study
The SAGE is a prospective dynamic cohort study that explores health status within and across countries and has the following strengths: First, to the best of our knowledge, this is the first prospective cohort study to investigate the association between residential greenness and depression and to estimate the disease burden of depression attributed to greenness exposure across China. The advantage of a prospective cohort study is that it can reduce recall bias and obtain more accurate information. Moreover, cohort studies have an advantage in terms of causal inference and can better reveal objective causal associations. Second, we chose representative provinces in northern and southern China and a municipality and the study sites covered both rural and urban areas, allowing us to collect more comprehensive and representative information. Third, a baseline investigation and two follow-up investigations were conducted. The participants were screened before the investigation to ensure complete participation in the follow-up. Multistage stratified whole-group sampling was used to randomly select the participants, which increased the generalizability of the results.
This study has several limitations. First, depression was not directly diagnosed by clinicians, which may have led to a potential misclassification bias. Second, we used the satellite indicator (NDVI) to assess greenness exposure, which may not fully and accurately describe the quality of residential greenness (e.g., type of vegetation, accessibility of greenness, and greenness use). But NDVI has been widely used in measuring residential greenness and its validation has been verified.88 Third, only 190 participants (2.24%) were identified as depression patients, and only eight patients took medication. The limited number of patients with depression may be a major reason for nonsignificant associations and differences in some subgroups, although the direction of these associations was consistent with the association in the total population. Moreover, the small number of patients who took medication prevented us from investigating the potential modification effects of medication on the associations between NDVI and depression risk. Fourth, the high missing vegetable and fruit intake may have affected the accuracy of the model.89 However, the sensitivity analyses using participants with complete data showed that the results were robust to these variables.
In conclusion, this study provides longitudinal evidence of the protective effects of greenness on depression in older population. The protective effects of greenness may be more significant for urban residents, high-income participants, the southern population, nonsmokers, nondrinkers, and users of clean cooking fuels. We believe that a comprehensive understanding of the effects of greenness and its impacts could lead to better urban and rural land planning programs to ensure the health and well-being of future older populations in the face of accelerating global aging.
Supplementary Material
Acknowledgments
This work was supported by the National Natural Science Foundation of China (42075173, 42175181, 42275187, 42375180), the Foreign Expert Program of the Ministry of Science and Technology (G2022199006L), and the Natural Science Foundation of Guangdong Province of China (2024A1515012088).
The funders had no role in the study design, data collection and analysis, publication decisions, or manuscript preparation.
Conclusions and opinions are those of the individual authors and do not necessarily reflect the policies or views of EHP Publishing or the National Institute of Environmental Health Sciences.
References
- 1.Thapar A, Eyre O, Patel V, Brent D. 2022. Depression in young people. Lancet 400(10352):617–631, PMID: 35940184, 10.1016/S0140-6736(22)01012-1. [DOI] [PubMed] [Google Scholar]
- 2.Smith MV, Mazure CM. 2021. Mental health and wealth: depression, gender, poverty, and parenting. Annu Rev Clin Psychol 17:181–205, PMID: 33962537, 10.1146/annurev-clinpsy-071219-022710. [DOI] [PubMed] [Google Scholar]
- 3.COVID-19 Mental Disorders Collaborators. 2021. Global prevalence and burden of depressive and anxiety disorders in 204 countries and territories in 2020 due to the COVID-19 pandemic. Lancet 398(10312):1700–1712, PMID: 34634250, 10.1016/S0140-6736(21)02143-7. [DOI] [PMC free article] [PubMed] [Google Scholar]
- 4.Lu J, Xu X, Huang Y, Li T, Ma C, Xu G, et al. 2021. Prevalence of depressive disorders and treatment in China: a cross-sectional epidemiological study. Lancet Psychiatry 8(11):981–990, PMID: 34559991, 10.1016/S2215-0366(21)00251-0. [DOI] [PubMed] [Google Scholar]
- 5.Braw Y, Aviram S, Bloch Y, Levkovitz Y. 2011. The effect of age on frontal lobe related cognitive functions of unmedicated depressed patients. J Affect Disord 129(1–3):342–347, PMID: 20817307, 10.1016/j.jad.2010.07.032. [DOI] [PubMed] [Google Scholar]
- 6.Schüssler-Fiorenza Rose SM, Bott NT, Heinemeyer EE, Hantke NC, Gould CE, Hirst RB, et al. 2021. Depression, health comorbidities, cognitive symptoms and their functional impact: not just a geriatric problem. J Psychiatr Res 139:185–192, PMID: 34087515, 10.1016/j.jpsychires.2021.05.013. [DOI] [PMC free article] [PubMed] [Google Scholar]
- 7.Grover S, Sahoo S, Chakrabarti S, Avasthi A. 2019. Anxiety and somatic symptoms among elderly patients with depression. Asian J Psychiatr 41:66–72, PMID: 30054249, 10.1016/j.ajp.2018.07.009. [DOI] [PubMed] [Google Scholar]
- 8.Su D, Zhang X, He K, Chen Y. 2021. Use of machine learning approach to predict depression in the elderly in China: a longitudinal study. J Affect Disord 282:289–298, PMID: 33418381, 10.1016/j.jad.2020.12.160. [DOI] [PubMed] [Google Scholar]
- 9.Abdoli N, Salari N, Darvishi N, Jafarpour S, Solaymani M, Mohammadi M, et al. 2022. The global prevalence of major depressive disorder (MDD) among the elderly: a systematic review and meta-analysis. Neurosci Biobehav Rev 132:1067–1073, PMID: 34742925, 10.1016/j.neubiorev.2021.10.041. [DOI] [PubMed] [Google Scholar]
- 10.Jafari H, Ghasemi-Semeskandeh D, Goudarzian AH, Heidari T, Jafari-Koulaee A. 2021. Depression in the Iranian elderly: a systematic review and meta-analysis. J Aging Res 2021:9305624, PMID: 34434582, 10.1155/2021/9305624. [DOI] [PMC free article] [PubMed] [Google Scholar]
- 11.Kim SY, Bang M, Wee JH, Min C, Yoo DM, Han SM, et al. 2021. Short- and long-term exposure to air pollution and lack of sunlight are associated with an increased risk of depression: a nested case-control study using meteorological data and national sample cohort data. Sci Total Environ 757:143960, PMID: 33321334, 10.1016/j.scitotenv.2020.143960. [DOI] [PubMed] [Google Scholar]
- 12.Marazziti D, Cianconi P, Mucci F, Foresi L, Chiarantini I, Della Vecchia A. 2021. Climate change, environment pollution, COVID-19 pandemic and mental health. Sci Total Environ 773:145182, PMID: 33940721, 10.1016/j.scitotenv.2021.145182. [DOI] [PMC free article] [PubMed] [Google Scholar]
- 13.Xue T, Zhu T, Zheng Y, Zhang Q. 2019. Declines in mental health associated with air pollution and temperature variability in China. Nat Commun 10(1):2165, PMID: 31092825, 10.1038/s41467-019-10196-y. [DOI] [PMC free article] [PubMed] [Google Scholar]
- 14.Abraham Cottagiri S, Villeneuve PJ, Raina P, Griffith LE, Rainham D, Dales R, et al. 2022. Increased urban greenness associated with improved mental health among middle-aged and older adults of the Canadian Longitudinal Study on Aging (CLSA). Environ Res 206:112587, PMID: 34951990, 10.1016/j.envres.2021.112587. [DOI] [PubMed] [Google Scholar]
- 15.Zhou R, Zheng YJ, Yun JY, Wang HM. 2022. The effects of urban green space on depressive symptoms of mid-aged and elderly urban residents in China: evidence from the China health and retirement longitudinal study. Int J Environ Res Public Health 19(2):717, PMID: 35055539, 10.3390/ijerph19020717. [DOI] [PMC free article] [PubMed] [Google Scholar]
- 16.Sarkar C, Webster C, Gallacher J. 2018. Residential greenness and prevalence of major depressive disorders: a cross-sectional, observational, associational study of 94 879 adult UK Biobank participants. Lancet Planet Health 2(4):e162–e173, PMID: 29615217, 10.1016/S2542-5196(18)30051-2. [DOI] [PubMed] [Google Scholar]
- 17.Taylor L, Hochuli DF. 2017. Defining greenspace: multiple uses across multiple disciplines. Landsc Urban Plan 158:25–38, 10.1016/j.landurbplan.2016.09.024. [DOI] [Google Scholar]
- 18.Fossa AJ, D’Souza J, Bergmans R, Zivin K, Adar SD. 2024. Residential greenspace and major depression among older adults living in urban and suburban areas with different climates across the United States. Environ Res 243:117844, PMID: 38061587, 10.1016/j.envres.2023.117844. [DOI] [PMC free article] [PubMed] [Google Scholar]
- 19.Klein Y, Lindfors P, Osika W, Magnusson Hanson LL, Stenfors CUD. 2022. Residential greenspace is associated with lower levels of depressive and burnout symptoms, and higher levels of life satisfaction: a nationwide population-based study in Sweden. Int J Environ Res Public Health 19(9):5668, PMID: 35565069, 10.3390/ijerph19095668. [DOI] [PMC free article] [PubMed] [Google Scholar]
- 20.Tomita A, Vandormael AM, Cuadros D, Di Minin E, Heikinheimo V, Tanser F, et al. 2017. Green environment and incident depression in South Africa: a geospatial analysis and mental health implications in a resource-limited setting. Lancet Planet Health 1(4):e152–e162, PMID: 28890948, 10.1016/S2542-5196(17)30063-3. [DOI] [PMC free article] [PubMed] [Google Scholar]
- 21.He Q, Liu L, Zhang H, Chen R, Dong G, Yan LL, et al. 2023. Environmental greenspace, subjective well-being, and all-cause mortality in elderly Chinese: association and mediation study in a prospective cohort. Environ Res 227:115732, PMID: 36965791, 10.1016/j.envres.2023.115732. [DOI] [PubMed] [Google Scholar]
- 22.Perrino T, Lombard J, Rundek T, Wang K, Dong C, Gutierrez CM, et al. 2019. Neighbourhood greenness and depression among older adults. Br J Psychiatry 215(2):476–480, PMID: 31190652, 10.1192/bjp.2019.129. [DOI] [PubMed] [Google Scholar]
- 23.Pelgrims I, Devleesschauwer B, Guyot M, Keune H, Nawrot TS, Remmen R, et al. 2021. Association between urban environment and mental health in Brussels, Belgium. BMC Public Health 21(1):635, PMID: 33794817, 10.1186/s12889-021-10557-7. [DOI] [PMC free article] [PubMed] [Google Scholar]
- 24.Zhang X, Wei F, Yu Z, Guo F, Wang J, Jin M, et al. 2022. Association of residential greenness and incident depression: investigating the mediation and interaction effects of particulate matter. Sci Total Environ 811:152372, PMID: 34914979, 10.1016/j.scitotenv.2021.152372. [DOI] [PubMed] [Google Scholar]
- 25.Reuben A, Manczak EM, Cabrera LY, Alegria M, Bucher ML, Freeman EC, et al. 2022. The interplay of environmental exposures and mental health: setting an agenda. Environ Health Perspect 130(2):25001, PMID: 35171017, 10.1289/EHP9889. [DOI] [PMC free article] [PubMed] [Google Scholar]
- 26.Kowal P, Chatterji S, Naidoo N, Biritwum R, Fan W, Lopez Ridaura R, et al. 2012. Data resource profile: the World Health Organization Study on Global AGEing and Adult Health (SAGE). Int J Epidemiol 41(6):1639–1649, PMID: 23283715, 10.1093/ije/dys210. [DOI] [PMC free article] [PubMed] [Google Scholar]
- 27.Ji JS, Zhu A, Bai C, Wu CD, Yan L, Tang S, et al. 2019. Residential greenness and mortality in oldest-old women and men in China: a longitudinal cohort study. Lancet Planet Health 3(1):e17–e25, PMID: 30654864, 10.1016/S2542-5196(18)30264-X. [DOI] [PMC free article] [PubMed] [Google Scholar]
- 28.Martinez AI, Labib SM. 2023. Demystifying normalized difference vegetation index (NDVI) for greenness exposure assessments and policy interventions in urban greening. Environ Res 220:115155, PMID: 36584843, 10.1016/j.envres.2022.115155. [DOI] [PubMed] [Google Scholar]
- 29.Yang J, Dong J, Xiao X, Dai J, Wu C, Xia J, et al. 2019. Divergent shifts in peak photosynthesis timing of temperate and alpine grasslands in China. Remote Sensing of Environment 233:111395, 10.1016/j.rse.2019.111395. [DOI] [Google Scholar]
- 30.Dong JW, Zhou Y, You N, Cheng C. 2021. Data from: A 30-m Annual Maximum NDVI Dataset in China from 2000 to 2022. Beijing China: National Science and Technology Infrastructure. 10.12199/nesdc.ecodb.rs.2021.012 [accessed 5 December 2023]. [DOI] [Google Scholar]
- 31.Zhang YD, Fan SJ, Zhang Z, Li JX, Liu XX, Hu LX, et al. 2023. Association between residential greenness and human microbiota: evidence from multiple countries. Environ Health Perspect 131(8):87010, PMID: 37585351, 10.1289/EHP12186. [DOI] [PMC free article] [PubMed] [Google Scholar]
- 32.Fuertes E, Markevych I, Thomas R, Boyd A, Granell R, Mahmoud O, et al. 2020. Residential greenspace and lung function up to 24 years of age: the ALSPAC birth cohort. Environ Int 140:105749, PMID: 32380303, 10.1016/j.envint.2020.105749. [DOI] [PubMed] [Google Scholar]
- 33.Fan J, Guo Y, Cao Z, Cong S, Wang N, Lin H, et al. 2020. Neighborhood greenness associated with chronic obstructive pulmonary disease: a nationwide cross-sectional study in China. Environ Int 144:106042, PMID: 32827808, 10.1016/j.envint.2020.106042. [DOI] [PubMed] [Google Scholar]
- 34.Kessler RC, Ustün TB. 2004. The world mental health (WMH) survey initiative version of the World Health Organization (WHO) composite international diagnostic interview (CIDI). Int J Methods Psychiatr Res 13(2):93–121, PMID: 15297906, 10.1002/mpr.168. [DOI] [PMC free article] [PubMed] [Google Scholar]
- 35.Domenech-Abella J, Lara E, Rubio-Valera M, Olaya B, Moneta MV, Rico-Uribe LA, et al. 2017. Loneliness and depression in the elderly: the role of social network. Soc Psychiatry Psychiatr Epidemiol 52(4):381–390, PMID: 28154893, 10.1007/s00127-017-1339-3. [DOI] [PubMed] [Google Scholar]
- 36.Lu J, Huang YQ, Liu ZR, Cao XL. 2015. Validity of Chinese version of the composite international diagnostic interview-3.0 in psychiatric settings. Chin Med J (Engl) 128(18):2462–2466, PMID: 26365963, 10.4103/0366-6999.164930. [DOI] [PMC free article] [PubMed] [Google Scholar]
- 37.Haro JM, Arbabzadeh-Bouchez S, Brugha TS, de Girolamo G, Guyer ME, Jin R, et al. 2006. Concordance of the composite international diagnostic interview version 3.0 (CIDI 3.0) with standardized clinical assessments in the WHO world mental health surveys. Int J Methods Psychiatr Res 15(4):167–180, PMID: 17266013, 10.1002/mpr.196. [DOI] [PMC free article] [PubMed] [Google Scholar]
- 38.Arokiasamy P, Uttamacharya U, Jain K, Biritwum RB, Yawson AE, Wu F, et al. 2015. The impact of multimorbidity on adult physical and mental health in low- and middle-income countries: what does the Study on Global Ageing and Adult Health (SAGE) reveal? BMC Med 13:178, PMID: 26239481, 10.1186/s12916-015-0402-8. [DOI] [PMC free article] [PubMed] [Google Scholar]
- 39.Huo X, Khera R, Zhang L, Herrin J, Bai X, Wang Q, et al. 2019. Education level and outcomes after acute myocardial infarction in China. Heart 105(12):946–952, PMID: 30661037, 10.1136/heartjnl-2018-313752. [DOI] [PMC free article] [PubMed] [Google Scholar]
- 40.Wang W, Tian P, Zhang J, Agathokleous E, Xiao L, Koike T, et al. 2022. Big data-based urban greenness in Chinese megalopolises and possible contribution to air quality control. Sci Total Environ 824:153834, PMID: 35157858, 10.1016/j.scitotenv.2022.153834. [DOI] [PubMed] [Google Scholar]
- 41.Di N, Li S, Xiang H, Xie Y, Mao Z, Hou J, et al. 2020. Associations of residential greenness with depression and anxiety in rural Chinese adults. Innovation (Camb) 1(3):100054, PMID: 34557719, 10.1016/j.xinn.2020.100054. [DOI] [PMC free article] [PubMed] [Google Scholar]
- 42.de Keijzer C, Tonne C, Sabia S, Basagana X, Valentin A, Singh-Manoux A, et al. 2019. Green and blue spaces and physical functioning in older adults: longitudinal analyses of the Whitehall II study. Environ Int 122:346–356, PMID: 30503316, 10.1016/j.envint.2018.11.046. [DOI] [PMC free article] [PubMed] [Google Scholar]
- 43.Zhang X, Yan G, Feng Q, Razzaq A, Abbas A. 2022. Ecological sustainability and households’ wellbeing: linking households’ non-traditional fuel choices with reduced depression in rural China. Int J Environ Res Public Health 19(23):15639, PMID: 36497713, 10.3390/ijerph192315639. [DOI] [PMC free article] [PubMed] [Google Scholar]
- 44.Zhang T, Huang B, Yan Y, Lin Y, Wong H, Wong SY-S, et al. 2023. Associations of residential greenness with unhealthy consumption behaviors: evidence from high-density Hong Kong using street-view and conventional exposure metrics. Int J Hyg Environ Health 249:114145, PMID: 36848736, 10.1016/j.ijheh.2023.114145. [DOI] [PubMed] [Google Scholar]
- 45.Lin H, Guo Y, Di Q, Zheng Y, Xian H, Li X, et al. 2018. Consumption of fruit and vegetables might mitigate the adverse effects of ambient PM2.5 on lung function among adults. Environ Res 160:77–82, PMID: 28963967, 10.1016/j.envres.2017.09.007. [DOI] [PubMed] [Google Scholar]
- 46.Wu F, Guo Y, Chatterji S, Zheng Y, Naidoo N, Jiang Y, et al. 2015. Common risk factors for chronic non-communicable diseases among older adults in China, Ghana, Mexico, India, Russia and South Africa: the Study on Global AGEing and Adult Health (SAGE) wave 1. BMC Public Health 15:88, PMID: 25885218, 10.1186/s12889-015-1407-0. [DOI] [PMC free article] [PubMed] [Google Scholar]
- 47.Liu Y, Geng T, Wan Z, Lu Q, Zhang X, Qiu Z, et al. 2022. Associations of serum folate and vitamin B12 levels with cardiovascular disease mortality among patients with type 2 diabetes. JAMA Netw Open 5(1):e2146124, PMID: 35099545, 10.1001/jamanetworkopen.2021.46124. [DOI] [PMC free article] [PubMed] [Google Scholar]
- 48.Schenker N, Gentleman JF. 2001. On judging the significance of differences by examining the overlap between confidence intervals. Am Stat 55(3):182–186, 10.1198/000313001317097960. [DOI] [Google Scholar]
- 49.Thacher JD, Poulsen AH, Hvidtfeldt UA, Raaschou-Nielsen O, Brandt J, Geels C, et al. 2021. Long-term exposure to transportation noise and risk for type 2 diabetes in a nationwide cohort study from Denmark. Environ Health Perspect 129(12):127003, PMID: 34855467, 10.1289/EHP9146. [DOI] [PMC free article] [PubMed] [Google Scholar]
- 50.Hansen MS, Licaj I, Braaten T, Lund E, Gram IT. 2021. The fraction of lung cancer attributable to smoking in the Norwegian Women and Cancer (NOWAC) study. Br J Cancer 124(3):658–662, PMID: 33106583, 10.1038/s41416-020-01131-w. [DOI] [PMC free article] [PubMed] [Google Scholar]
- 51.Lee M, Whitsel E, Avery C, Hughes TM, Griswold ME, Sedaghat S, et al. 2022. Variation in population attributable fraction of dementia associated with potentially modifiable risk factors by race and ethnicity in the US. JAMA Netw Open 5(7):e2219672, PMID: 35793088, 10.1001/jamanetworkopen.2022.19672. [DOI] [PMC free article] [PubMed] [Google Scholar]
- 52.Laaksonen MA. 2010. Population Attributable Fraction (PAF) in epidemiologic follow-up studies. Helsinki, Finland: National Institute of Health and Welfare. [Google Scholar]
- 53.United Nations, Department of Economic and Social Affairs, Population Division. 2022. World Population Prospects 2022: Summary of Results. UN DESA/POP/2022/TR/NO. 3. New York, NY: United Nations. [Google Scholar]
- 54.National Bureau of Statistics. 2021. The Seventh National Population Census of the People’s Republic of China. Beijing, China: National Bureau of Statistics. [Google Scholar]
- 55.Textor J, van der Zander B, Gilthorpe MS, Liskiewicz M, Ellison GT. 2016. Robust causal inference using directed acyclic graphs: the R package ’dagitty’. Int J Epidemiol 45(6):1887–1894, PMID: 28089956, 10.1093/ije/dyw341. [DOI] [PubMed] [Google Scholar]
- 56.Generaal E, Hoogendijk EO, Stam M, Henke CE, Rutters F, Oosterman M, et al. 2019. Neighbourhood characteristics and prevalence and severity of depression: pooled analysis of eight Dutch cohort studies. Br J Psychiatry 215(2):468–475, PMID: 31057126, 10.1192/bjp.2019.100. [DOI] [PMC free article] [PubMed] [Google Scholar]
- 57.Gonzales-Inca C, Pentti J, Stenholm S, Suominen S, Vahtera J, Käyhkö N. 2022. Residential greenness and risks of depression: longitudinal associations with different greenness indicators and spatial scales in a Finnish population cohort. Health Place 74:102760, PMID: 35134742, 10.1016/j.healthplace.2022.102760. [DOI] [PubMed] [Google Scholar]
- 58.Gascon M, Sanchez-Benavides G, Dadvand P, Martinez D, Gramunt N, Gotsens X, et al. 2018. Long-term exposure to residential green and blue spaces and anxiety and depression in adults: a cross-sectional study. Environ Res 162:231–239, PMID: 29358115, 10.1016/j.envres.2018.01.012. [DOI] [PubMed] [Google Scholar]
- 59.Yu K, Zhang Q, Meng X, Zhang L, Kan H, Chen R. 2023. Association of residential greenness with incident chronic obstructive pulmonary disease: a prospective cohort study in the UK biobank. Environ Int 171:107654, PMID: 36462434, 10.1016/j.envint.2022.107654. [DOI] [PubMed] [Google Scholar]
- 60.Li X, Zhang C, Li W, Ricard R, Meng Q, Zhang W. 2015. Assessing street-level urban greenery using google street view and a modified green view index. Urban For Urban Green 14(3):675–685, 10.1016/j.ufug.2015.06.006. [DOI] [Google Scholar]
- 61.Xie Y, He W, Zhang X, Cui J, Tian X, Chen J, et al. 2021. Association of air pollution and greenness with carotid plaque: a prospective cohort study in China. Environ Pollut 273:116514, PMID: 33486240, 10.1016/j.envpol.2021.116514. [DOI] [PubMed] [Google Scholar]
- 62.Yang BY, Markevych I, Bloom MS, Heinrich J, Guo Y, Morawska L, et al. 2019. Community greenness, blood pressure, and hypertension in urban dwellers: the 33 communities Chinese health study. Environ Int 126:727–734, PMID: 30878868, 10.1016/j.envint.2019.02.068. [DOI] [PubMed] [Google Scholar]
- 63.Wang R, Feng Z, Pearce J, Liu Y, Dong G. 2021. Are greenspace quantity and quality associated with mental health through different mechanisms in Guangzhou, China: a comparison study using street view data. Environ Pollut 290:117976, PMID: 34428703, 10.1016/j.envpol.2021.117976. [DOI] [PubMed] [Google Scholar]
- 64.Markevych I, Schoierer J, Hartig T, Chudnovsky A, Hystad P, Dzhambov AM, et al. 2017. Exploring pathways linking greenspace to health: theoretical and methodological guidance. Environ Res 158:301–317, PMID: 28672128, 10.1016/j.envres.2017.06.028. [DOI] [PubMed] [Google Scholar]
- 65.Ohrnberger J, Fichera E, Sutton M. 2017. The relationship between physical and mental health: a mediation analysis. Soc Sci Med 195:42–49, PMID: 29132081, 10.1016/j.socscimed.2017.11.008. [DOI] [PubMed] [Google Scholar]
- 66.Squillacioti G, Carsin AE, Bellisario V, Bono R, Garcia-Aymerich J. 2022. Multisite greenness exposure and oxidative stress in children. The potential mediating role of physical activity. Environ Res 209:112857, PMID: 35114143, 10.1016/j.envres.2022.112857. [DOI] [PubMed] [Google Scholar]
- 67.Selway CA, Mills JG, Weinstein P, Skelly C, Yadav S, Lowe A, et al. 2020. Transfer of environmental microbes to the skin and respiratory tract of humans after urban green space exposure. Environ Int 145:106084, PMID: 32977191, 10.1016/j.envint.2020.106084. [DOI] [PubMed] [Google Scholar]
- 68.Iungman T, Cirach M, Marando F, Pereira Barboza E, Khomenko S, Masselot P, et al. 2023. Cooling cities through urban green infrastructure: a health impact assessment of European cities. Lancet 401(10376):577–589, PMID: 36736334, 10.1016/S0140-6736(22)02585-5. [DOI] [PubMed] [Google Scholar]
- 69.Li T, Yu Z, Xu L, Wu Y, Yu L, Yang Z, et al. 2022. Residential greenness, air pollution, and incident ischemic heart disease: a prospective cohort study in China. Sci Total Environ 838(pt 1):155881, PMID: 35569653, 10.1016/j.scitotenv.2022.155881. [DOI] [PubMed] [Google Scholar]
- 70.Mueller W, Steinle S, Parkka J, Parmes E, Liedes H, Kuijpers E, et al. 2020. Urban greenspace and the indoor environment: pathways to health via indoor particulate matter, noise, and road noise annoyance. Environ Res 180:108850, PMID: 31670081, 10.1016/j.envres.2019.108850. [DOI] [PubMed] [Google Scholar]
- 71.Asri AK, Tsai HJ, Pan WC, Guo YL, Yu CP, Wu CS, et al. 2022. Exploring the potential relationship between global greenness and DALY loss due to depressive disorders. Front Psychiatry 13:919892, PMID: 35836657, 10.3389/fpsyt.2022.919892. [DOI] [PMC free article] [PubMed] [Google Scholar]
- 72.Liu Y, Wang R, Xiao Y, Huang B, Chen H, Li Z. 2019. Exploring the linkage between greenness exposure and depression among Chinese people: mediating roles of physical activity, stress and social cohesion and moderating role of urbanicity. Health Place 58:102168, PMID: 31325813, 10.1016/j.healthplace.2019.102168. [DOI] [PubMed] [Google Scholar]
- 73.Huang B, Huang C, Feng Z, Pearce JR, Zhao H, Pan Z, et al. 2021. Association between residential greenness and general health among older adults in rural and urban areas in China. Urban For Urban Green 59:126907, 10.1016/j.ufug.2020.126907. [DOI] [Google Scholar]
- 74.Wang Q, Duoji Z, Feng C, Fei T, Ma H, Wang S, et al. 2022. Associations and pathways between residential greenness and hyperuricemia among adults in rural and urban China. Environ Res 215(pt 2):114406, PMID: 36152883, 10.1016/j.envres.2022.114406. [DOI] [PubMed] [Google Scholar]
- 75.Wang R, Liu Y, Xue D, Helbich M. 2019. Depressive symptoms among Chinese residents: how are the natural, built, and social environments correlated? BMC Public Health 19(1):887, PMID: 31277619, 10.1186/s12889-019-7171-9. [DOI] [PMC free article] [PubMed] [Google Scholar]
- 76.Ministry of Ecology and Environment of the People’s Republic of China. 2013. Exposure Factors Handbook of Chinese Population (Adults). Beijing, China: China Environmental Science Press. [Google Scholar]
- 77.Chow MSC, Poon SHL, Lui KL, Chan CCY, Lam WWT. 2021. Alcohol consumption and depression among university students and their perception of alcohol use. East Asian Arch Psychiatry 31(4):87–96, PMID: 34987119, 10.12809/eaap20108. [DOI] [PubMed] [Google Scholar]
- 78.Wootton RE, Richmond RC, Stuijfzand BG, Lawn RB, Sallis HM, Taylor GMJ, et al. 2019. Evidence for causal effects of lifetime smoking on risk for depression and schizophrenia: a mendelian randomisation study. Psychol Med 50(14):2435–2443, PMID: 31689377, 10.1017/S0033291719002678. [DOI] [PMC free article] [PubMed] [Google Scholar]
- 79.Lee JS, Lee SB, Kim DW, Shin N, Jeong SJ, Yang CH, et al. 2021. Social isolation-related depression accelerates ethanol intake via microglia-derived neuroinflammation. Sci Adv 7(45):eabj3400, PMID: 34739315, 10.1126/sciadv.abj3400. [DOI] [PMC free article] [PubMed] [Google Scholar]
- 80.Taylor GMJ, Lindson N, Farley A, Leinberger-Jabari A, Sawyer K, Te Water Naudé R, et al. 2021. Smoking cessation for improving mental health. Cochrane Database Syst Rev 3(3):CD013522, PMID: 33687070, 10.1002/14651858.CD013522.pub2. [DOI] [PMC free article] [PubMed] [Google Scholar]
- 81.Deng Y, Zhao H, Liu Y, Liu H, Shi J, Zhao C, et al. 2022. Association of using biomass fuel for cooking with depression and anxiety symptoms in older Chinese adults. Sci Total Environ 811:152256, PMID: 34896507, 10.1016/j.scitotenv.2021.152256. [DOI] [PubMed] [Google Scholar]
- 82.Li X, Guo Y, Xiao J, Liu T, Zeng W, Hu J, et al. 2022. The effect of polluting cooking fuels on depression among older adults in six low- and middle-income countries. Sci Total Environ 838(pt 2):155690, PMID: 35533871, 10.1016/j.scitotenv.2022.155690. [DOI] [PubMed] [Google Scholar]
- 83.Hahad O, Lelieveld J, Birklein F, Lieb K, Daiber A, Munzel T. 2020. Ambient air pollution increases the risk of cerebrovascular and neuropsychiatric disorders through induction of inflammation and oxidative stress. Int J Mol Sci 21(12):4306, PMID: 32560306, 10.3390/ijms21124306. [DOI] [PMC free article] [PubMed] [Google Scholar]
- 84.Wei F, Yu Z, Zhang X, Wu M, Wang J, Shui L, et al. 2022. Long-term exposure to ambient air pollution and incidence of depression: a population-based cohort study in China. Sci Total Environ 804:149986, PMID: 34798713, 10.1016/j.scitotenv.2021.149986. [DOI] [PubMed] [Google Scholar]
- 85.Li C, Xia Y, Wang L. 2024. Household unclean fuel use, indoor pollution and self-rated health: risk assessment of environmental pollution caused by energy poverty from a public health perspective. Environ Sci Pollut Res Int 31(12):18030–18053, PMID: 37217815, 10.1007/s11356-023-27676-w. [DOI] [PubMed] [Google Scholar]
- 86.GBD 2019 Mental Disorders Collaborators. 2022. Global, regional, and national burden of 12 mental disorders in 204 countries and territories, 1990–2019: a systematic analysis for the global burden of disease study 2019. Lancet Psychiatry 9(2):137–150, PMID: 35026139, 10.1016/S2215-0366(21)00395-3. [DOI] [PMC free article] [PubMed] [Google Scholar]
- 87.Konijnendijk CC. 2023. Evidence-based guidelines for greener, healthier, more resilient neighbourhoods: introducing the 3-30-300 rule. J For Res (Harbin) 34(3):821–830, PMID: 36042873, 10.1007/s11676-022-01523-z. [DOI] [PMC free article] [PubMed] [Google Scholar]
- 88.Rhew IC, Vander Stoep A, Kearney A, Smith NL, Dunbar MD. 2011. Validation of the normalized difference vegetation index as a measure of neighborhood greenness. Ann Epidemiol 21(12):946–952, PMID: 21982129, 10.1016/j.annepidem.2011.09.001. [DOI] [PMC free article] [PubMed] [Google Scholar]
- 89.Oftedal S, Kolt GS, Holliday EG, Stamatakis E, Vandelanotte C, Brown WJ, et al. 2019. Associations of health-behavior patterns, mental health and self-rated health. Prev Med 118:295–303, PMID: 30476503, 10.1016/j.ypmed.2018.11.017. [DOI] [PubMed] [Google Scholar]
Associated Data
This section collects any data citations, data availability statements, or supplementary materials included in this article.