

Abstract
Introduction:
Genetic ancestry (GA) refers to population hereditary patterns that contribute to phenotypic differences seen among race/ethnicity groups, and differences among GA groups may highlight unique biological determinants that add to our understanding of health care disparities.
Methods:
A retrospective review of patients with renal cell carcinoma (RCC) was performed and correlated GA with clinicopathologic, somatic, and germline molecular data. All patients underwent next-generation sequencing of normal and tumor DNA using Memorial Sloan Kettering-Integrated Mutation Profiling of Actionable Cancer Targets, and contribution of African (AFR), East Asian (EAS), European (EUR), Native American, and South Asian (SAS) ancestry was inferred through supervised ADMIXTURE. Molecular data was compared across GA groups by Fisher exact test and Kruskal–Wallis test.
Results:
In 953 patients with RCC, the GA distribution was: EUR (78%), AFR (4.9%), EAS (2.5%), SAS (2%), Native American (0.2%), and Admixed (12.2%). GA distribution varied by tumor histology and international metastatic RCC database consortium disease risk status (intermediate-poor: EUR 58%, AFR 88%, EAS 74%, and SAS 73%). Pathogenic/likely pathogenic germline variants in cancer-predisposition genes varied (16% EUR, 23% AFR, 8% EAS, and 0% SAS), and most occurred in CHEK2 in EUR (3.1%) and FH in AFR (15.4%). In patients with clear cell RCC, somatic alteration incidence varied with significant enrichment in BAP1 alterations (EUR 17%, AFR 50%, SAS 29%; p = .01). Comparing AFR and EUR groups within The Cancer Genome Atlas, significant differences were identified in angiogenesis and inflammatory pathways.
Conclusion:
Differences in clinical and molecular data by GA highlight population-specific variations in patients with RCC. Exploration of both genetic and nongenetic variables remains critical to optimize efforts to overcome health-related disparities.
Keywords: genomic ancestry, kidney cancer, renal cell carcinoma
INTRODUCTION
Health disparities for patients with kidney cancer have been a long-standing challenge for optimizing care.1 Although these gaps have improved,2,3 race and ethnic groups differ in their distribution of disease presentation and cancer-specific outcomes.4–7 For instance, Black patients are more likely to have non–clear cell renal cell carcinoma (nccRCC) histologies, tend to present with worse international metastatic RCC database consortium (IMDC) risk status, and are at risk for worse clinical outcomes compared with White patients.6,7 In addition to socioeconomic factors and comorbidities, which are relevant contributors to such differences, evaluating underlying genetic determinants such as genetic ancestry may uncover novel associations with disease biology8 and may offer insights into other variations across specific patient populations.
Genetic ancestry (GA) refers to an individual’s genetic origin and incorporates the admixture result from genetic exchange across different ancestral groups. Recent studies have focused on identifying differences by GA within clear cell RCC (ccRCC) and other nccRCC histologies.9,10 In the ccRCC (KIRC) cohort of The Cancer Genome Atlas (TCGA), African (AFR) ancestry individuals had a significantly lower frequency of the two most commonly altered RCC-associated genes, VHL and PBRM1, and were less likely to harbor chromosome 3p loss, compared with European (EUR) ancestry patients.9 Germline studies also indicate enrichment for specific alterations, namely a higher frequency of germline mutations in CHEK2 in EUR patients versus FH in AFR patients.10 These studies highlight differences in tumor biology, with downstream implications for clinical phenotypes, cancer-specific outcomes, and, potentially, drug development.
Beyond recognizing health care disparities as relevant drivers in different outcomes, key knowledge gaps remain in contextualizing variations in GA data for patients with RCC further. First, prior studies used a limited matched clinical data set and do not significantly include nccRCC entities, which may frequently arise among minority groups. Second, there is a paucity of GA data as it applies to non-EUR minority groups, and it is unknown whether similar correlations can be drawn for all GA groups. Last, analyzing GA with matched molecular data, including germline, somatic, and transcriptomic data, remains limited. To address this, we performed a large GA analysis across all RCC histologies and correlated clinical, histologic, and molecular data across population groups.
MATERIALS AND METHODS
Patient cohort
This research was conducted under an institutional review board–approved retrospective protocol. All patients had histologically confirmed RCC per review at Memorial Sloan Kettering Cancer Center (MSK). All individuals had been offered somatic and germline testing in the RCC clinic at MSK in the context of varying clinical scenarios, and all had subsequently consented to institutional next-generation sequencing (NGS).11 Clinical records were reviewed for variables including self-reported race and ethnicity, demographics, clinicopathologic, treatment history, and survival status. IMDC risk status was computed at the start of first-line therapy with available clinical data. Self-reported race was classified as White, Black or African American, Asian/Indian Subcontinent, Native American/American Indian/Alaskan, Native Hawaiian or Pacific Islander, Black Hispanic, White Hispanic, or unknown/declined to answer.
Somatic and germline molecular profiling
All patients included in this analysis had undergone MSK-Integrated Mutation Profiling of Actionable Cancer Targets (MSK-IMPACT) testing, which included collection of a matched normal peripheral blood sample and NGS profiling of tumor tissue (including primary and metastatic tumor tissues, pre- and on-treatment tissue acquisition) across at least 410 genes of interest, as previously described.11 Separately, DNA from matched normal samples was used to investigate germline alterations across specified genes of interest and those designated as likely pathogenic/pathogenic were included for analysis. Furthermore, germline data were used to pursue GA classification (described in the following section). Because the MSK-IMPACT panel additionally captures human leukocyte antigen (HLA) class I allele reads (HLA-A, HLA-B, and HLA-C), HLA class I allele status was inferred from matched germline DNA. Prior investigation has shown high concordance (>95%) of HLA class I allele inference with directed genotyping.12 HLA evolutionary divergence (HED) was calculated for each patient, with an HED value computed at each class I locus and a composite HED value as the mean of all loci HED values, as previously described.12
Genetic ancestry classification
GA was inferred for each patient using biallelic autosomal single-nucleotide polymorphism markers from the 1000 Genomes Project, with a minor allele frequency >1% and within MSK-IMPACT 468 gene panel bait intervals, as previously described.13 Each patient was genotyped using these markers on the matched normal BAM files using GATK v4.0 Pileup, merged with the 1000 Genomes Project reference data, and then pruned with PLINK v.19 to restrict only markers that are in linkage equilibrium. We then performed supervised ADMIXTURE v.1.3 to estimate the proportions of AFR, EUR, East Asian (EAS), Native American (NAM), and South Asian (SAS) ancestry. Patients with >80% of a specific admixture proportion were assigned that GA as the majority classification; patients with <80% of a single admixed population were then classified as “Admixed.” For subsequent analyses within the TCGA, previously reported GA classifications were used with similar ancestral groupings as performed in the MSK cohort.9
TCGA RCC RNA-sequencing and immune infiltration deconvolution analyses
FASTQ files were downloaded from GDC and aligned against the hg19 assembly by STAR for clear cell (KIRC), papillary (KIRP), and chromophobe (KICH) cohorts from the TCGA. RNA-seq FPKM expression values were used and normalized for the analyses, and the ESTIMATE algorithm14 was used to assess the overall immune infiltration. Expression values were log2-transformed and expression values were converted into gene wise standardized values (Z scores).
Data analysis
Patient characteristics and genomic alterations (germline and somatic) were reported overall and by GA groups. Overall survival was estimated using the Kaplan–Meier method, with patients censored at date of last follow-up. Patient characteristics were compared between GA groups with the Fisher exact test for categorical variables and the Kruskal–Wallis test for continuous variables. Frequency of any somatic alteration and frequency of somatic alterations in the top 10 genes were compared between GA groups with the Fisher exact test. The Fisher exact test was calculated via Monte Carlo sampling to handle larger sample size and higher dimensionality of contingency tables. Statistical analyses were performed using SAS v.9.4 (Cary, North Carolina). All tests were considered statistically significant at p < .05.
RESULTS
Patient characteristics and self-reported race and genetic ancestry
In the cohort of 953 patients with RCC who underwent NGS sequencing between 2015 and 2021, the proportion of AFR, EUR, EAS, NAM, and SAS ancestries was estimated. EUR ancestry was the predominant population (78% of total cohort), and the remaining distribution included AFR (5%), EAS (3%), SAS (2%), NAM (<1%), and Admixed (12%) (Figure 1, Table S1). The breakdown across the patients categorized as “Admixed” is found in Figure S1. We next compared the distribution of self-reported race/ethnicity to GA estimates and found that self-reported race was concordant with GA classifications in 90% of patients (Table 1; Figure S2). A total of 113 patients self-reported “unknown” or “declined to answer,” but the majority was assigned into a defined GA population group. In subsequent analyses, we categorized patients by GA given more complete data and overall congruence with self-report. Given the low proportion (<1%) of NAM patients in our cohort, we excluded these patients from subsequent studies.
FIGURE 1.
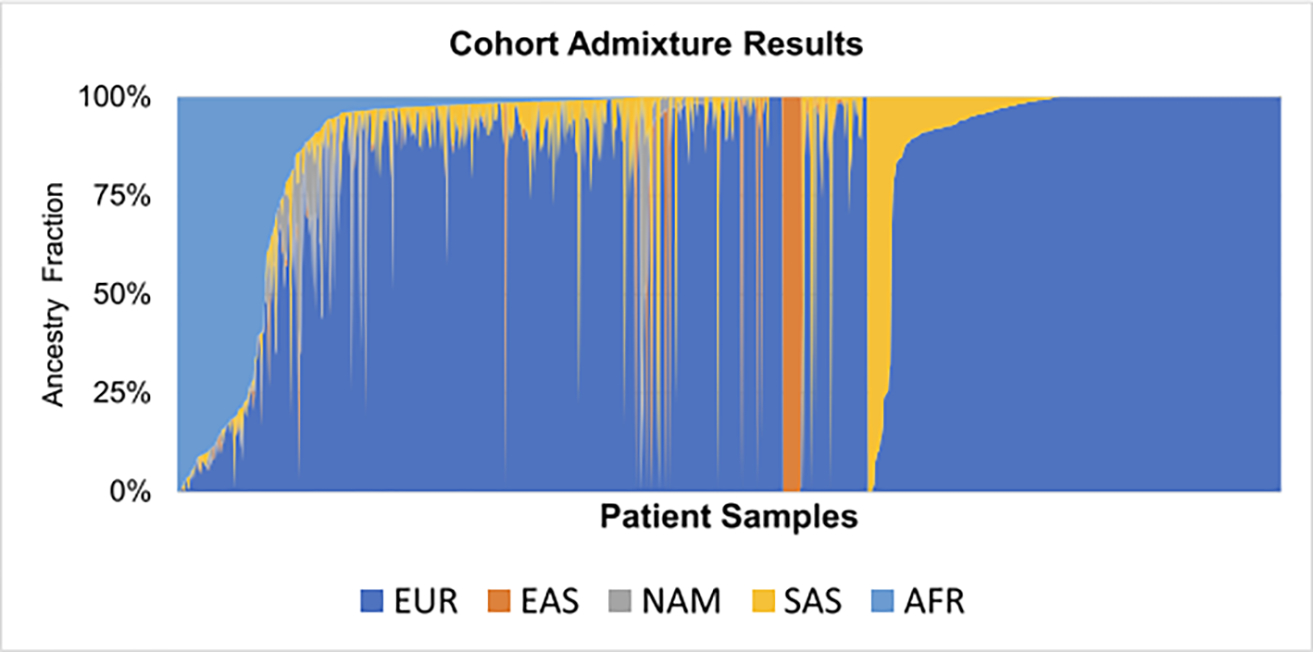
Cohort admixture results by ancestry. Individual patients are plotted according to genetic ancestry fraction, highlighting admixed populations within the cohort. AFR indicates African; EAS, East Asian; EUR, European; NAM, Native American; SAS, South Asian.
TABLE 1.
Patient and disease characteristics, overall and by genetic ancestry.
| Overall (n = 953) | European (n = 744) | African (n = 47) | East Asian (n = 24) | South Asian (n = 20) | Admixed (n = 116) | p a | |
|---|---|---|---|---|---|---|---|
|
| |||||||
| Age at diagnosis, median (range) | 56 (19–89) | 57 (19–89) | 51 (20–72) | 55 (32–71) | 58 (25–80) | 52 (21–79) | <.001 |
| Male sex | 671 (72%) | 539 (72%) | 27 (57%) | 16 (67%) | 14 (70%) | 73 (63%) | .09 |
| Self-reported race | <.001 | ||||||
| White | 738 (77%) | 681 (92%) | - | 1 (4%) | 1 (5%) | 54 (47%) | |
| Black | 55 (6%) | - | 39 (83%) | - | - | 16 (14%) | |
| Asian | 47 (5%) | - | - | 21 (88%) | 16 (80%) | 10 (9%) | |
| Unknown/refused | 113 (12%) | 63 (8%) | 8 (17%) | 2 (8%) | 3 (15%) | 36 (31%) | |
| BMI, median (range) | 28.0 (16.4-59.3) | 28.4 (16.4-59.3) | 27.4 (18.1-46.3) | 23.2 (17.4-34.2) | 23.4 (17.8-34.4) | 28.1 (17.0-49.0) | <.001 |
| Extent of disease at diagnosis | .36 | ||||||
| Localized | 648 (72%) | 476 (72%) | 24 (60%) | 11 (55%) | 12 (71%) | 76 (71%) | |
| Distant metastasis | 256 (28%) | 188 (28%) | 16 (40%) | 9 (45%) | 5 (29%) | 31 (29%) | |
| Unknown | 49 | 40 | 3 | 2 | 2 | 2 | |
| Grade | .42 | ||||||
| Low | 139 (21%) | 115 (21%) | 2 (8%) | 3 (19%) | 1 (7%) | 17 (24%) | |
| High | 534 (79%) | 422 (79%) | 23 (92%) | 13 (81%) | 13 (93%) | 54 (76%) | |
| Unknown | 280 | 167 | 18 | 6 | 5 | 38 | |
| Histologic type | <.001 | ||||||
| Clear cell | 570 (62%) | 477 (66%) | 12 (26%) | 15 (65%) | 14 (74%) | 50 (43%) | |
| Unclassified, no papillary features | 114 (12%) | 88 (12%) | 8 (17%) | 1 (4%) | 3 (16%) | 14 (12%) | |
| Papillaryb | 99 (11%) | 64 (9%) | 14 (30%) | 2 (9%) | - | 19 (17%) | |
| Chromophobe | 54 (6%) | 40 (6%) | 4 (9%) | 2 (9%) | 1 (5%) | 7 (6%) | |
| Unclassified, papillary features | 34 (4%) | 27 (4%) | 1 (2%) | - | 1 (5%) | 5 (4%) | |
| Medullary | 8 (1%) | - | 2 (4%) | - | - | 6 (5%) | |
| Otherc | 47 (5%) | 24 (3%) | 6 (13%) | 3 (13%) | - | 14 (12%) | |
| Unknown | 27 | 24 | - | 1 | 1 | 1 | |
| Sarcomatoid features | 115 (12%) | 91 (12%) | 4 (9%) | 2 (8%) | 3 (15%) | 15 (13%) | .93 |
| Metastatic disease | 683 (72%) | 536 (72%) | 32 (68%) | 19 (79%) | 15 (75%) | 80 (69%) | .81 |
| IMDC risk | .002 | ||||||
| Favorable | 195 (29%) | 164 (31%) | - | 3 (16%) | 2 (13%) | 25 (31%) | |
| Intermediate-poor | 412 (60%) | 311 (58%) | 28 (88%) | 14 (74%) | 11 (73%) | 48 (60%) | |
| Not evaluated | 76 (11%) | 61 (11%) | 4 (12%) | 2 (11%) | 2 (13%) | 7 (9%) | |
Abbreviations: BMI, body mass index; IMDC, international metastatic renal cell carcinoma database consortium.
Fisher exact test for categorical variables and Kruskal-Wallis test for continuous variables.
Includes papillary type I or II and fumurate hydratase (FH)-deficient.
Includes translocation associated, mucinous tubular and spindle cell, succinate dehydrogenase (SDH)-deficient, and collecting duct carcinoma.
Patient and disease characteristics by genomic ancestry
Patient cohort characteristics grouped by GA classification are displayed in Table 1. When comparing each GA subgroup to the overall cohort, differences in tumor histology and clinical presentation were observed. Notably, age, tumor histology and IMDC risk classification distribution varied significantly across groups (p < .005 for all; Table 1). AFR patients had ccRCC at a notably lower frequency (26%) than all other GA groups (43%–74%), conversely with enrichment of nccRCC histologies, including papillary (30% of AFR; 9%–11% in other GA groups) and other rare histologies, including translocation-associated, mucinous tubular spindle cell, collecting duct carcinoma, and overall higher grade disease. Consistent with prior reports of a correlation between AFR ancestry and renal medullary cancer,15 all patients with renal medullary cancer were classified to have either AFR or Admixed backgrounds within this cohort.
AFR and EAS patients had a higher frequency of distant metastasis at initial disease presentation (40% and 45%, respectively) compared with EUR patients (28%). AFR patients with metastatic disease were more commonly of IMDC intermediate-poor risk compared with the EUR subgroup (88% and 58%, respectively; 60% in total cohort). When comparing overall survival (OS) from the time of metastatic RCC diagnosis, median OS was inferior in AFR versus EUR patients (2.5 years [95% CI, 1.2–4.3) and 5.7 years (95% CI, 4.5–6.7), respectively) (Figure 2). This difference was less apparent when looking at ccRCC and nccRCC histologies separately, comparisons being limited by small numbers in the AFR group (Figure S3).
FIGURE 2.
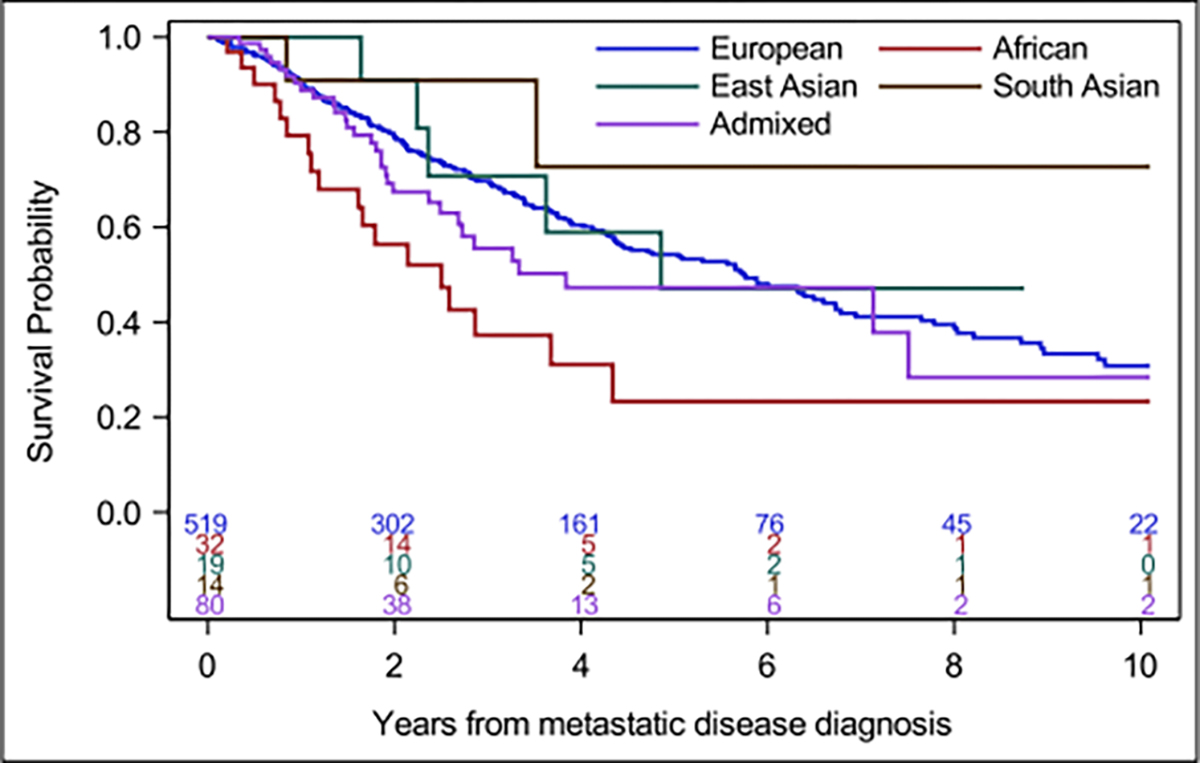
Overall survival (OS) in metastatic renal cell carcinoma by genetic ancestry (GA). Kaplan–Meier estimates of OS by ancestry groups. Median OS (years) for GA groups: 5.7 for European, 2.5 for African, 4.9 for East Asian, 3.8 Admixed, and not estimated for South Asian.
Somatic and germline alteration data by genomic ancestry
When comparing somatic NGS profiling across GA populations, we found no significant difference in tumor mutational burden or fraction of genome altered (Table S2). Focusing on ccRCC, the incidence of RCC-specific alterations varied among GA groups. AFR patients harbored lower frequency of VHL and PBRM1 alterations, but significantly more BAP1 mutations when compared with EUR, SAS, and EAS ccRCC populations (p = .01, Fisher exact test) (Table 2, Table S3). When restricting our analysis to nccRCC, we did not detect significant differences in the frequency of genomic alterations including those in NF2, MET, or MTOR (Table S4). We then assessed pathogenic/likely pathogenic germline alterations in cancer predisposition genes within each GA group (Table S5). We identified a high frequency of germline CHEK2 alterations in EUR patients (3.1%), as expected given known founder variants in the European population, and FH variants in AFR patients (15.4%), none of which was recurrent (Table S6). Interestingly, the rate of germline alterations was low in Asian patients (SAS subgroup with no pathogenic/likely pathogenic germline alterations in 20 patients), albeit with limited sample size (4% of SAS + EAS patients, cumulatively; 26 patients in total).
TABLE 2.
Top somatic alterations in clear cell renal cell carcinoma, overall and by genetic ancestry.
| Overall (n = 570) | European (n = 477) | African (n = 12) | East Asian (n = 15) | South Asian (n = 14) | Admixed (n = 50) | p a | |
|---|---|---|---|---|---|---|---|
|
| |||||||
| Any somatic alteration | 540 (95%) | 454 (95%) | 9 (75%) | 15 (100%) | 13 (93%) | 47 (94%) | .07 |
| Genea | |||||||
| VHL | 444 (77.9%) | 372 (78.0%) | 6 (50.0%) | 11 (73.3%) | 13 (92.9%) | 40 (80.0%) | .13 |
| PBRM1 | 259 (45.4%) | 216 (45.3%) | 2 (16.7%) | 8 (53.3%) | 4 (28.6%) | 28 (56.0%) | .08 |
| SETD2 | 154 (27.0%) | 132 (27.7%) | 2 (16.7%) | 4 (26.7%) | 1 (7.1%) | 14 (28.0%) | .50 |
| BAP1 | 98 (17.2%) | 79 (16.6%) | 6 (50.0%) | - | 4 (28.6%) | 8 (16.0%) | .01 |
| KDM5C | 73 (12.8%) | 63 (13.2%) | - | 4 (26.7%) | - | 6 (12.0%) | .19 |
| TP53 | 54 (9.5%) | 43 (9.0%) | - | 3 (20.0%) | 2 (14.3%) | 6 (12.0%) | .30 |
| TERT | 53 (9.3%) | 45 (9.4%) | 1 (8.3%) | 2 (13.3%) | 1 (7.1%) | 4 (8.0%) | .95 |
| MTOR | 49 (8.6%) | 40 (8.4%) | 2 (16.7%) | 2 (13.3%) | 1 (7.1%) | 4 (8.0%) | .61 |
Fisher exact test; 2 patients with Native American ancestry excluded from ancestry group analysis.
Because HLA repertoires are known to be inherited with varying patterns across specific ethnic and population groups, we studied whether HLA zygosity (for HLA-A, B, and C, and composite), and the degree of class I HED, a measure of breadth of antigen presentation capacity integrating HLA zygosity and the individual HLA allele repertoire,12 differed by GA. We found that the rate of HLA heterozygosity at each HLA class I locus was similar across GA groups, as was the rate of complete HLA heterozygosity across all HLA class I alleles. HED values at each HLA class I locus and the composite mean HED across all HLA class I loci were also comparable (Table S2).
Transcriptomic differences by genomic ancestry in TCGA
Prior research has shown that self-reported Black versus White patients harbor different patterns of gene activation, particularly more frequent clear cell–B signatures.16 Given work identifying the importance of angiogenesis and myeloid inflammatory signatures and associations with treatment outcomes,17–20 we investigated these transcriptomic features across GA subgroups. Given limited gene expression data in our cohort, we performed this analysis in the TCGA data sets for clear cell (KIRC), papillary (KIRP), and chromophobe cohorts (KICH).21 Using computed GA classifications,9 we used established bulk RNA deconvolution methods to characterize the cellular composition and activation states of elements in the tumor immune microenvironment and cancer-associated canonical and noncanonical signaling. To focus our analysis on the most enriched GA groups, we compared previously grouped AFR and EUR patients in the TCGA KIRC (Table S7, Figure 3) and found that clear cell RCC tumors from AFR patients had significantly lower immune infiltration scores and lower hypoxia inducible factor (HIF) scores than EUR patients (p < .05), and congruently displayed lower inflammatory response and hallmark angiogenesis signature expression (p < .05). For patients with papillary tumors, we did not detect significant differences when comparing AFR and EUR patients. We noted significant differences in KICH tumors between AFR and EUR patients, including differences in mTOR, glycolysis, and oxidative phosphorylation, which all point toward differences in tumor metabolism and may carry relevant implications for therapeutics such as mTOR inhibitors used in that tumor subtype22 (Figure S4A–B).
FIGURE 3.

Transcriptomic differences in AFR and EUR in KIRC patients. Gene set enrichment analysis (GSEA) of hallmark gene sets comparing AFR and EUR patients from The Cancer Genome Atlas KIRC cohort using the log2mean method. Red represents overexpression and blue represents decreased expression. AFR patients had significantly lower immune infiltration and lower HIF scores compared with EUR. AFR indicates African; EUR, European; HIF, hypoxia inducible factor.
DISCUSSION
Genetic ancestry as a composite classification reflecting the admixture of ancestral genetic contributions in an individual has been increasingly informative to capture biological variations between population groups. Although applying GA to investigate clinical questions may be confounded by social and economic disparities across race and ethnicity,8 studying GA arguably provides an additional lens to recognize genetic contributions to clinical, histopathologic, and molecular differences. To our knowledge, this is the largest reported cohort with matched annotated clinical, germline, and somatic data in patients with ccRCC and nccRCC and GA characterization. We also present our findings in the context of interrogating GA differences with transcriptomic data, highlighting how these associations may have functional consequences.
Although there remains a high concordance rate between self-reported race/ethnicity and GA classification within our study, we successfully reclassified 12% of patients into GA groups who otherwise would have been considered unknown or excluded from analyses. This reclassification notably increased representation in all GA groups, including non-EUR individuals, and highlights how GA studies can increase minority representation within larger data sets with incomplete data. Using the GA groups for subsequent studies, we identified differences with respect to the frequency of tumor histology and tumor presentation, including poorer risk disease. These results are in line with efforts analyzing the IMDC database, which has shown that Black patients had worse IMDC risk and inferior outcomes compared with White patients.23 We identified here that AFR ancestry patients indeed had higher IMDC risk status with uniquely no IMDC favorable patients in our cohort. Although we analyzed OS by GA and identified that AFR patients had inferior outcomes when compared with EUR patients, this effect lessened when separating ccRCC and nccRCC histologies, in which outcomes have previously been shown to be disparate, possibly related to limited sample size.
Given histology differences that appeared enriched within GA groups, we subsequently performed germline and somatic data analyses by ccRCC and nccRCC. Consistent with prior reports,10,24 we detected germline alterations at the highest frequency in CHEK2 and FH. Unlike other reports of Asian patients that demonstrate a comparable frequency in germline alterations in patients with RCC,25,26 our rate of germline alterations in EAS (7%) and SAS (0%) was low. TCGA analyses have indicated a lower rate of somatic VHL and PBRM1 in AFR patients compared with EUR patients, with a continuous trend based on the size of GA fraction of these ancestries.9,27 In our ccRCC cohort, we similarly found a lower numeric frequency of VHL (50%) and PBRM1 (17%), yet identified a statistically significant enrichment of BAP1 (50% in AFR, 17% in EUR, 17% in the total cohort). With the limited sample size reported here, validating this finding in larger and more diverse data sets including all ethnicities is needed. This remains pertinent because BAP1 and PBRM1 alterations remain prognostic28 and potential biomarkers for immunotherapy,29 so contextualizing these patterns would be helpful. For instance, in the CheckMate-025 study, the randomized phase 3 registration trial of nivolumab versus everolimus in which clinical validation of PBRM1 was performed,29 only five self-reported Black patients were enrolled and only one was randomized to the nivolumab arm.30 Hence, analysis of other diverse cohorts is needed to confirm these findings.
Molecular signatures based on gene expression data have been shown to correlate with treatment responses,19,20 and given that different signatures have enrichment of PBRM1 and BAP1 tumors, we posited that corresponding variances in molecular signatures would exist across GA groups. Prior reports using self-reported racial data have shown lower gene expression rates related to vascular endothelial growth factor pathways, which may predict treatment-related outcomes.7,16,27 Given differences in somatic VHL across ancestry and limited transcriptomic data in this cohort, we interrogated the TCGA and applied contemporary immune deconvolution techniques to examine immune infiltration, metabolomic, and relevant myeloid and angiogenesis-related signatures. Given the paucity of minority representation within TCGA, we restricted analysis to KIRC tumors and AFR and EUR patients (the highest frequency of GA subgroups) and found lower immune infiltration, immune metabolomic gene signatures, and HIF scores. Although subgroup analyses of trials have relevantly shown comparable outcomes in non-EUR minority patients (e.g., Asian patients within the global population have previously reported similar treatment-related outcomes with agents including axitinib + pembrolizumab, axitinib31,32), these signature differences raise implications for disease pathogenesis and sensitivity to therapeutics targeting the angiogenesis/HIF axis and immune checkpoint blockade.
We also aimed to contextualize these data with proposed biomarkers within the field and contemporary treatment strategies. Although HLA zygosity has not been shown to correlate with immune checkpoint inhibitor (ICI) therapy outcomes in patients with RCC,33 HED has been shown to be associated with ICI and ICI plus antivascular endothelial growth factor therapy outcomes.34 Given different inheritance patterns of HLA alleles, we postulated whether HED could vary among GA groups but did not find a significant difference in HLA zygosity or HED.
With initiatives to reduce barriers and improve minority accrual in clinical trials, evaluating GA in the context of adaptive and biomarker designed studies can provide insights to confirm these signals. The BIONNIK trial, the first study to apply molecular stratification pretreatment, did not reveal self-reported race/ethnicity data.30 Ongoing studies such as PDIGREE (NCT03793166), in which sequential therapy is based on initial treatment response, and OPTIC-RCC (NCT05361720), in which treatment is assigned based on pretreatment molecular biomarkers, provide opportunities to study how GA distribution of treatment arms may change from initial assignment, thus supporting potential clinical associations with molecular phenotypes. Although global data have highlighted how access to contemporary therapies such as immunotherapies has improved RCC mortality,35 evaluating the impact of ancestry and molecular data is vital to closing health care gaps at the population level.
We note several limitations in our study. First, as with prior reports of GA and health disparities in RCC, our analysis is limited in representation and inclusion of minority populations, which limited formal comparison across all GA groups and generalizability of study findings. Second, there are known nonbiological factors that may confound disparities seen with health care outcomes. This was a single institutional study and inherently harbors referral and geographic biases that affect cohort diversity. Although there is no pattern or standardized criteria used to select patients for molecular profiling, referral patterns from the community, particularly enrichment for treatment-refractory disease or rarer tumor subtypes impact our cohort diversity and heterogeneity, which may have had impact on the identified patterns reported here. Last, recent GA study efforts have called to recalibrate data based on increasing minority reference genome comparisons,36 and whereas we used somatic/germline and reference genome data, methods that incorporate further reference genomic material for calculating genetic admixture may further elucidate these findings.
CONCLUSIONS
In sum, recognizing population differences is crucial to optimizing care delivery and outcomes. In parallel to efforts aimed to overcome social and economic barriers affecting our patients, there remains high interest to identify genetic factors that may contribute to disease biology, cancer-specific outcomes, and sensitivities to therapeutics. Incorporation of genetic and nongenetic factors to study variations seen at the population level remain critical to informing precision-based interventions which ultimately optimize health equity for all patients with RCC.
Supplementary Material
ACKNOWLEDGMENTS
This research was supported by the Kidney Cancer Association Young Investigator Award (awarded to R.R.K.). The research was also supported, in part, by the Memorial Sloan Kettering Cancer Center’s NIH Support Grant/Core [P30-CA008748]. R.R.K. is also supported, in part, by the Academy of Kidney Cancer Investigators of the CDMRP/DOD [KC200127]. The funding sources had no role in the design and conduct of the study; collection, management, analysis, and interpretation of the data; preparation, review, or approval of the manuscript; and decision to submit the manuscript for publication.
Footnotes
CONFLICT OF INTEREST STATEMENT
Ritesh R. Kotecha reports advisory board consultation for Eisai and reports receiving institutional research funding from Pfizer, Takeda, Novartis, Xencor, and Allogene Therapeutics. Neil J. Shah reports consultation fees from Merck, Aravive, Exelixis, MetNet, MJH Oncology, and institutional research support for Aravive and Exelixis. Darren R. Feldman reports consulting for Telix and BioNTech, and institutional research funding from Telix, Decibel Therapeutics, Astellas, and royalties from UpToDate. Ed Reznik is a paid consultant for Xontogeny, LLC. Chung-Han Lee reports consulting for Amgen, Aveo, BMS, Exelixis, Eisai, Merck, Pfizer, EMD Serono, Cardinal Health, honoraria from AiCME, IDEOlogy Health, Intellisphere, Medscape, MJH, Research to Practice, and institutional research from AstraZeneca, BMS, Calithera, Eisai, Eli Lilly, Exelixis, Merck, and Pfizer. Robert J. Motzer reports consulting for AstraZeneca, Aveo, Calithera Biosciences, Eisai, EMD Serome, Exelixis, Genentech/Roche, Incyte, Pfizer, and Merck, and institutional research support from Aveo, Bristol-Myers Squibb, Eisai, Exelixis, Genentech/Roche, Novartis, Pfizer, and Merck. Martin H. Voss reports advisory board/consulting from Eisai, Exelixis, Merck, Calithera, Aveo, Genentech, Oncorena, Affimed, MICU Rx Aravive, onQuality, Astra Zeneca, Mertelsmann Foundation, and institutional research support from Pfizer, BMS, Genentech. The other authors declare no conflicts of interest.
SUPPORTING INFORMATION
Additional supporting information can be found online in the Supporting Information section at the end of this article.
DATA AVAILABILITY STATEMENT
The data that support the findings of this study are available from the corresponding author upon reasonable request.
REFERENCES
- 1.Chow WH, Shuch B, Linehan WM, Devesa SS. Racial disparity in renal cell carcinoma patient survival according to demographic and clinical characteristics. Cancer. 2013;119(2):388–394. doi: 10.1002/cncr.27690 [DOI] [PMC free article] [PubMed] [Google Scholar]
- 2.Siegel RL, Miller KD, Fuchs HE, Jemal A. Cancer statistics, 2022. CA A Cancer J Clin. 2022;72(1):7–33. doi: 10.3322/caac.21708 [DOI] [PubMed] [Google Scholar]
- 3.Davidoff AJ, Guy GP Jr., Hu X, et al. Changes in health insurance coverage associated with the Affordable Care Act among adults with and without a cancer history: population-based national estimates. Med Care. 2018;56(3):220–227. doi: 10.1097/mlr.0000000000000876 [DOI] [PMC free article] [PubMed] [Google Scholar]
- 4.Batai K, Harb-De la Rosa A, Zeng J, Chipollini JJ, Gachupin FC, Lee BR. Racial/ethnic disparities in renal cell carcinoma: increased risk of early-onset and variation in histologic subtypes. Cancer Med. 2019;8(15):6780–6788. doi: 10.1002/cam4.2552 [DOI] [PMC free article] [PubMed] [Google Scholar]
- 5.Wong KJ, Shusterman M, Goel S, Negassa A, Lin J, Gartrell BA. Racial diversity among histology of renal cell carcinoma at an urban medical center. Clin Genitourin Cancer. 2021;19(3):e166–e170. doi: 10.1016/j.clgc.2020.12.010 [DOI] [PubMed] [Google Scholar]
- 6.Olshan AF, Kuo T-M, Meyer A-M, Nielsen ME, Purdue MP, Rathmell WK. Racial difference in histologic subtype of renal cell carcinoma. Cancer Med. 2013;2(5):744–749. doi: 10.1002/cam4.110 [DOI] [PMC free article] [PubMed] [Google Scholar]
- 7.Bossé D, Xie W, Lin X, et al. Outcomes in Black and White patients with metastatic renal cell carcinoma treated with first-line tyrosine kinase inhibitors: insights from two large cohorts. JCO Global Oncol. 2020;6:293–306. doi: 10.1200/jgo.19.00380 [DOI] [PMC free article] [PubMed] [Google Scholar]
- 8.Borrell LN, Elhawary JR, Fuentes-Afflick E, et al. Race and genetic ancestry in medicine — a time for reckoning with racism. N Engl J Med. 2021;384(5):474–480. doi: 10.1056/NEJMms2029562 [DOI] [PMC free article] [PubMed] [Google Scholar]
- 9.Carrot-Zhang J, Chambwe N, Damrauer JS, et al. Comprehensive analysis of genetic ancestry and its molecular correlates in cancer. Cancer Cell. 2020;37(5):639–654.e6. doi: 10.1016/j.ccell.2020.04.012 [DOI] [PMC free article] [PubMed] [Google Scholar]
- 10.Abou Alaiwi S, Nassar AH, Adib E, et al. Trans-ethnic variation in germline variants of patients with renal cell carcinoma. Cell Rep. 2021;34(13):108926. doi: 10.1016/j.celrep.2021.108926 [DOI] [PubMed] [Google Scholar]
- 11.Cheng DT, Mitchell TN, Zehir A, et al. Memorial Sloan Kettering-Integrated Mutation Profiling of Actionable Cancer Targets (MSK-IMPACT): a hybridization capture-based next-generation sequencing clinical assay for solid tumor molecular oncology. J Mol Diagn. 2015;17(3):251–264. doi: 10.1016/j.jmoldx.2014.12.006 [DOI] [PMC free article] [PubMed] [Google Scholar]
- 12.Chowell D, Krishna C, Pierini F, et al. Evolutionary divergence of HLA class I genotype impacts efficacy of cancer immunotherapy. Nat Med. 2019;25(11):1715–1720. doi: 10.1038/s41591-019-0639-4 [DOI] [PMC free article] [PubMed] [Google Scholar]
- 13.Arora K, Tran TN, Kemel Y, et al. Genetic ancestry correlates with somatic differences in a real-world clinical cancer sequencing cohort. Cancer Discov. 2022;12(11):OF1–OF14. doi: 10.1158/2159-8290.CD-22-0312 [DOI] [PMC free article] [PubMed] [Google Scholar]
- 14.Yoshihara K, Shahmoradgoli M, Martínez E, et al. Inferring tumour purity and stromal and immune cell admixture from expression data. Nat Commun. 2013;4(1):2612. doi: 10.1038/ncomms3612 [DOI] [PMC free article] [PubMed] [Google Scholar]
- 15.Tan K-T, Kim H, Carrot-Zhang J, et al. Haplotype-resolved germline and somatic alterations in renal medullary carcinomas. Genome Med. 2021;13(1):114. doi: 10.1186/s13073-021-00929-4 [DOI] [PMC free article] [PubMed] [Google Scholar]
- 16.Krishnan B, Rose TL, Kardos J, Milowsky MI, Kim WY. Intrinsic genomic differences between African American and White patients with clear cell renal cell carcinoma. JAMA Oncol. 2016;2(5):664–667. doi: 10.1001/jamaoncol.2016.0005 [DOI] [PMC free article] [PubMed] [Google Scholar]
- 17.Saliby RM, Jammihal T, Labaki C, et al. Cross-trial validation of molecular subtypes in patients with metastatic clear cell renal cell carcinoma (RCC): the JAVELIN Renal 101 experience. J Clin Oncol. 2022; 40(16_Suppl):4531. doi: 10.1200/JCO.2022.40.16_suppl.4531 [DOI] [Google Scholar]
- 18.Motzer RJ, Choueiri TK, McDermott DF, et al. Biomarker analyses from the phase III CheckMate 214 trial of nivolumab plus ipilimumab (N+I) or sunitinib (S) in advanced renal cell carcinoma (aRCC). J Clin Oncol. 2020;38(15_Suppl):5009. doi: 10.1200/JCO.2020.38.15_suppl.5009 [DOI] [Google Scholar]
- 19.Motzer RJ, Banchereau R, Hamidi H, et al. Molecular subsets in renal cancer determine outcome to checkpoint and angiogenesis blockade. Cancer Cell. 2020;38(6):803–817.e4. doi: 10.1016/j.ccell.2020.10.011 [DOI] [PMC free article] [PubMed] [Google Scholar]
- 20.McDermott DF, Huseni MA, Atkins MB, et al. Clinical activity and molecular correlates of response to atezolizumab alone or in combination with bevacizumab versus sunitinib in renal cell carcinoma. Nat Med. 2018;24(6):749–757. doi: 10.1038/s41591-018-0053-3 [DOI] [PMC free article] [PubMed] [Google Scholar]
- 21.Weinstein JN, Collisson EA, Mills GB, et al. The Cancer Genome Atlas Pan-Cancer analysis project. Nat Genet. 2013;45(10):1113–1120. doi: 10.1038/ng.2764 [DOI] [PMC free article] [PubMed] [Google Scholar]
- 22.Hutson TE, Michaelson MD, Kuzel TM, et al. A single-arm, multicenter, phase 2 study of lenvatinib plus everolimus in patients with advanced non-clear cell renal cell carcinoma. Eur Urol. 2021;80(2):162–170. doi: 10.1016/j.eururo.2021.03.015 [DOI] [PubMed] [Google Scholar]
- 23.Jivanji D, Jamieson S, Mallory C, et al. The association between race and 5-year survival in patients with clear cell renal cell carcinoma: a cohort study. Urology. 2021;148:185–191. doi: 10.1016/j.urology.2020.10.055 [DOI] [PubMed] [Google Scholar]
- 24.Carlo MI, Mukherjee S, Mandelker D, et al. Prevalence of germline mutations in cancer susceptibility genes in patients with advanced renal cell carcinoma. JAMA Oncol. 2018;4(9):1228–1235. doi: 10.1001/jamaoncol.2018.1986 [DOI] [PMC free article] [PubMed] [Google Scholar]
- 25.Kong W, Yang T, Wen X, et al. Germline mutation landscape and associated clinical characteristics in chinese patients with renal cell carcinoma. Front Oncol. 2021;11:737547. doi: 10.3389/fonc.2021.737547 [DOI] [PMC free article] [PubMed] [Google Scholar]
- 26.Oak N, Cherniack AD, Mashl RJ, et al. Ancestry-specific predisposing germline variants in cancer. Genome Med. 2020;12(1):51. doi: 10.1186/s13073-020-00744-3 [DOI] [PMC free article] [PubMed] [Google Scholar]
- 27.Olsen TA, Martini DJ, Goyal S, et al. Racial differences in clinical outcomes for metastatic renal cell carcinoma patients treated with immune-checkpoint blockade. Front Oncol. 2021;11:701345. doi: 10.3389/fonc.2021.701345 [DOI] [PMC free article] [PubMed] [Google Scholar]
- 28.Voss MH, Reising A, Cheng Y, et al. Genomically annotated risk model for advanced renal-cell carcinoma: a retrospective cohort study. Lancet Oncol. 2018;19(12):1688–1698. doi: 10.1016/s1470-2045(18)30648-x [DOI] [PMC free article] [PubMed] [Google Scholar]
- 29.Braun DA, Ishii Y, Walsh AM, et al. Clinical validation of PBRM1 alterations as a marker of immune checkpoint inhibitor response in renal cell carcinoma. JAMA Oncol. 2019;5(11):1631–1633. doi: 10.1001/jamaoncol.2019.3158 [DOI] [PMC free article] [PubMed] [Google Scholar]
- 30.Vano Y-A, Elaidi R, Bennamoun M, et al. Nivolumab, nivolumab–ipilimumab, and VEGFR-tyrosine kinase inhibitors as first-line treatment for metastatic clear-cell renal cell carcinoma (BIONIKK): a biomarker-driven, open-label, non-comparative, randomised, phase 2 trial. Lancet Oncol. 2022;23(5):612–624. doi: 10.1016/S1470-2045(22)00128-0 [DOI] [PubMed] [Google Scholar]
- 31.Tomita Y, Kimura G, Fukasawa S, et al. Subgroup analysis of the AFTER I-O study: a retrospective study on the efficacy and safety of subsequent molecular targeted therapy after immune-oncology therapy in Japanese patients with metastatic renal cell carcinoma. Jpn J Clin Oncol. 2021;51(11):1656–1664. doi: 10.1093/jjco/hyab114 [DOI] [PMC free article] [PubMed] [Google Scholar]
- 32.Tamada S, Kondoh C, Matsubara N, et al. Pembrolizumab plus axitinib versus sunitinib in metastatic renal cell carcinoma: outcomes of Japanese patients enrolled in the randomized, phase III, open-label KEYNOTE-426 study. Int J Clin Oncol. 2022;27(1):154–164. doi: 10.1007/s10147-021-02014-7 [DOI] [PMC free article] [PubMed] [Google Scholar]
- 33.Braun DA, Hou Y, Bakouny Z, et al. Interplay of somatic alterations and immune infiltration modulates response to PD-1 blockade in advanced clear cell renal cell carcinoma. Nat Med. 2020;26(6):909–918. doi: 10.1038/s41591-020-0839-y [DOI] [PMC free article] [PubMed] [Google Scholar]
- 34.Motzer RJ, Escudier B, McDermott DF, et al. Nivolumab versus everolimus in advanced renal-cell carcinoma. N Engl J Med. 2015;373(19):1803–1813. doi: 10.1056/NEJMoa1510665 [DOI] [PMC free article] [PubMed] [Google Scholar]
- 35.Znaor A, Lortet-Tieulent J, Laversanne M, Jemal A, Bray F. International variations and trends in renal cell carcinoma incidence and mortality. Eur Urol. 2015;67(3):519–530. doi: 10.1016/j.eururo.2014.10.002 [DOI] [PubMed] [Google Scholar]
- 36.Nassar AH, Adib E, Abou Alaiwi S, et al. Ancestry-driven recalibration of tumor mutational burden and disparate clinical outcomes in response to immune checkpoint inhibitors. Cancer Cell. 2022;40(10):1161–1172.e5. doi: 10.1016/j.ccell.2022.08.022 [DOI] [PMC free article] [PubMed] [Google Scholar]
Associated Data
This section collects any data citations, data availability statements, or supplementary materials included in this article.
Supplementary Materials
Data Availability Statement
The data that support the findings of this study are available from the corresponding author upon reasonable request.