

Abstract
Aims
Understanding how gambling harm is distributed is essential to inform effective harm reduction measures. This first national Australian study of gambling harm-to-self examined the extent, distribution, risk factors, and health related quality of life (HRQoL) impacts of this harm.
Methods
A Random Digit Dialling sample of 15,000 Australian adults was weighted to key population variables. Key measures included the Gambling Harms Scale-10 (GHS-10), PGSI, SF-6D, gambling behaviours, and demographics. Analyses included ordinal logistic regression.
Results
Amongst gamblers, 14.7% reported harm on the GHS-10, including 1.9% reporting high-level harm. While high-level harm occurred mainly in the problem gambling group (77.3%), other PGSI groups accounted for most of the more prevalent low (98.5%) and moderate (87.2%) harms reported. Proximal predictors of greater harm were use of online gambling and more frequent gambling on electronic gaming machines (EGMs), race betting sports betting, poker, skin gambling, scratchies, and loot box purchasing. Distal predictors were being younger, male, single, Aboriginal or Torres Strait Islander, and speaking a non-English language at home. At the population level, the greatest aggregate HRQoL impacts were amongst lower-risk gamblers, confirming the results of other studies regarding the ‘prevention paradox’.
Conclusions
The distribution of harm across gambler risk groups indicates the need for preventive measures, not just interventions for problem gambling. Reducing harm requires modifying product features that amplify their risk, especially for EGMs, race betting and sports betting that are both inherently risky and widely used. Gambling harm exacerbates health disparities for disadvantaged and vulnerable groups, requiring targeted resources and support.
Keywords: gambling harm, health-related quality of life (HRQoL) population study, risk factors, gambling products, health inequity
Introduction
As part of a broader focus on gambling as a public health issue (Hilbrecht et al., 2020; Price, Hilbrecht, & Billi, 2021; Wardle, Reith, Langham, & Rogers, 2019), research has increased into the consequential harms that people experience from their gambling, including at all levels of consumption. Gambling problems, by definition result in harm (Ferris & Wynne, 2001) which can then extend to others, from close friends and family to broader communities (Langham et al., 2015). Important developments include reconceptualising gambling harm as distinct from behavioural dependence on gambling (Browne & Rockloff, 2020), mapping the types and longevity of gambling harm (Langham et al., 2015; Rockloff et al., 2022), developing valid instruments to measure it (Browne, Goodwin, & Rockloff, 2018, 2021; Browne, Newall et al., 2022), and assessing its occurrence in the population and distribution across different gambler risk groups (Browne et al., 2016, 2017; Paterson et al., 2019; Rockloff et al., 2019; Salonen, Hellman, Latvala, & Castrén, 2018; Stevens, Gupta, & Flack, 2019). Importantly, gambling harm occurs even in the absence of an addictive disorder, and similarly in population studies, beyond those classified as “problem gamblers”. Even though higher-risk gamblers experience more per-person harm from gambling, most aggregate harm is experienced amongst lower-risk gamblers because they are more numerous (Browne & Rockloff, 2018; Canale, Vieno, & Griffiths, 2016; Volberg, Zorn, Williams, & Evans, 2021). This finding has been likened to the prevention paradox, where a large number of people at low risk yields greater burden in a population than a small number of people at high risk (Rose, 1981). It is important to understand how gambling harm is distributed to inform appropriate harm reduction measures. Measures targeted at people with severe gambling problems (for instance, treatment referrals) may not be as effective for people with lesser problems.
Gambling harm is important because it can extend across financial, relationship, psychological, health, vocational, criminal, and other life domains (Browne et al., 2016, 2017). In addition, it impacts negatively on affected others, communities and societies (Goodwin, Browne, Rockloff, & Rose, 2017; Hilbrecht et al., 2020; Hing, Russell, Browne, et al., 2022; Tulloch, Browne, Hing, & Rockloff, 2021; Tulloch, Browne, Hing, Rockloff, & Hilbrecht, 2022), and results in decrements to people's overall wellbeing and quality of life (ACIL Allen, 2018; Browne et al., 2016, 2018; Murray Boyle, Browne, Rockloff, & Thorne, 2022; Rockloff et al., 2019; Tulloch, Hing, Browne, Rockloff, & Hilbrecht, 2021). A substantial proportion of gamblers experience harm from their gambling, with between 10 and 25% reporting at least one harm in the previous 12 months, most commonly financial and emotional/psychological (Paterson et al., 2019; Rockloff et al., 2019; Salonen et al., 2018; Stevens et al., 2019). A series of public health-oriented studies have attempted to assess health-related quality of life (HRQoL) impacts across the spectrum of gambling-related harm and gambling problems (Browne et al., 2016; Browne, Newall et al., 2022). This general framework involves combining severity and prevalence estimates to gauge population level impact, using different elicitation methods (Browne, Rawat, et al., 2020). However, one limitation of this work is that it was not based on direct measurement of GRH in a population-representative survey. The present population study includes the GHS-10, allowing us to directly estimate total societal impact across the spectrum of harms and problems. Understanding the aggregate harm from gambling, is important so that governments can direct appropriate attention and resources to its amelioration through policy adjustments, regulatory changes, public health initiatives, and support services.
In addition to understanding population-level harm from gambling, it is important to identify sub-groups who experience relatively more harm to better understand health inequalities. From a health equity perspective, knowing whether gambling exacerbates health disparities amongst already disadvantaged and marginalised groups should shape policy decisions about gambling availability and access. Nonetheless, there is abundant evidence that First Nations peoples, ethnic minority groups, people in poorer socio-economic circumstances, young people, and people affected by comorbid conditions continue to bear a disproportionate amount of gambling harm (Abbott, 2020; Browne, Rockloff et al., 2020; Hing, Breen, Gordon, & Russell, 2014; Paterson et al., 2019; Raybould, Larkin, & Tunney, 2021; Rockloff et al., 2019; Stevens et al., 2019; Tu, Gray, & Walton, 2014; Williams et al., 2021). Beyond this, a knowledge of individual characteristics associated with increased risk is important to inform the provision and tailoring of public education, treatment, and support. For example, risk factors can guide messages and media used to target community education, resourcing, and placement of support services.
Another critical aspect of gambling harm is its varying association with different gambling products and modes. Research has consistently found that gambling problems are strongly associated with online modes of gambling, EGMs, and novel gambling products such as esports betting, skin gambling, and loot box purchasing (Allami et al., 2021; Binde, Romild, & Volberg, 2017; Browne et al., 2023; Delfabbro, King, Browne, & Dowling, 2020; Hing, Rockloff, & Browne, 2023; Mazar, Zorn, Becker, & Volberg, 2020; Spicer et al., 2021). Similarly, harmful consequences from gambling are disproportionately associated with gambling on EGMs, online poker, sports, casino games, keno, and novel gambling products (Browne, Rockloff et al., 2020; Rockloff et al., 2019). Understanding how gambling harm is related to different gambling forms and modes is essential to reduce this harm. This could occur through policies and practices that restrict the most harmful forms and modes, require them to have more rigorous consumer protection measures, and warn consumers about their risks.
In summary, understanding the extent and distribution of gambling harm and its associated HRQoL impacts in a jurisdiction is essential to inform policies and practices related to gambling provision, consumer protection, harm reduction, and the provision of support services. However, empirical research that assesses gambling harm, and not just gambling problems, remains relatively scarce, particularly national population studies because gambling is usually regulated and researched at a state or provincial level. The current study presents the first national Australian examination of harm to self from gambling, although several state-based studies have been conducted (Browne, Rockloff et al., 2020; Paterson, Leslie, & Taylor, 2019; Rockloff et al., 2019; Stevens et al., 2019). Harm to affected others in Australia has previously been reported, including amongst adults (Hing, Russell, Browne, et al., 2022; Tulloch, Browne, Hing, Rockloff, & Hilbrecht, 2023; Tulloch, Hing, et al., 2021) and children (Suomi, Watson, & Butterworth, 2022, 2023; Tulloch, Hing, Browne, Rockloff, & Hilbrecht, 2022).
The current study aims to - 1) examine extent of gambling harm-to-self in Australia, 2) examine the distribution of gambling harm by problem gambling severity group, 3) identify the extent of gambling harm attributed to each form of gambling; 4) assess proximal and distal risk factors for gambling harm; and 5) assess the HRQoL impacts of gambling harm. Given that the analyses were not preregistered, they must be treated as exploratory, and is therefore centered on these general aims rather than testing hypotheses.
Method
Participants
Participants were selected as part of a representative national telephone survey conducted for an Australian study of online gambling (Hing et al., 2021). Using a Random Digit Dialling mobile phone sample of 15,000 Australian adults, it was conducted between October and December 2019.
Weighting
Weighting was applied to align the sample to known population figures for age, gender, and location (i.e., state or territory of residence) compared to data from The Australian Bureau of Statistics. Two participants identified as a gender other than male or female, and nationally-representative data were not available for other genders, meaning a weight could not be calculated based on their actual gender. Without a weight, these two participants could not be included in any weighted analyses and thus excluded from the paper. To ensure they were included, they were randomly allocated to a gender so that a weight could be calculated. We recognise that this is a potentially sensitive topic and reiterate that the purpose of this random allocation to a gender was purely for the purpose of calculating a weight so that they could be included in analyses. Participants were contacted by mobile phone, and probability of selection was also included in weighting calculations based on their response to a question about how many mobile phones they have access to. Some questions about gambling were only asked of some participants. Specifically, all interactive gamblers were asked questions relevant to them, while a subsample of non-interactive gamblers were asked these questions. Thus, it was necessary to readjust relative proportions of interactive and non-interactive gamblers for these questions. Thus, a second version of the weights that incorporated subsample weighting was applied to analyses for relevant variables. Weights were normed so that the weighted sample size was the same as the unweighted sample size, maintaining the same N so as not to artificially inflate statistical power. Thus, all results can be considered representative, either of the population as a whole (weighted N = 15,000), or of people who gamble in Australia (weighted N = 5,254). Further information on the survey flow, sample and weighting can be found in the full report (Hing et al., 2021). Table 1 shows descriptive statistics for the sample of interest.
Table 1.
Descriptive statistics for past-year gamblers (N = 5,254)
| Characteristic | n | Percentage |
| Gender (male) | 2,938 | 55.92% |
| Age (years) | ||
| 18–19 | 185 | 3.52% |
| 20–24 | 368 | 7.00% |
| 25–29 | 396 | 7.54% |
| 30–34 | 420 | 7.99% |
| 35–39 | 401 | 7.63% |
| 40–44 | 405 | 7.71% |
| 45–49 | 480 | 9.14% |
| 50–54 | 445 | 8.47% |
| 55–59 | 525 | 9.99% |
| 60–64 | 549 | 10.45% |
| 65+ | 1,081 | 20.57% |
| Household description | ||
| Single person | 1,046 | 20.04% |
| One parent family with children | 337 | 6.46% |
| Couple with children | 1,686 | 32.31% |
| Couple with no children | 1,489 | 28.53% |
| Group household | 547 | 10.48% |
| Intergenerational/extended family | 111 | 2.13% |
| Other | 3 | 0.06% |
| Marital Status | ||
| Never married | 1,146 | 21.96% |
| Married | 2,412 | 46.22% |
| Partner/de facto | 756 | 14.49% |
| Divorced/separated/widowed | 905 | 17.34% |
| Education | ||
| Year 10 or less | 748 | 14.64% |
| Year 12 | 823 | 16.11% |
| Technical and further education college | 1,443 | 28.24% |
| Undergraduate degree | 1,256 | 24.58% |
| Postgraduate degree | 839 | 16.42% |
| Aboriginal or Torres Strait Islander | 141 | 2.70% |
| Country of Birth (Australia) | 3,905 | 74.81% |
| Language other than English at home | 754 | 14.44% |
| PGSI | ||
| NP | 4,214 | 80.73% |
| LR | 592 | 11.34% |
| MR | 301 | 5.77% |
| PG | 113 | 2.16% |
Measures
Problem gambling severity was assessed using the nine-item Problem Gambling Severity Index (PGSI) (Ferris & Wynne, 2001). Response options were never (0), sometimes (1), most of the time (2) and almost always (3). Scores ranged from 0 to 27 and participants were classified into four groups: non-problem gambling (NP; 0), low-risk gambling (LR; 1–2), moderate-risk gambling (MR; 3–7) and problem gambling (PG; 8–27). Cronbach's Alpha study was 0.881. For survey efficiency, participants who had gambled only on lotteries and/or bingo less often than weekly were not asked the PGSI or gambling harm. In the current study, these participants were assumed to have a score of zero on these measures for all analyses.
Gambling harms were measured by a selection of 26 possible harms to self. These included items from the Gambling Harms Scale −10 (GHS-10; Browne, Newall et al., 2022) as well as an additional 16 items covering a spectrum of mild to more severe harms. Participants were asked whether, during the previous 12 months, they had experienced any of these issues as a result of their own gambling. They provided a binary response (yes/no) to all 26 gambling-related harms, which include the items in Table 2. Summed binary responses for these scales perform similarly to a Likert scale alternative (McLauchlan, Browne, Russell, & Rockloff, 2020). Consequently, ‘yes’ scores were summed and ranged from 0 to 10 (GHS-10), and 0–26 (26-item measure), with higher scores indicative of higher levels of gambling-related harm. Due to the high correlation between the two scales (Spearman's correlation = 0.958), the decision was made to utilise the validated scale, the GHS-10, for analyses. GHS-10 scores were categorised as no harm (0), low harm (1–2), moderate harm (3–5) and high harm (6+) for calculating the population level burden of harm (Browne, Newall et al., 2023). For ordinal regression analysis, all responses of the scale were used; however, the higher responses (6–10) combined into 6+. Therefore, the scale for analysis effectively spanned from 0 to 6, with GHS-10 values from 6 to 10 being recoded as 6. Cronbach's Alpha was 0.856.
Table 2.
Frequency of individual harms in the GHS-10 by gamblers and Australian adult population
| GHS-10 Items | Gamblers | Population |
| Reduction of your available spending money | 7.80% | 4.44% |
| Reduction of your savings | 6.70% | 3.81% |
| Had regrets that made you feel sorry about your gambling | 6.40% | 3.64% |
| Less spending on recreational expenses | 5.60% | 3.19% |
| Felt ashamed of your gambling | 3.50% | 1.99% |
| Felt like a failure | 2.80% | 1.59% |
| Felt distress about your gambling | 2.70% | 1.54% |
| Spent less time with people I care about | 2.40% | 1.37% |
| Increased credit card debt | 1.10% | 0.63% |
| Sold personal items | 0.90% | 0.51% |
Note: population weighting used.
Participants who reported one or more gambling harms were also asked to identify “Which type of gambling has contributed most to the harm you experienced from your gambling?”. This question was drawn from previous Australian research (Hing, Russell, Gainsbury, & Blaszczynski, 2015).
HRQoL was assessed by the health utility measure, the SF-6D (Brazier et al., 2004). Derived from the 12-item Short Form Health Survey (SF-12), a shortened version of the SF-36 (Ware & Sherbourne, 1992), the SF-12 assesses various areas of health and wellbeing. From the SF-12, a health utility SF-6D, was calculated (Brazier et al., 2004). The SF-6D is a preference-based measure capturing physical and social functioning, role limitations, pain, mental health, and vitality (Hunger, Baumert, & Holle, 2011). Higher scores indicate better health. The GHS-10 has been benchmarked this health utility to enable its use as an indicator of HRQoL associated with gambling harm (Browne, Newall et al., 2022). Statistical methods were used to benchmark the GHS-10 to the SF-6D using propensity weighting and controlling for comorbidities; qualitative checks of the quantitative findings; and expert elicitation methods (Browne, Newall et al., 2022). Benchmarking resulted in a HRQoL decrement (or disability weight) associated with each score of the GHS. HRQoL decrements, or relative reductions to wellbeing, represent the overall burden of a health condition and represent the severity of its impact, ranging between 0 (perfect health) and 1 (death).
Gambling behaviour was measured across 14 forms (listed in Tables 3 and 4). Participants were asked how frequently they gambled on each form (not in the last 12 months/less than monthly/at least once a month/2–3 times a month/at least weekly/2–3 times a week/4 or more times a week). Times per year were calculated from these categories and these values were log-transformed for analysis. Online gamblers were defined as adults who gambled online at least once in the previous 12 months (regardless of whether they also gambled using land-based modes). Land-based only gamblers gambled using land-based venues or telephone calls at least once in the past year, but who did not gamble online.
Table 3.
Proportion of harm attributed by gambling form
| Participants who reported harm from their own gambling | ||||
| Participants in each form | Nominated as most harmful form* | Proportion of harm attributed to each form by participants | ||
| N | N | % | SE | |
| EGMs | 1,532 | 279 | 18.21% | 0.99% |
| Loot boxes | 195 | 25 | 12.82% | 2.39% |
| Poker | 332 | 38 | 11.45% | 1.75% |
| Casino table games | 557 | 57 | 10.23% | 1.28% |
| E-sports, fantasy sports, skin | 154 | 14 | 9.09% | 2.32% |
| Sports betting | 864 | 67 | 7.75% | 0.91% |
| Race betting | 1,558 | 105 | 6.74% | 0.64% |
| Betting on non-sporting events | 135 | 6 | 4.44% | 1.77% |
| Lotteries/lotto/pools | 3,918 | 94 | 2.40% | 0.24% |
| Bingo | 210 | 3 | 1.43% | 0.82% |
| Instant scratchies | 1,415 | 17 | 1.20% | 0.29% |
| Keno | 744 | 7 | 0.94% | 0.35% |
Note: betting on esports, fantasy sports and gambling using skins were combined due to low n's. Subsample weights used. *8 participants selected ‘other' and were excluded.
Table 4.
Ordinal regressions predicting gambling-related harm from proximal and distal factors
| Predictors | Proximal | Distal | Proximal and Distal | |||||||||
| B | SE | p | Odds ratio | B | SE | p | Odds ratio | B | SE | p | Odds ratio | |
| Scratchies | 0.354 | 0.0363 | <0.001 | 1.425 | 0.174 | 0.0437 | <0.001 | 1.189 | ||||
| Lottery | 0.756 | 0.0221 | <0.001 | 2.129 | 0.033 | 0.0325 | 0.312 | 1.033 | ||||
| Sports betting | 0.188 | 0.0366 | <0.001 | 1.207 | 0.098 | 0.0388 | 0.011 | 1.103 | ||||
| Race betting | 0.243 | 0.0312 | <0.001 | 1.274 | 0.185 | 0.0349 | <0.001 | 1.203 | ||||
| Novelty event betting | 0.347 | 0.1276 | 0.006 | 1.415 | 0.103 | 0.1333 | 0.439 | 1.109 | ||||
| Bingo | 0.185 | 0.0837 | 0.028 | 1.203 | −0.02 | 0.1073 | 0.849 | 0.98 | ||||
| Keno | −0.081 | 0.0444 | 0.069 | 0.922 | ||||||||
| Poker | 0.488 | 0.0551 | <0.001 | 1.629 | 0.218 | 0.056 | <0.001 | 1.244 | ||||
| Casino games | 0.274 | 0.0626 | <0.001 | 1.315 | 0.096 | 0.0624 | 0.125 | 1.101 | ||||
| EGMs | 0.739 | 0.0331 | <0.001 | 2.093 | 0.506 | 0.0331 | <0.001 | 1.659 | ||||
| Esports betting | 0.311 | 0.1091 | 0.004 | 1.365 | 0.108 | 0.1042 | 0.301 | 1.114 | ||||
| Fantasy sports betting | 0.265 | 0.1397 | 0.058 | 1.303 | ||||||||
| Skin Gambling | 0.425 | 0.1294 | 0.001 | 1.529 | 0.23 | 0.1162 | 0.048 | 1.258 | ||||
| Loot box purchasing | 0.835 | 0.0589 | <0.001 | 2.306 | 0.359 | 0.056 | <0.001 | 1.432 | ||||
| Land-based only gambler | −2.005 | 0.0776 | <0.001 | 0.135 | −0.443 | 0.0968 | <0.001 | 0.642 | ||||
| Gender (Male) | 0.748 | 0.0853 | <0.001 | 2.113 | 0.404 | 0.0936 | <0.001 | 1.498 | ||||
| ATSI (No) | −0.623 | 0.1866 | <0.001 | 0.536 | −0.424 | 0.1969 | 0.031 | 0.654 | ||||
| LOTE (No) | −0.316 | 0.1126 | 0.005 | 0.729 | −0.562 | 0.1063 | <0.001 | 0.57 | ||||
| COB (Australia) | 0.068 | 0.1019 | 0.506 | 1.07 | ||||||||
| Single (vs married) | 0.667 | 0.1101 | <0.001 | 1.949 | 0.528 | 0.0999 | <0.001 | 1.695 | ||||
| Single (vs partner) | 0.222 | 0.1105 | 0.045 | 1.248 | 0.266 | 0.1105 | 0.016 | 1.305 | ||||
| Single (vs divorced or widowed) | 0.035 | 0.1411 | 0.804 | 1.036 | ||||||||
| Age (groups) | −0.164 | 0.0156 | <0.001 | 0.849 | −0.115 | 0.0167 | <0.001 | 0.892 | ||||
| Education | −0.107 | 0.0327 | 0.001 | 0.899 | −0.021 | 0.035 | 0.539 | 0.979 | ||||
| Cox and Snell | 0.166 | 0.081 | 0.189 | |||||||||
Note: subsample weights used.
Demographic information was collected from all participants (Table 1).
Data analysis
Analysis was conducted in SPSS (Version 27) (IBM Corp., 2020). Frequencies describe the characteristics of the sample, and the number and type of harms experienced, and correlations describe the relationships between harm and HRQoL. Welch's ANOVA was used to calculate differences between PGSI groups, with Games-Howell post hoc tests.
Ordinal regression was conducted to examine predictors of harm. While other assumptions, including low multicollinearity, were met, the assumption of proportional odds was violated, as per the test of parallel lines (p < 0.001). This is not uncommon in large samples (National Centre for Research Methods, 2011). However, the violation of the proportional odds assumption does not undermine our findings, as the robustness of ordinal regression models can accommodate such deviations, especially in large sample contexts like ours. Thus, it was reasonable to assume that the use of ordinal regression was acceptable. Three multivariate models were conducted. The first two models examined the impact of proximal factors (gambling forms and mode) and distal factors (demographics) on harm. The first two models use GHS-10 scores as the dependent variables, and frequency of participation in each gambling form and being an online gambler as predictors in the first analysis, and demographic variables commonly associated with gambling-related harm as predictors in the second analysis. Age groups and education were treated as continuous variables. The other variables were binary. All predictors that significantly predicted harm in the first two regressions were then included in a combined regression containing both proximal and distal predictors. This staged analysis plan was intended to minimise the chance that the discovery of strong proximal predictors would be suppressed by covariance with distal predictors, and vice versa.
Ethics
The study procedures were carried out in accordance with the Declaration of Helsinki. The Institutional Review Board of Central Queensland University approved the study (#21992). All subjects were informed about the study, and all provided informed consent.
Results
Aim 1: examine the extent of gambling harm-to-self in Australia
Figure 1 illustrates the proportion of gamblers who experience each number of harms or more; 14.7% of gamblers, or 8.4% of the Australian adult population, reported at least 1 harm from their gambling (GHS-10, 1+) in the previous 12 months. Amongst gamblers, 5.42% reported at least moderate level harm (3+) and 1.92% reported high-level harm (6+), representing 3.09% and 1.09% of Australian adults, respectively. Males report a significantly higher mean number of harms than females (0.56 vs 0.21). People who identify as Aboriginal or Torres Strait Islander experience greater harm compared to others (1.03 vs 0.39), as do those who speak a language other than English at home (0.63 vs 0.37). The greatest mean number of harms were reported by people who are aged under 25 (18–19 years = 1.04 and 20–24 years = 0.87), and the lowest by those aged 65 and over (0.17).”
Fig. 1.
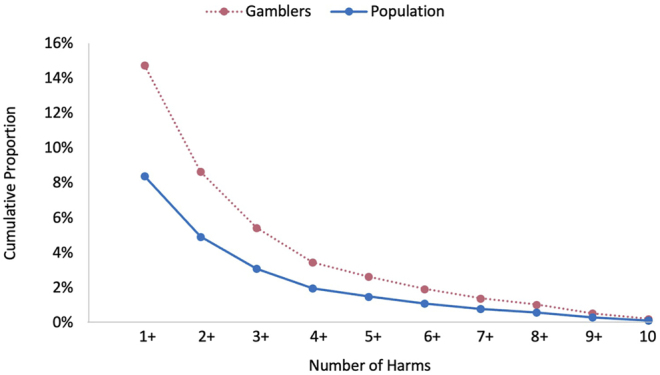
Proportion of people who experience each number of harms or more by gamblers and Australian adult population
Note: Gamblers reporting harm only, proportion of zero harms are 85.27% (gamblers), 91.62% (population), population weighting used. See Appendix (Table A1) for further information.
Table 2 presents the frequency of each individual harm in the GHS-10 amongst both gamblers and the Australian adult population.
Aim 2: examine the distribution of gambling harm by problem gambling severity group
Almost half of the adult Australian population are categorised by the PGSI as NP (45.96%), 6.57% are categorised as LR, 3.15% as MR, and 1.23% as PG. The remaining proportion had not gambled within the previous 12 months (43.09%). The mean (SD) harm scores by PGSI group are 0.07 (0.35) for NP, 0.69 (1.07) for LR, 2.33 (2.04) for MR and 6.41 (1.31) for PG. There was a significant difference across the groups, Welch (3, 360.86) = 397.24, p < 0.001. Post hoc tests show each of the groups was significantly different from the others. Presented in Fig. 2 is the distribution of harm scores by PGSI groups. Three or more harms are reported by most participants categorised as PG (91.89%), and 41.18% of those categorised as MR. Almost three-quarters of participants categorised as PG (71.17%), and 7.61% categorised as MR report six or more harms.
Fig. 2.
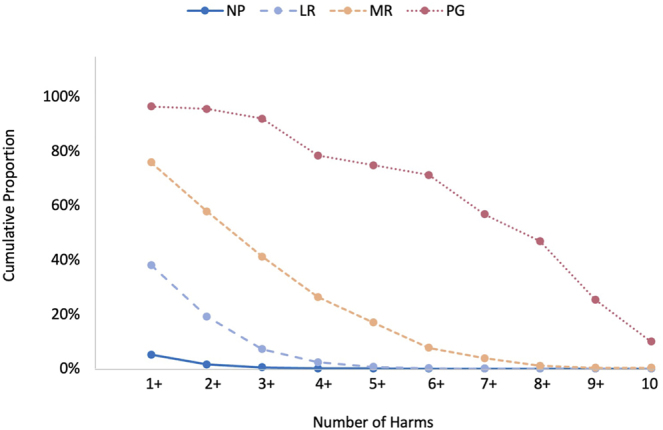
Proportion of people in each PGSI risk category who experience each number of harms or more
Note: Gamblers reporting harm only. Proportion of zero harms for gamblers are 94.88% (NP), 61.96% (LR), 24.22% (MR), 3.60% (PG). Subsample weight used. See Appendix (Table A2) for further information.
Figure 3 presents the proportion of harm in the population by each PGSI group for low, moderate, and high levels of harm. The total population burden was calculated for each level of harm (low, moderate, and high) using the formula: the percentage of the group (PGSI category) in the total population × percentage of people in that group experiencing that level of harm. The largest proportions of low-level harms in the population are reported by NP and LR gamblers. For moderate harm, MR gamblers report just over half the burden of harm, followed by LR gamblers. The bulk of harm in the high harm category is reported by people in the PG group.
Fig. 3.

Proportion of harm in the population by PGSI category
Aim 3: identify the extent of gambling harm attributed to each form of gambling
Participants who reported at least one harm from their gambling were asked to identify their most harmful gambling form. As detailed in Table 3, EGMs had both the highest raw numbers of being the most harmful form, as well as the highest proportion relative to the number of respondents who participated in each form.
Aim 4: assess proximal and distal risk factors for gambling harm-to-self
We performed ordinal logistic regressions to further examine the proximal (gambling forms and mode) and distal (demographic) risk factors for gambling harm-to-self. Table 4 reports the results of three ordinal regressions predicting gambling-related harm. The first regression assessed proximal factors. The gambling-related risk factors that predicted significantly greater levels of harm were being an online gambler compared to a land-based only gambler (i.e., betting online at least once in the previous 12 months) and more frequent participation in EGMs, loot box purchasing, skin gambling, poker, casino games, sports betting, race betting, e-sports betting, novelty event betting, bingo, lottery and scratchies. The second regression examined the distal predictors of harm. The demographic risk factors significantly predicting harm were being younger, male, Aboriginal or Torres Strait Islander, speaking a language other than English at home, being less well-educated, and being single (versus in a relationship). The third regression used only the proximal and distal factors that significantly predicted harm in the prior two regressions. In this combined analysis only being an online gambler, and more frequent participation in EGMs, sports betting, race betting, poker, skin gambling, loot box purchasing and scratchies remained significant (proximal) predictors of harm in the presence of distal predictors.
Aim 5: assess HRQoL impacts of gambling harm
The study examined the association between harm and decrements to HRQoL. The mean GHS-10 score was 0.41 (SD = 1.31, min = 0, max = 10) and the mean SF-6D score 0.81 (SD = 0.013, min = 0.34, max = 1.00). There was a significant correlation between harm and health utility, with health functioning reducing as harm increases (Spearman's rho = −0.153, p < 0.001). Table 5 shows the SF-6D decrement (see Browne, Newall et al., 2022 for details on decrement calculation) associated with the number of gambling harms experienced, alongside the proportion of gamblers and Australian adult population reporting that number of harms. Almost 15 per cent of Australians who gamble experience some level of health utility decrements associated with their gambling, ranging between 0.035 and 0.155.
Table 5.
Descriptive statistics of harm and health measures
| GHS-10 score | Gamblers | Population | SF-6D decrement* |
| 0 | 85.27% | 91.62% | 0 |
| 1 | 6.09% | 3.47% | −0.035 |
| 2 | 3.22% | 1.83% | −0.066 |
| 3 | 1.98% | 1.13% | −0.089 |
| 4 | 0.82% | 0.47% | −0.107 |
| 5 | 0.70% | 0.40% | −0.119 |
| 6 | 0.53% | 0.30% | −0.126 |
| 7 | 0.36% | 0.21% | −0.132 |
| 8 | 0.49% | 0.28% | −0.139 |
| 9 | 0.32% | 0.18% | −0.146 |
| 10 | 0.21% | 0.12% | −0.155 |
* from Browne, Newall et al. (2022), Appendix 2.
We used these decrements to illustrate the burden of harm in the population by the PGSI (blue) and the GHS-10 categories (red) (Fig. 4). As seen in the top row panels, non-problem or non-harmful gambling is the most prevalent in the population, with decreasing prevalence as problems or harms become more severe. The GHS-10 ‘low-harm’ threshold is more restrictive than the PGSI low-risk gambling threshold: 45.96% are classified by the PGSI as being non-problem gamblers, whilst 48.53% are classified as non-harmed gamblers.
Fig. 4.

Burden of harm in the population by PGSI and GHS-10 category
Note: Sample N = 5,224; Population N = 19,931,221 (Adult population of Australia in 2019); No harm includes non-gambling; No harm and non-gambling are 0 harm by definition, included for clarity.
In the second row, we plot the average HRQoL decrements associated with each category (Browne, Newall et al., 2023), which illustrates increasing severity of impact per-person, with more severe problems, or more reported harms. Because of the methodology used to develop the GHS-10, zero-reported harms on the GHS-10 imply zero health impacts from gambling. However, since some non-problem gamblers reported non-zero harms on the GHS-10 the mean value per-person is small (0.003), but non-zero.
As HRQoL decrements are in-principle additive over individuals, prevalence and severity can be combined to create an aggregate index of impact to the population. This is done simply by adding decrements over population-weighted prevalence. This is expressed as total years of life lost (YLL) for the Australian population, shown in row 3 of Fig. 4. As illustrated, the contrary effects of prevalence and severity lead to a more uniform distribution of population-level impact over the spectrum of severity. In accordance with the prevention-paradox, there is more aggregate impact in the low and medium harm bands, and only 25.2% of harm is experienced by those classified as problem gamblers.
Discussion
A key finding from this study is that gambling harm-to-self is experienced by a substantial proportion of adults in Australia (8.4%). About one-in-seven gamblers report at least one harm from their gambling, which equates to one-in-12 Australian adults. EGMs were most often reported as being the most harmful form. Low-level harm was most common (9.31% of gamblers), followed by moderate (3.50%) and high-level harm (1.91%). For individuals, high levels of harm are associated with much greater health decrements (−0.126 to −0.155), while low levels of harm are associated with about three times less negative impact per person (−0.035 to −0.89). However, given that less-harmed gamblers are almost five times as prevalent, the burden borne by this segment is actually significantly greater. While those in the PGSI PG category report the most individual-level harm and make up nearly three-quarters of those experiencing high-level harm, most aggregate low-level and moderate-level harm was found to occur amongst gamblers without a diagnosable gambling disorder. The present findings align with previous research, employing diverse methodologies for quantifying cumulative harm or HRQoL impacts (Table 6). Despite some variability within the findings, the integrated evidence suggests that the aggregate impacts of gambling are distributed across the severity spectrum, with the majority attributable to non-PG categories.
Table 6.
Contribution to population-level by PGSI category
| PGSI Category | Measure | Area | Reference | |||
| NP | LR | MR | PG | |||
| * | 50.2% | 34.5% | 15.2% | HRQoL (direct: TTO/VAS) | Australia (Victoria) | Browne et al. (2016) |
| * | 25.5% | 38.0% | 36.5% | Harms (distribution of 1+ social harms) | United Kingdom (National) | Canale et al. (2016) |
| * | 48.0% | 33.6% | 18.4% | HRQoL (direct: TTO/VAS) | New Zealand | Browne et al. (2017) |
| 33.2% | 19.1% | 24.7% | 22.0% | Count of Harms | Australia (panel survey) | Browne and Rockloff (2018) |
| * | 14.6% | 52.6% | 32.8% | HRQoL (indirect) | Australia (Victoria) | Browne, Newall et al. (2022) |
| 18.5% | 23.7% | 32.5% | 25.2% | HRQoL (indirect) | Australia (National) | current study |
Note: *proportion is structurally zero, i.e. assumed to be zero by the methodology used.
The results of this work, combined with other studies, indicate that harm reduction measures need to support not only those who meet clinical criteria for behavioural dependence, but also those in lower risk categories. This parallels other social issues relating to substance and behavioural disorders, such as alcohol, where impacts are well-recognised to apply to non-clinical populations (Rossow & Romelsjö, 2006). The application of some preventive measures have increased in Australia, such as limit-setting options, betting activity statements, and stronger gambling messaging for online wagering (Department of Social Services, 2018). However, there have been few improvements to harm prevention measures for EGMs, which are the source of most gambling problems (Browne et al., 2023). Instead, “responsible gambling” measures in clubs, hotels, and casinos where EGMs are located throughout Australia continue to be based on an informed choice model that assumes that almost all consumers will make rational choices about their gambling if they are provided with sufficient information (Blaszczynski, Ladouceur, & Shaffer, 2004). Clearly, this approach has been insufficient to reduce the current levels of gambling harm. Further efforts will be needed to achieve the stated objectives of Australian governments to prevent and reduce harm across the severity spectrum. Doing so will not just reduce this direct harm-to-self that can be experienced across several life domains (Browne et al., 2016; Langham et al., 2015), but will also lessen its follow-on impacts on HRQoL and on affected others (Castrén, Lind, Hagfors, & Salonen, 2021; Hing, Russell, Browne, et al., 2022; Li, Browne, Rawat, Langham, & Rockloff, 2017; Lind, Castrén, Hagfors, & Salonen, 2022; Salonen, Alho, & Castrén, 2016; Suomi, Lucas, Dowling, & Delfabbro, 2023).
EGMs are implicated as the most harmful form of gambling in both self-reports and our statistical analyses, along with poker, race betting, sports betting, skin gambling, scratchies and loot box purchasing. These findings are consistent with previous research (Binde et al., 2017; Browne et al., 2023; Delfabbro et al., 2020; Hing et al., 2023; Mazar et al., 2020). More frequent use of these forms increases the risk of gambling harm even after controlling for some demographic factors (other aspects of individual vulnerability e.g. personality traits, were not included in this study). Nevertheless, his indicates that these products are harmful not just to people with individual characteristics that might increase vulnerability, but present a unique risk of harm for consumers who more frequently use them. At the population level, this risk is amplified for inherently risky products that are also widely used, notably EGMs, race betting and sports betting. Therefore, the authors believe that to best reduce aggregate harm in the population, gambling harm reduction measures need to focus on these products. However, there have been virtually no attempts in Australia to decrease the harmful structural characteristics of EGMs and their easy accessibility in nearly every suburb, while the harmful features of wagering products have continued to increase. For example, bettors now have instant access to wagering from anywhere at any time; wagering advertising, push marketing and inducements have proliferated; and betting opportunities for continuous gambling that fosters impulsive gambling, persistence and loss-chasing have expanded (Hing, Smith, et al., 2022; Lopez-Gonzalez et al., 2018; Newall et al., 2019, 2021). Harm reduction efforts will remain suboptimal unless they also address harmful gambling products and environments.
Poker, loot box purchasing, and skin gambling were also found to have a high inherent risk of gambling harm, but are used by only a small proportion of Australian adults. Previous research has noted the elevated rates of gambling problems amongst people who use novel gambling forms (Garea, Drummond, Sauer, Hall, & Williams, 2021; Greer, Rockloff, Hing, Browne, & King, 2023; Hing et al., 2023; Spicer et al., 2021; Wardle, Petrovskaya, & Zendle, 2020; Yokumitsu et al., 2021). Considering their low current uptake, banning these products would cause minimal inconvenience while also protecting current and future users. Alternatively, at a minimum, consumer protection measures for other online gambling products should be available for these novel products, including age-gating, limit-setting, self-exclusion, and help service information.
This study also found that using an online mode of gambling increases the risk of harm, after controlling for gambling frequency on different forms and demographics. Research indicates inconsistent findings on whether it is the online mode itself (Allami et al., 2021; Hing, Russell, & Black, 2022) or the greater number of forms that online gamblers tend to engage in (Afifi, LaPlante, Taillieu, Dowd, & Shaffer, 2014; Baggio et al., 2017; Gainsbury, Russell, Wood, Hing, & Blaszczynski, 2015; LaPlante, Nelson, LaBrie, & Shaffer, 2011, 2014; Philander & MacKay, 2014) that heightens the risk of gambling problems. Nonetheless, there is ample evidence that online gambling elevates instant 24/7 access, speed of betting, lack of scrutiny, receipt of gambling inducements, and harmful gambling behaviours such as persistence, loss-chasing and impulsive gambling (Hing, Cherney, et al., 2015; Hing, Thorne, et al., 2022; McCormack & Griffiths, 2013; Lopez-Gonzalez, Estévez, & Griffiths, 2019; Wood & Williams, 2011). Access to online gambling using smartphones has almost certainly further increased the risk of gambling harm (Drakeford & Hudson-Smith, 2015; Gainsbury, Liu, Russell, & Teichert, 2016; Hing, Thorne et al., 2022; James, O'Malley, & Tunney, 2017; Parke & Parke, 2019). A pragmatic view is that access to online and smartphone gambling is unlikely to be restricted. Therefore, harm reduction measures should focus on reducing risky industry products and practices, including inducements and push marketing, and opportunities for continuous gambling, as well as increasing consumer protection measures such as mandatory precommitment (Hing, Thorne et al., 2022).
This study also identifies subgroups who are most at-risk of gambling harm. As found elsewhere (Raybould et al., 2021; Tu et al., 2014), gambling in Australia presents a health inequality problem because gambling harm may increase health disparities amongst already disadvantaged or vulnerable populations, including Aboriginal or Torres Strait Islanders, those who speak a language other than English at home, younger people and those with less education. This inequity in the distribution of gambling harm may present a social justice issue that disadvantages people and limits their chances of living healthier lives. Governments should not just reduce gambling harm, but also provide adequate resources and support for population subgroups who are disproportionately affected. Examples include access to culturally-appropriate gambling support services, consumer education that is targeted to appropriate groups, and integrated services that can help to address both gambling harm and comorbid health issues. Co-designing these measures with health equity groups who have lived experience of gambling harm is likely to optimise their effectiveness.
Limitations
Because the survey was designed to focus on online gambling, all online gamblers were retained to ensure a sufficient sample for analysis. Oversampling online gamblers, and under-sampling land-based only gamblers, may have biased the total sample, although weighting was used to make it as representative as possible. Only mobile phone numbers were included, which excludes the ∼2% of Australian adults with access only to a landline. The survey had a low response rate (4.5%), although weighting against standard population variables improved its representativeness. However, weighting only partially addresses this issue, since participants who are contactable and agree to take part may differ in unknown ways from those who do not. Declining response rates in population surveys have been a significant issue for some time, decreasing from around 40% in 2008 to 6.0% in 2018 (American Association for Public Opinion Research, 2017; Kennedy & Hartig, 2019). Future population surveys may need to consider innovative ways to improve the degree to which inference can be made from the obtained sample to the desired population or be resourced to enable multimodal data collection methods. As part of the survey design, participants who non-regularly gambled only on lotteries and/or bingo were not asked the PGSI or gambling harm questions. There is some evidence that these forms have virtually nil unique association with gambling problems in Australia (Browne et al., 2023). However, other recent evidence, including from this study, suggests that some people do experience harm from lottery gambling (Granero et al., 2023). Future studies might include people who play lottery only, to further understand this issue.
Conclusions
This study has analysed gambling-related harm to consider its extent and distribution in the Australian population, as well as how gambling products, gambling mode, and demographic factors contribute to this risk. The greatest population-level HRQoL decrements were distributed across lower and medium severity levels, rather than concentrated among those with severe gambling problems. These results further support the ‘prevention paradox’ and help to dispel the notion that gambling harms affect only the small proportion of people classified as “problem gamblers”. Instead, harm can be experienced by gambling consumers across all risk groups. Rather than being an issue confined to “vulnerable” people, gambling harm is an inherent risk that accompanies the consumption of many gambling products. Most gambling harm in Australia is attributable to EGMs, race betting and sports betting, because these are inherently risky products that are also widely used. Poker and novel gambling products are also inherently risky, but are used by fewer people. These findings should focus attention on the need to modify the structural and situational features of gambling products and environments that amplify their risk of harm. The study has also revealed that gambling harm exacerbates health disparities for already disadvantaged and vulnerable groups, indicating the need for appropriately targeted resources and support, in addition to more rigorous gambling harm reduction measures.
Appendix
Table A1.
Figure 1 data: proportion of people who experience each number of harms or more by gamblers and Australian adult population
| Frequency | Gamblers | Population (including gamblers) |
| 1+ | 14.73% | 8.38% |
| 2+ | 8.64% | 4.92% |
| 3+ | 5.42% | 3.09% |
| 4+ | 3.44% | 1.96% |
| 5+ | 2.63% | 1.49% |
| 6+ | 1.92% | 1.09% |
| 7+ | 1.39% | 0.79% |
| 8+ | 1.03% | 0.58% |
| 9+ | 0.53% | 0.30% |
| 10 | 0.21% | 0.12% |
Note: Gamblers reporting harm only, proportion of zero harms are 85.27% (gamblers), 91.62% (population), population weighting.
Table A2.
Figure 2 data: proportion of people in each PGSI risk category who experience each number of harms or more
| PGSI Categories cumulative proportions | ||||
| Harms | NP* | LR | MR | PG |
| % | % | % | % | |
| 1+ | 5.12 | 38.04 | 75.78 | 96.40 |
| 2+ | 1.52 | 19.10 | 57.79 | 95.50 |
| 3+ | 0.45 | 7.14 | 41.18 | 91.89 |
| 4+ | 0.07 | 2.33 | 26.30 | 78.38 |
| 5+ | 0.05 | 0.66 | 16.96 | 74.77 |
| 6+ | 0.00 | 0.17 | 7.61 | 71.17 |
| 7+ | 0.00 | 0.00 | 3.81 | 56.76 |
| 8+ | 0.00 | 0.00 | 1.04 | 46.85 |
| 9+ | 0.00 | 0.00 | 0.35 | 25.23 |
| 10 | 0.00 | 0.00 | 0.35 | 9.91 |
* Gamblers reporting harm only. Subsample weight.
Footnotes
Funding sources: Funding for this study was provided by Gambling Research Australia, a partnership between the Commonwealth, State and Territory Governments to initiate and manage a national gambling research program.
Authors' contribution: NH led the study on which the current paper is based. All authors except CT helped to design the overall study and the survey instrument. CT, MB and AR drafted the methods section. CT conducted the statistical analyses, compiled the results tables, and drafted the results section. NH completed the remainder of the first draft of the manuscript. All authors refined and approved the submitted version of the manuscript.
Conflicts of interest: The authors declare no conflicts of interest in relation to this manuscript.
References
- Abbott, M. W. (2020). The changing epidemiology of gambling disorder and gambling-related harm: Public health implications. Public Health, 184, 41–45. 10.1016/j.puhe.2020.04.003. [DOI] [PubMed] [Google Scholar]
- ACIL Allen Consulting, Deakin University (Dowling, A. & Merkouris, S.), Central Queensland University (Browne, M. & Rockloff, M.), & the Social Research Centre (2018). Fourth social and economic impact study of gambling in Tasmania: Report 2. Hobart: Tasmanian Department of Treasury and Finance. https://www.acilallen.com.au/projects/other/fourth-social-and-economic-impact-study-of-gambling-in-tasmania. [Google Scholar]
- Afifi, T. O., LaPlante, D. A., Taillieu, T. L., Dowd, D., & Shaffer, H. J. (2014). Gambling involvement: Considering frequency of play and the moderating effects of gender and age. International Journal of Mental Health and Addiction, 12, 283–294. 10.1007/s11469-013-9452-3. [DOI] [Google Scholar]
- Allami, Y., Hodgins, D. C., Young, M., Brunelle, N., Currie, S., Dufour, M., … Nadeau, L. (2021). A meta‐analysis of problem gambling risk factors in the general adult population. Addiction, 116(11), 2968–2977. 10.1111/add.15449. [DOI] [PMC free article] [PubMed] [Google Scholar]
- American Association for Public Opinion Research (2017). The future of U.S. general population telephone survey research. Retrieved from https://www.aapor.org/getattachment/Education-Resources/Reports/Future-of-Telephone-Survey-Research-Report.pdf.aspx. [Google Scholar]
- Baggio, S., Dupuis, M., Berchtold, A., Spilka, S., Simon, O., & Studer, J. (2017). Is gambling involvement a confounding variable for the relationship between Internet gambling and gambling problem severity? Computers in Human Behavior, 71, 148–152. 10.1016/j.chb.2017.02.004. [DOI] [Google Scholar]
- Binde, P., Romild, U., & Volberg, R. A. (2017). Forms of gambling, gambling involvement and problem gambling: Evidence from a Swedish population survey. International Gambling Studies, 17(3), 490–507. 10.1080/14459795.2017.1360928. [DOI] [Google Scholar]
- Blaszczynski, A., Ladouceur, R., & Shaffer, H. J. (2004). A science-based framework for responsible gambling: The Reno model. Journal of Gambling Studies, 20, 301–317. 10.1023/B:JOGS.0000040281.49444.e2. [DOI] [PubMed] [Google Scholar]
- Brazier, J. E., & Roberts, J. (2004). The estimation of a preference-based measure of health from the SF-12. Medical Care, 42(9), 851–859. http://www.jstor.org/stable/4640827. [DOI] [PubMed] [Google Scholar]
- Browne, M., Bellringer, M., Greer, N., Kolandai-Matchett, K., Langham, E., Rockloff, M., … Abbott, M. (2017). Measuring the burden of gambling harm in New Zealand. Wellington: Ministry of Health. https://www.health.govt.nz/system/files/documents/publications/measuring_the_burden_of_gambling_harm_in_new_zealand.pdf. [Google Scholar]
- Browne, M., Delfabbro, P., Thorne, H., Tulloch, C., Rockloff, M., Hing, N., … Stevens, M. (2023). Unambiguous evidence that over half of gambling problems in Australia are caused by electronic gambling machines: Results from a large-scale composite population study. Journal of Behavioral Addictions, 12(1), 182–193. 10.1556/2006.2022.00083. [DOI] [PMC free article] [PubMed] [Google Scholar]
- Browne, M., Goodwin, B. C., & Rockloff, M. J. (2018). Validation of the short gambling harm screen (SGHS): A tool for assessment of harms from gambling. Journal of Gambling Studies, 34, 499–512. 10.1007/s10899-017-9698-y. [DOI] [PubMed] [Google Scholar]
- Browne, M., Langham, E., Rawat, V., Greer, N., Li, E., Rose, J., … Best, T. (2016). Assessing gambling-related harm in Victoria: A public health perspective. Melbourne: Victorian Responsible Gambling Foundation. https://responsiblegambling.vic.gov.au/resources/publications/assessing-gambling-related-harm-in-victoria-a-public-health-perspective-69/. [Google Scholar]
- Browne, M., Newall, P., Rawat, V., Tulloch, C., Rockloff, M., Li, E., … Begg, S. (2022). The Gambling Harms Scales: Instruments to assess impact to gamblers and affected others that are benchmarked to health utility. Melbourne: Victorian Responsible Gambling Foundation. https://responsiblegambling.vic.gov.au/resources/publications/the-gambling-harms-scales-instruments-to-assess-impact-to-gamblers-and-affected-others-that-are-benchmarked-to-health-utility-1206/. [Google Scholar]
- Browne, M., Rawat, V., Newall, P., Begg, S., Rockloff, M., & Hing, N. (2020). A framework for indirect elicitation of the public health impact of gambling problems. BMC Public Health, 20(1), 1717. 10.1186/s12889-020-09813-z. [DOI] [PMC free article] [PubMed] [Google Scholar]
- Browne, M., Rawat, V., Tulloch, C., Murray-Boyle, C., & Rockloff, M. (2021). The evolution of gambling-related harm measurement: Lessons from the last decade. International Journal of Environmental Research and Public Health, 18(9), 4395. 10.3390/ijerph18094395. [DOI] [PMC free article] [PubMed] [Google Scholar]
- Browne, M., & Rockloff, M. J. (2018). Prevalence of gambling-related harm provides evidence for the prevention paradox. Journal of Behavioral Addictions, 7(2), 410–422. 10.1556/2006.7.2018.41. [DOI] [PMC free article] [PubMed] [Google Scholar]
- Browne, M., & Rockloff, M. J. (2020). Measuring behavioural dependence in gambling: A case for removing harmful consequences from the assessment of problem gambling pathology. Journal of Gambling Studies, 36(4), 1027–1044. 10.1007/s10899-019-09916-2. [DOI] [PubMed] [Google Scholar]
- Browne, M., Rockloff, M., Hing, N., Russell, A., Murray Boyle, C., Rawat, V., … Sproston, K. (2020). NSW gambling survey 2019. Sydney: NSW Responsible Gambling Fund. https://www.gambleaware.nsw.gov.au/resources-and-education/check-out-our-research/published-research/nsw-gambling-survey-2019. [Google Scholar]
- Canale, N., Vieno, A., & Griffiths, M. D. (2016). The extent and distribution of gambling-related harms and the prevention paradox in a British population survey. Journal of Behavioral Addictions, 5(2), 204–212. 10.1556/2006.5.2016.023. [DOI] [PMC free article] [PubMed] [Google Scholar]
- Castrén, S., Lind, K., Hagfors, H., & Salonen, A. H. (2021). Gambling-related harms for affected others: A Finnish population-based survey. International Journal of Environmental Research and Public Health, 18(18), 9564. 10.3390/ijerph18189564. [DOI] [PMC free article] [PubMed] [Google Scholar]
- Delfabbro, P., King, D. L., Browne, M., & Dowling, N. A. (2020). Do EGMs have a stronger association with problem gambling than racing and casino table games? Evidence from a decade of Australian prevalence studies. Journal of Gambling Studies, 36, 499–511. 10.1007/s10899-020-09950-5. [DOI] [PubMed] [Google Scholar]
- Department of Social Services (DSS) (2018). National consumer protection framework for online wagering in Australia – national policy statement. Retrieved from https://www.dss.gov.au/sites/default/files/documents/11_2018/national-policy-statement.pdf.
- Drakeford, B. P., & Hudson-Smith, M. (2015). Mobile gambling: Implications of accessibility. Journal of Research Studies in Business & Management, 1(1), 3–28. https://scholar.archive.org/work/rwjn3csas5cutnqgjoh4ppiqdi/access/wayback/http://www.jrsbm.com/wp-content/uploads/2015/07/JRSBM-Vol-1-Drakeford.pdf. [Google Scholar]
- Ferris, J., & Wynne, H. (2001). The Canadian problem gambling index: Final report. Canadian Centre on Substance Abuse. Retrieved from https://www.greo.ca/Modules/EvidenceCentre/files/Ferris%20et%20al(2001)The_Canadian_Problem_Gambling_Index.pdf. [Google Scholar]
- Gainsbury, S. M., Liu, Y., Russell, A. M., & Teichert, T. (2016). Is all internet gambling equally problematic? Considering the relationship between mode of access and gambling problems. Computers in Human Behavior, 55, 717–728. 10.1016/j.chb.2015.10.006. [DOI] [Google Scholar]
- Gainsbury, S. M., Russell, A. M. T., Wood, R., Hing, N., & Blaszczynski, A. (2015). How risky is internet gambling? A comparison of subgroups of internet gamblers based on problem gambling status. New Media & Society, 17(6), 861–879. 10.1177/14614448135181. [DOI] [Google Scholar]
- Garea, S. S., Drummond, A., Sauer, J. D., Hall, L. C., & Williams, M. N. (2021). Meta-analysis of the relationship between problem gambling, excessive gaming and loot box spending. International Gambling Studies, 21(3), 460–479. 10.1080/14459795.2021.1914705. [DOI] [Google Scholar]
- Goodwin, B. C., Browne, M., Rockloff, M., & Rose, J. (2017). A typical problem gambler affects six others. International Gambling Studies, 17(2), 276–289. 10.1080/14459795.2017.1331252. [DOI] [Google Scholar]
- Granero, R., Fernández-Aranda, F., Mena-Moreno, T., Pino-Gutierrez, A. del, Codina, E., Gómez-Peña, M., Moragas, L., … Jimenez-Murcia, S. (2023). Phenotype of gambling disorder patients with lotteries as a preferred form of gambling. International Journal of Mental Health and Addiction, 21(5), 3306–3329. 10.1007/s11469-022-00793-2. [DOI] [Google Scholar]
- Greer, N., Rockloff, M., Hing, N., Browne, M., & King, D. L. (2023). Skin gambling contributes to gambling problems and harm after controlling for other forms of traditional gambling. Journal of Gambling Studies, 39, 225–247. 10.1007/s10899-022-10111-z. [DOI] [PMC free article] [PubMed] [Google Scholar]
- Hilbrecht, M., Baxter, D., Abbott, M., Binde, P., Clark, L., Hodgins, D. C., … Williams, R. J. (2020). The conceptual framework of harmful gambling: A revised framework for understanding gambling harm. Journal of Behavioral Addictions, 9(2), 190–205. 10.1556/2006.2020.00024. [DOI] [PMC free article] [PubMed] [Google Scholar]
- Hing, N., Breen, H., Gordon, A., & Russell, A. (2014). Gambling harms and gambling help-seeking amongst Indigenous Australians. Journal of Gambling Studies, 30, 737–755. 10.1007/s10899-013-9388-3. [DOI] [PubMed] [Google Scholar]
- Hing, N., Cherney, L., Gainsbury, S., Lubman, D., Wood, R., & Blaszczynski, A. (2015). Maintaining and losing control during internet gambling: A qualitative study of gamblers’ experiences. New Media and Society, 17(7), 1075–1095. 10.1177/1461444814521140. [DOI] [Google Scholar]
- Hing, N., Rockloff, M., & Browne, M. (2023). Adoption, adaptation or exposure? Novel digital gambling activities and links with gambling problems. Current Addiction Reports, 10, 254–261. 10.1007/s40429-023-00473-8. [DOI] [Google Scholar]
- Hing, N., Russell, A. M., Black, A., Rockloff, M., Browne, M., Rawat, V., … Woo, L. (2022). Gambling prevalence and gambling problems amongst land-based-only, online-only and mixed-mode gamblers in Australia: A national study. Computers in Human Behavior, 132, 107269. 10.1016/j.chb.2022.107269. [DOI] [Google Scholar]
- Hing, N., Russell, A. M. T., Browne, M., Rockloff, M., Greer, N., Rawat, V., … Woo, L. (2021). The second national study of interactive gambling in Australia (2019-20). Sydney: Gambling Research Australia. https://www.gamblingresearch.org.au/publications/new-second-national-study-interactive-gambling-australia-2019-20. [Google Scholar]
- Hing, N., Russell, A. M., Browne, M., Rockloff, M., Tulloch, C., Rawat, V., … Woo, L. (2022). Gambling-related harms to concerned significant others: A national Australian prevalence study. Journal of Behavioral Addictions, 11(2), 361–372. 10.1556/2006.2022.00045. [DOI] [PMC free article] [PubMed] [Google Scholar]
- Hing, N., Russell, A. M. T., Gainsbury, S. M., & Blaszczynski, A. (2015). Characteristics and help-seeking behaviors of Internet gamblers based on most problematic mode of gambling. Journal of Medical Internet Research, 17(1), e3781. 10.2196/jmir.3781. [DOI] [PMC free article] [PubMed] [Google Scholar]
- Hing, N., Smith, M., Rockloff, M., Thorne, H., Russell, A. M. T., Dowling, N., & Breen, H. (2022). How structural changes in online gambling are shaping the contemporary experiences and behaviours of online gamblers: An interview study. BMC Public Health, 22, 1620. 10.1186/s12889-022-14019-6. [DOI] [PMC free article] [PubMed] [Google Scholar]
- Hing, N., Thorne, H., Russell, A. M. T., Newall, P., Lole, L., Rockloff, M., … Tulloch, C. (2022). Immediate access … everywhere you go’: A grounded theory study of how smartphone betting can facilitate harmful sports betting behaviours amongst young adults. Published online 10 October 2022. International Journal of Mental Health & Addiction. 10.1007/s11469-022-00933-8. [DOI] [Google Scholar]
- Hunger, M., Baumert, J., & Holle, R. (2011). Analysis of SF-6D index data: Is beta regression appropriate? Value in Health: The Journal of the International Society for Pharmacoeconomics and Outcomes Research, 14(5), 759–767. 10.1016/j.jval.2010.12.009. [DOI] [PubMed] [Google Scholar]
- IBM Corp (2020). IBM SPSS Statistics for Windows, Version 27.0. [Google Scholar]
- James, R. J. E., O'Malley, C., & Tunney, R. J. (2017). Understanding the psychology of mobile gambling: A behavioural synthesis. British Journal of Psychology, 108(3), 608–625. 10.1111/bjop.12226. [DOI] [PMC free article] [PubMed] [Google Scholar]
- Kennedy, C., & Hartig, H. (2019). Response rates in telephone surveys have resumed their decline. Retrieved from https://www.pewresearch.org/short-reads/2019/02/27/response-rates-in-telephone-surveys-have-resumed-their-decline/.
- Langham, E., Thorne, H., Browne, M., Donaldson, P., Rose, J., & Rockloff, M. (2015). Understanding gambling related harm: A proposed definition, conceptual framework, and taxonomy of harms. BMC Public Health, 16, 1–23. 10.1186/s12889-016-2747-0. [DOI] [PMC free article] [PubMed] [Google Scholar]
- LaPlante, D. A., Nelson, S. E., & Gray, H. M. (2014). Breadth and depth involvement: Understanding Internet gambling involvement and its relationship to gambling problems. Psychology of Addictive Behaviors, 28, 396–403. 10.1037/a0033810. [DOI] [PubMed] [Google Scholar]
- LaPlante, D. A., Nelson, S. E., LaBrie, R. A., & Shaffer, H. J. (2011). Disordered gambling, type of gambling and gambling involvement in the British Gambling Prevalence Survey 2007. The European Journal of Public Health, 21(4), 532–537. 10.1093/eurpub/ckp177. [DOI] [PMC free article] [PubMed] [Google Scholar]
- Li, E., Browne, M., Rawat, V., Langham, E., & Rockloff, M. (2017). Breaking bad: Comparing gambling harms among gamblers and affected others. Journal of Gambling Studies, 33(1), 223–248. 10.1007/s10899-016-9632-8. [DOI] [PubMed] [Google Scholar]
- Lind, K., Castrén, S., Hagfors, H., & Salonen, A. H. (2022). Harm as reported by affected others: A population-based cross-sectional Finnish gambling 2019 study. Addictive Behaviors, 129, 107263. 10.1016/j.addbeh.2022.107263. [DOI] [PubMed] [Google Scholar]
- Lopez-Gonzalez, H., Estévez, A., & Griffiths, M. D. (2019). Internet-based structural characteristics of sports betting and problem gambling severity: Is there a relationship? International Journal of Mental Health and Addiction, 17, 1360–1373. 10.1007/s11469-018-9876-x. [DOI] [Google Scholar]
- Lopez-Gonzalez, H., & Griffiths, M. D. (2018). Understanding the convergence of markets in online sports betting. International Review for the Sociology of Sport, 53(7), 807–823. 10.1177/1012690216680602. [DOI] [Google Scholar]
- Mazar, A., Zorn, M., Becker, N., & Volberg, R. A. (2020). Gambling formats, involvement, and problem gambling: Which types of gambling are more risky? BMC Public Health, 20, 1–10. 10.1186/s12889-020-08822-2. [DOI] [PMC free article] [PubMed] [Google Scholar]
- McCormack, A., & Griffiths, M. D. (2013). A scoping study of the structural and situational characteristics of internet gambling. International Journal of Cyber Behavior, Psychology and Learning (IJCBPL), 3(1), 29–49. 10.4018/ijcbpl.2013010104. [DOI] [Google Scholar]
- McLauchlan, J., Browne, M., Russell, A. M. T., & Rockloff, M. (2020). Evaluating the reliability and validity of the Short Gambling Harm Screen: Are binary scales worse than likert scales at capturing gambling harm? Journal of Gambling Issues, 44, 103–120. 10.4309/jgi.2020.44.6. [DOI] [Google Scholar]
- Murray Boyle, C., Browne, M., Rockloff, M. J., & Thorne, H. B. (2022). Validating the short gambling harm screen against external benchmarks. Journal of Behavioral Addictions, 11(4), 994–1001. 10.1556/2006.2022.00075. [DOI] [PMC free article] [PubMed] [Google Scholar]
- National Centre for Research Methods (2011). What to do if the assumption of proportional odds is not met. Retrieved from www.resto re.ac.uk/srme/www/fac/soc/wie/resea rch-new/srme/modules/mod5/9/index.html. [Google Scholar]
- Newall, P. W., Moodie, C., Reith, G., Stead, M., Critchlow, N., Morgan, A., & Dobbie, F. (2019). Gambling marketing from 2014 to 2018: A literature review. Current Addiction Reports, 6, 49–56. 10.1007/s40429-019-00239-1. [DOI] [Google Scholar]
- Newall, P. W., Russell, A. M., & Hing, N. (2021). Structural characteristics of fixed-odds sports betting products. Journal of Behavioral Addictions, 10(3), 371–380. 10.1556/2006.2021.00008. [DOI] [PMC free article] [PubMed] [Google Scholar]
- Parke, A., & Parke, J. (2019). Transformation of sports betting into a rapid and continuous gambling activity: A grounded theoretical investigation of problem sports betting in online settings. International Journal of Mental Health and Addiction, 17(6), 1340–1359. 10.1007/s11469-018-0049-8. [DOI] [Google Scholar]
- Paterson, M., Leslie, P., & Taylor, M. (2019). 2019 ACT gambling survey. Canberra: Australian National University Centre for Gambling Research. https://csrm.cass.anu.edu.au/centres/cgr/2019-act-gambling-survey. [Google Scholar]
- Philander, K. S., & MacKay, T. L. (2014). Online gambling participation and problem gambling severity: Is there a causal relationship? International Gambling Studies, 14(2), 214–227. 10.1080/14459795.2014.893585. [DOI] [Google Scholar]
- Price, A., Hilbrecht, M., & Billi, R. (2021). Charting a path towards a public health approach for gambling harm prevention. Journal of Public Health, 29, 37–53. 10.1007/s10389-020-01437-2. [DOI] [PMC free article] [PubMed] [Google Scholar]
- Raybould, J. N., Larkin, M., & Tunney, R. J. (2021). Is there a health inequality in gambling related harms? A systematic review. BMC Public Health, 21(1), 1–17. 10.1101/19012104. [DOI] [PMC free article] [PubMed] [Google Scholar]
- Rockloff, M., Browne, M., Hing, N., Thorne, H., Russell, A., Greer, N., … Sproston, K. (2019). Victorian population gambling and health study (2018–19). Melbourne: Victorian Responsible Gambling Foundation. https://responsiblegambling.vic.gov.au/resources/publications/victorian-population-gambling-and-health-study. [Google Scholar]
- Rockloff, M., Browne, M., Russell, A. M., Hing, N., Armstrong, T., & Greer, N. (2022). Legacy gambling harms: What are they and how long do they last? Journal of Behavioral Addictions, 11(4), 1002–1011. 10.1556/2006.2022.00073. [DOI] [PMC free article] [PubMed] [Google Scholar]
- Rose, G. (1981). Strategy of prevention: Lessons from cardiovascular disease. British Medical Journal (Clinical Research ed.), 282(6279), 1847. 10.1136/bmj.282.6279.1847. [DOI] [PMC free article] [PubMed] [Google Scholar]
- Rossow, I., & Romelsjö, A. (2006). The extent of the “prevention paradox” in alcohol problems as a function of population drinking patterns. Addiction, 101(1), 84–90. 10.1111/j.1360-0443.2005.01294.x. [DOI] [PubMed] [Google Scholar]
- Salonen, A. H., Alho, H., & Castrén, S. (2016). The extent and type of gambling harms for concerned significant others: A cross-sectional population study in Finland. Scandinavian Journal of Public Health, 44(8), 799–804. 10.1177/1403494816673529. [DOI] [PubMed] [Google Scholar]
- Salonen, A. H., Hellman, M., Latvala, T., & Castrén, S. (2018). Gambling participation, gambling habits, gambling-related harm, and opinions on gambling advertising in Finland in 2016. Nordic Studies on Alcohol and Drugs, 35(3), 215–234. 10.1177/1455072518765875. [DOI] [PMC free article] [PubMed] [Google Scholar]
- Spicer, S. G., Nicklin, L. L., Uther, M., Lloyd, J., Lloyd, H., & Close, J. (2021). Loot boxes, problem gambling and problem video gaming: A systematic review and meta-synthesis. New Media & Society, 24(4), 1001–1022. 10.1177/14614448211027175. [DOI] [Google Scholar]
- Stevens, M., Gupta, H., & Flack, M. (2019). Northern territory gambling prevalence and wellbeing survey report, 2018. Darwin: Menzies School of Health Research & the Northern Territory Government. https://industry.nt.gov.au/publications/business/publications/gambling-research/2018-nt-gambling-prevalence-and-wellbeing-survey. [Google Scholar]
- Suomi, A., Lucas, N., Dowling, N., & Delfabbro, P. (2023). Gambling harm experienced by children exposed to parental gambling: An online survey of Australians. Journal of Gambling Studies, 40(1), 181–200. 10.1007/s10899-023-10211-4. [DOI] [PMC free article] [PubMed] [Google Scholar]
- Suomi, A., Watson, N., & Butterworth, P. (2022). How many children are exposed to at-risk parental gambling in Australia? Results from a representative national sample. Addictive Behaviors, 130, 107305. 10.1016/j.addbeh.2022.107305. [DOI] [PubMed] [Google Scholar]
- Tu, D., Gray, R. J., & Walton, D. K. (2014). Household experience of gambling-related harm by socio-economic deprivation in New Zealand: Increases in inequality between 2008 and 2012. International Gambling Studies, 14(2), 330–344. 10.1080/14459795.2014.922112. [DOI] [Google Scholar]
- Tulloch, C., Browne, M., Hing, N., & Rockloff, M. (2021). The relationship between family gambling problems, other family stressors, and health indicators in a large population-representative sample of Australian adults. Journal of Gambling Studies, 37, 1139–1162. 10.1007/s10899-020-09990-x. [DOI] [PubMed] [Google Scholar]
- Tulloch, C., Browne, M., Hing, N., Rockloff, M., & Hilbrecht, M. (2022). How gambling harms the wellbeing of family and others: A review. International Gambling Studies, 22(3), 522–540. 10.1080/14459795.2021.2002384. [DOI] [Google Scholar]
- Tulloch, C., Browne, M., Hing, N., Rockloff, M., & Hilbrecht, M. (2023). Trajectories of wellbeing in people who live with gamblers experiencing a gambling problem: An 18-year longitudinal analysis of the Household, Income and Labour Dynamics in Australia (HILDA) survey. Plos One, 18(1), e0281099. 10.1371/journal.pone.0281099. [DOI] [PMC free article] [PubMed] [Google Scholar]
- Tulloch, C., Hing, N., Browne, M., Rockloff, M., & Hilbrecht, M. (2021). The effect of gambling problems on the subjective wellbeing of gamblers’ family and friends: Evidence from large-scale population research in Australia and Canada. Journal of Behavioral Addictions, 10(4), 941–952. 10.1556/2006.2021.00077. [DOI] [PMC free article] [PubMed] [Google Scholar]
- Tulloch, C., Hing, N., Browne, M., Rockloff, M., & Hilbrecht, M. (2022). Parental gambling and the health and wellbeing of children derived from two nationally representative cohorts of Australian children. Applied Research in Quality of Life, 17(5), 3049–3068. 10.1007/s11482-022-10052-0. [DOI] [Google Scholar]
- Volberg, R. A., Zorn, M., Williams, R. J., & Evans, V. (2021). Gambling harm and the prevention paradox in Massachusetts. ADDICTA: The Turkish Journal on Addictions, 8(3), 162–170. 10.5152/addicta.2021.21114. [DOI] [Google Scholar]
- Wardle, H., Petrovskaya, E., & Zendle, D. (2020). Defining the esports bettor: Evidence from an online panel survey of emerging adults. International Gambling Studies, 20(3), 487–499. 10.1080/14459795.2020.1826559. [DOI] [PMC free article] [PubMed] [Google Scholar]
- Wardle, H., Reith, G., Langham, E., & Rogers, R. D. (2019). Gambling and public health: We need policy action to prevent harm. BMJ, 365. 10.1136/bmj.l1807. [DOI] [PMC free article] [PubMed] [Google Scholar]
- Ware, J., & Sherbourne, C. D. (1992). The MOS 36-item short-form health survey (SF-36). I. Conceptual framework and item selection. Medical Care, 30(6), 473–483. [PubMed] [Google Scholar]
- Williams, R. J., Belanger, Y. D., Leonard, C. A., Stevens, R. M., Christensen, D. R., El-Guebaly, N., … McGrath, D. S. (2021). Indigenous gambling and problem gambling in Canada. Journal of Gambling Studies, 38, 67–85. 10.1007/s10899-021-10022-5. [DOI] [PubMed] [Google Scholar]
- Wood, R. T., & Williams, R. J. (2011). A comparative profile of the Internet gambler: Demographic characteristics, game-play patterns, and problem gambling status. New Media & Society, 13(7), 1123–1141. 10.1177/1461444810397650. [DOI] [Google Scholar]
- Yokomitsu, K., Irie, T., Shinkawa, H., & Tanaka, M. (2021). Characteristics of gamers who purchase loot box: A systematic literature review. Current Addiction Reports, 8, 481–493. 10.1007/s40429-021-00386-4. [DOI] [PMC free article] [PubMed] [Google Scholar]