

Abstract
Purpose
Track structure Monte Carlo (MC) codes have achieved successful outcomes in the quantitative investigation of radiation-induced initial DNA damage. The aim of the present study is to extend a Geant4-DNA radiobiological application by incorporating a feature allowing for the prediction of DNA rejoining kinetics and corresponding cell surviving fraction along time after irradiation, for a Chinese hamster V79 cell line, which is one of the most popular and widely investigated cell lines in radiobiology.
Methods
We implemented the Two-Lesion Kinetics (TLK) model, originally proposed by Stewart, which allows for simulations to calculate residual DNA damage and surviving fraction along time via the number of initial DNA damage and its complexity as inputs.
Results
By optimizing the model parameters of the TLK model in accordance to the experimental data on V79, we were able to predict both DNA rejoining kinetics at low linear energy transfers (LET) and cell surviving fraction.
Conclusions
This is the first study to demonstrate the implementation of both the cell surviving fraction and the DNA rejoining kinetics with the estimated initial DNA damage, in a realistic cell geometrical model simulated by full track structure MC simulations at DNA level and for various LET. These simulation and model link between mechanistic physical/chemical damage processes and these two specific biological endpoints.
Keywords: Geant4-DNA, Monte Carlo simulation, DNA damage, Cell Survival
I. Introduction
As a result of a large amount of effort by researchers in the field of radiobiological simulation, many dedicated track structure Monte Carlo (MC) simulation codes have been developed for the investigation of radiobiological phenomena by simulating the transport of particles and the diffusion of radiolytic species in the cell, as well as the subsequent physical/chemical reactions with biological components of the cell that result in DNA damage1–4. Such radiation induced initial DNA damage can be categorized into two types, either direct damage or indirect damage. Direct damage is created by interactions between DNA molecules and primary/secondary carriers of ionizing radiation. Similarly, indirect damage is created by interactions with radiolytic species produced during irradiation (typically reactive oxygen species such as hydroxyl radicals)5. Track structure MC codes have achieved successful outcomes for quantitatively investigating radiation-induced initial DNA damage (both direct and indirect damage) within subcellular biological components. In particular, KURBUC6–8, PARTRAC9–12, RITRACKS13,14 and Geant4-DNA15–18 have demonstrated decent simulation performance for estimating initial DNA damage after irradiation of a variety of biological targets, for instance, simple DNA fiber, plasmid, bare cell nucleus, and entire cell as well19–23. In addition, TOPAS-nBio24,25, which is a Geant4-DNA based MC simulation tool, provides a user-friendly interface to create advanced simulations with a library of biological geometries26. Because these MC simulation codes/tools have already acquired the ability to estimate radiation induced initial DNA damage, the current aim of their development has shifted to link between initial DNA damage and subsequent biological endpoints. For instance, a Geant4-DNA application is currently able to predict the kinetics of proteins associated with DNA repair processes after ionizing radiation delivery27 using a fully integrated simulation application across physics, chemistry, and biology22. In a previous study, the Geant4-DNA simulation demonstrated good agreement with experimental data on accumulated γ-H2AX (the phosphorylated H2AX protein) yields (foci) after gamma irradiation on a normal human fibroblast cell22. The foci prediction functionality allows us to understand a portion of the radiobiological phenomena in fibroblast cells after irradiation.
As the next step of the development of radiobiological applications, a current challenge is to include a prediction model of cell survival for the investigation of the relation between initial DNA damage and cell death. A typical type of radiobiological endpoint, cell death (usually measured as cell surviving fraction (SF)28,29) is mostly triggered by complex DNA damage, as represented by a double-strand break (DSB), in the case such complex damage remains after biological repair processes as residual DNA damage. The probability of cell death depends on the complexity of the initial DNA damage. For this reason, as discussed in many microdosimetric/nanodosimetric studies30–33, SF is influenced by particle type and energy, since it is to the microscopic energy deposition pattern in the region surrounding DNA molecules that conditions the DNA damage complexity.
The aim of the present study is to extend the Geant4-DNA radiobiological application22 by adding a feature to predict DNA repair kinetics and corresponding SF along time after irradiation, in particular for the Chinese hamster V79 cell line that is one of the most popular and widely investigated cell lines in radiobiology. For the development of this application, we introduce the Two-Lesion Kinetics (TLK) model originally proposed by Stewart34, which allows to calculate residual DNA damage and SF along time using as inputs the number of initial DNA damage and its complexity. Basic aspects of the development of this application are available in the PhD work by Tang35. However, in the study by Tang, the agreement of the calculated SF and experimental SF measured by Belli et al36 had been demonstrated in only one specific condition ). In this study, we integrated a more sophisticated approach into the Geant4-DNA application. We attempted to achieve agreement between the calculated SFs and the experimental SFs in a wider LET range and also to reach agreement with the experimental data when calculating the fraction of unrejoined DNA37, simultaneously.
II. Materials and Methods
The probability of cell death at a specific irradiation condition depends on the irradiated cell line, since the capacity and the speed of the repair process against DNA damage can vary among cell lines. Therefore, in the TLK model, the model parameters that represent the repair speed and the lethality must be optimized for each cell line separately. For the present study, we introduced the parameter-reduced TLK model (six parameters) under the same assumptions as in the original study by Stewart34. In this work, we optimize the TLK model parameters for the V79 cell line (described in Appendix A), using simulated DNA damage and its complexity given as inputs in the TLK model.
In the following sections, we first summarize how we estimate the initial DNA damage and its complexity (Section IIA). We then briefly describe the TLK model (Section IIB). Finally, we address the validation of the integrated application, calculating the fraction of indirect damage in various proton fields of interest (Section IIC). Of note, all developments and simulations are based upon Geant4 version 10.4.patch2. This application will be released as an example of the Geant4 code in an upcoming version.
A. Simulation configuration and initial DNA damage quantification
1. Geometrical model
The basic geometrical models of cell subcomponents, such as DNA fiber and chromatin fiber were originally developed in previous studies 19–21. Using the basic geometrical models, a cell geometry imitating the V79 cell has been constructed. The DNA fiber model consists of spherical backbone molecules (phosphate and deoxyribose) and ellipsoidal nucleobase molecules (guanine, adenine, cytosine, and thymine), which form a twisted DNA fiber known as a double-helix structure. The DNA fiber wraps around histone octamers (modeled as spheres) and is confined in the ellipsoidal cell nucleus surrounded by cytoplasm. In this work, as shown in Figure 1, the cell model is designed by imitating a V79 cell. At conditions adherent to the experiments, the typical thickness of the cell and cell nucleus are and , respectively 38. The total volume of the V79 cell monolayer (attached to a mylar foil) including both the nucleus and cytoplasm is about 39, and the volume of the nucleus is about 39. The base pairs (bp) are separately accommodated in 22 chromosomes40, and the number of bp is approximately 5.4 Gbp in total (the average bp length per chromosome is about 40). Thus, in this work, a long ellipsoidal cell nucleus is surrounded by an ellipsoid of water ) modeling the cytoplasm.
FIG. 1.
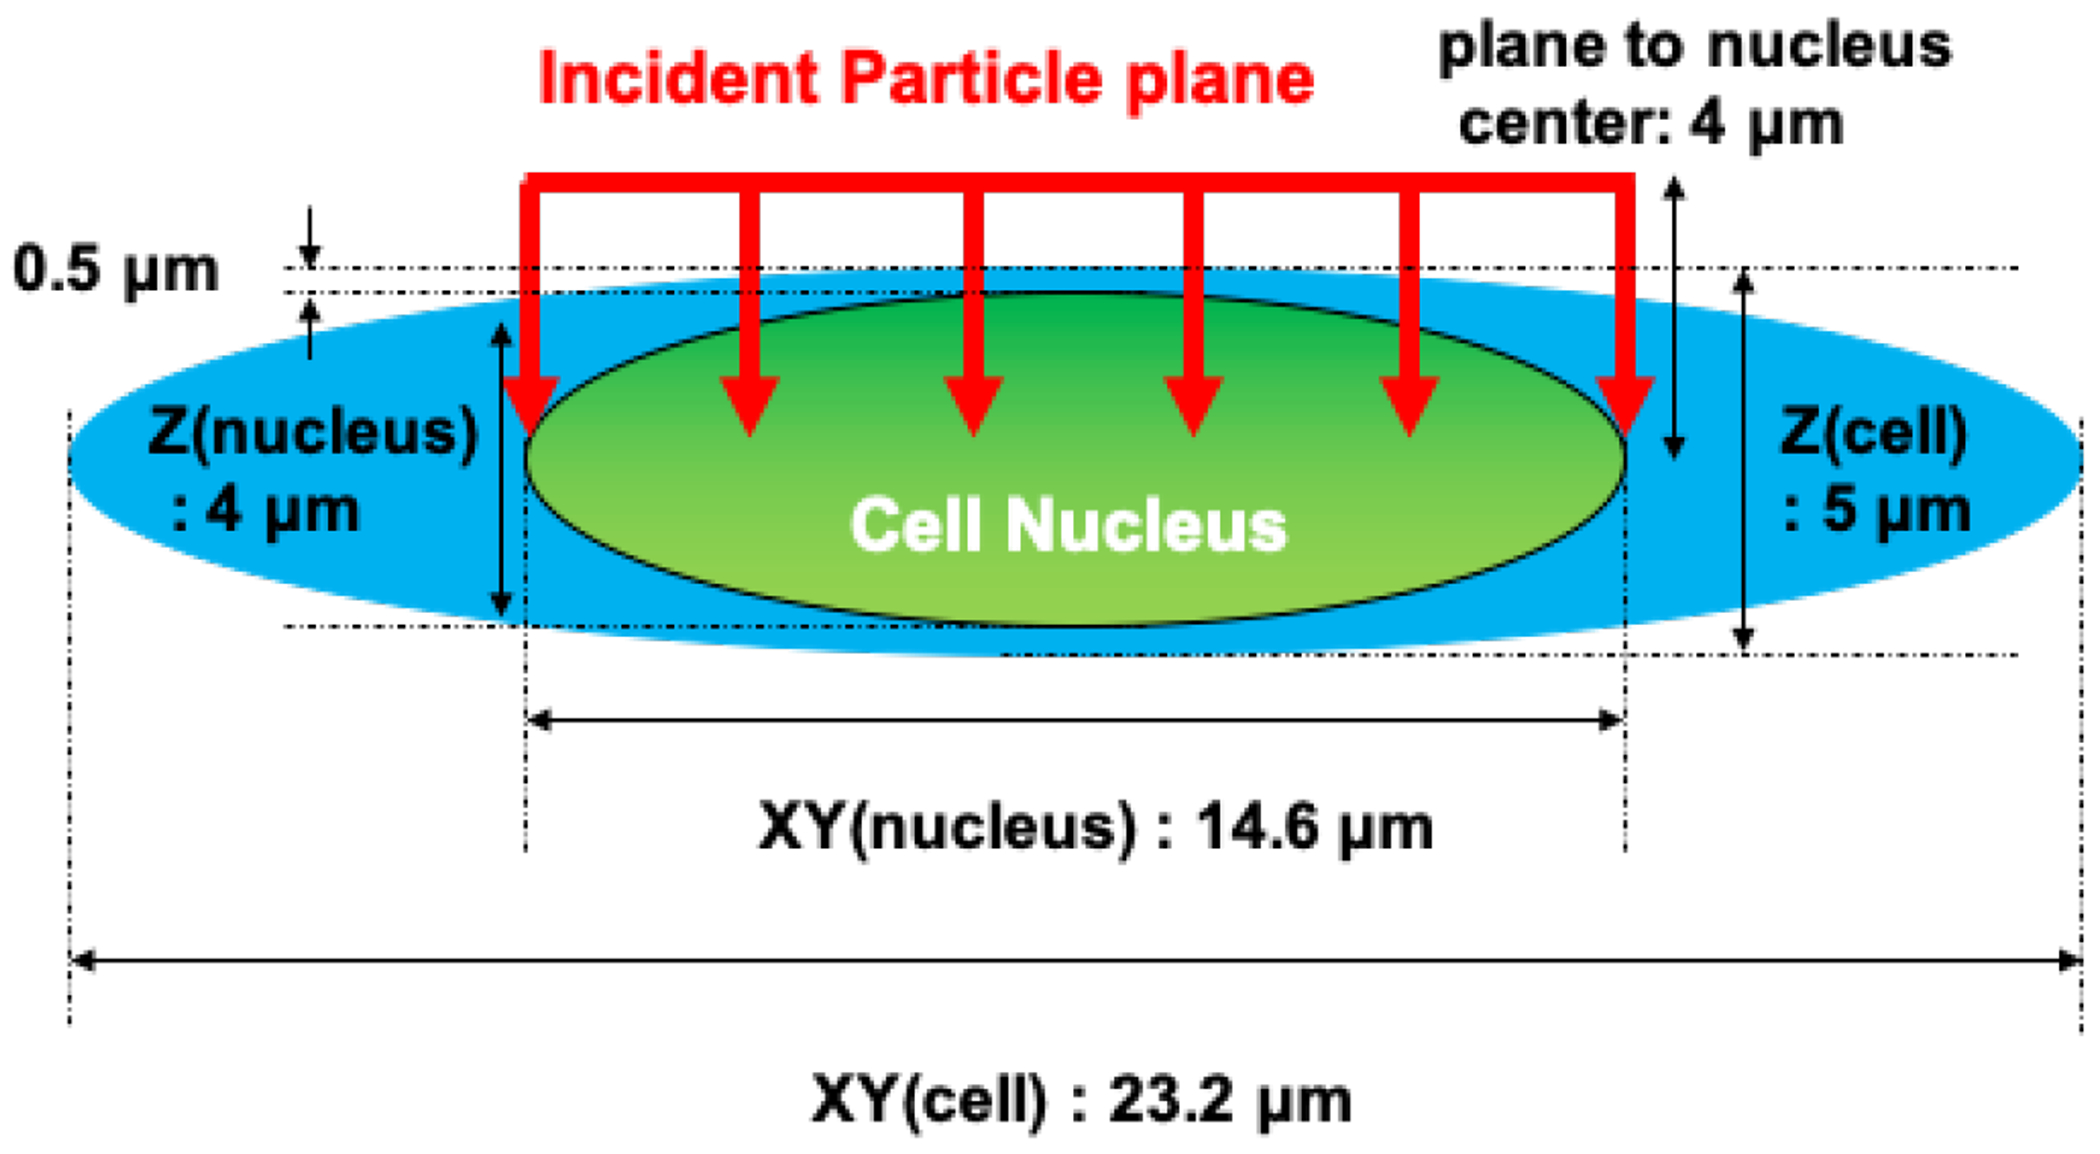
Geometrical model of a cell nucleus imitating a Chinese hamster V79 cell in the simulations. The number of base pairs wrapped in the cell nucleus is about 5.4 Gbp. The subgeometries of the cell nucleus have been described in the previous studies22.
In the experimental study that measured SF and the fraction of unrejoined DSBs (fraction of activity released (FAR)), the incident proton energies at the cell entrance were estimated36,37,41. The initial energies of the simulated protons were chosen to be 5.04, 3.24, 1.49, 0.88, 0.77, and 0.70 MeV, and the corresponding unrestricted LET values were 7.7, 11.0, 20.0, 30.5, 34.6, and 37.8 keV/μm at cell midplane (3 μm), as estimated in the references study by Belli et al36. In addition, although a substrate should usually be placed upstream (or downstream) of the beam line in irradiation experiments, in the present study, no substrate materials were placed surrounding the cell. The incident protons are irradiating directly the cell, as shown by red arrows in Figure 1. The radiation source was distributed homogeneously on a 14.6 μm diameter circle, corresponding to the two-dimensional profile of the cell nucleus.
2. Particle transport model and chemistry diffusion-reaction model
For particle transport in cells and reactions with the cell subcomponent, G4EmDNAPhysics_option42–46 was primarily used (above the high energy limit of the model, G4EmDNAPhysics_option2 is alternatively used, as done in previous studies22). These physics models are based on track structure approach and are developed to simulate the transport of protons, electrons, and photons. As in previous studies 21,22, we have used the independent-reaction time (IRT) method, to simulate the reaction and diffusion of radiolytic chemical species47. The parameters of the IRT method have been evaluated in a previous study22. As a result, the chemical diffusion time was limited up to 5.0 ns22, and all radiolytic species were killed when produced at a distance away from any DNA molecule centres22, because OH radicals cannot reach DNA molecules within 5.0 ns. The histones placed in the cell model were modeled as perfect scavengers for all radiolytic species. In other words, any free radiolytic species that entered a histone region will be stopped and excluded from the simulation. This leads to a reduction in DSB yield22.
3. Initial DNA damage scoring and damage classification
The model parameters scoring both direct and indirect damage were also evaluated in the previous study22. Direct damage was calculated using the proportional probability model, originally proposed by PARTRAC10, with accumulated deposited energy of both primary and secondary particles in the region surrounding the DNA molecule (which consists of sugar and phosphate) during one incident particle event. If the accumulated deposited energy in the scoring volume ( from the center of the DNA molecule of interest22) is less than , the accumulated deposition has no chance of resulting in direct damage. In addition, if the accumulated deposited energy is larger than , all accumulated energy will result in direct damage. Between 5 and , the probability of direct damage increases proportionally with the energy deposition. Indirect damage by a hydroxyl radical was determined using a probability of to induce a chemical reaction creating a damage when the radical is at the DNA molecule.22.
In this work, we classify damage types when scoring DNA damage to quantify yields of simple DSB and complex DSB, which are used as input to the TLK model to calculate the cell SF. The damage classification method used in this study was originally proposed by Nikjoo et al8, and was introduced in the Geant4-DNA application in previous studies21,22. DSBs can be considered as being two strand breaks (SB) on opposite strands within a short distance (typically within ). A requires a DSB and at least one additional within along the chromatin fibre segment, whereas a requires at least two DSBs. In the classification by Nikjoo, the most complex damage type was always assigned. Thus, even if a damage cluster was found more complex than , the cluster was categorized as . A minimum distance of 100 consecutive interval was defined to separate individual damage cluster. Nikjoo et al8 also proposed the classification scheme of DSB breaks by direct/indirect damage source. DSBs composed by two indirect damage are classified as , and those only by direct damage are classified as DSBdir. DSBhyb requires that the DSB does not occur in the absence of indirect damage when a segment contains both indirect and direct DSBs. Otherwise, a break caused by indirect and direct sources is classified as (the DSB occurs in the absence of indirect damage or direct damage).
B. Calculation of DNA rejoining kinetics and cell surviving fraction
The TLK model proposed by Stewart34 represents the kinetic processes of first- and second- order DNA repair linking the initial DNA damage to the residual DNA damage and subsequent cell death. First-order repair considers simple rejoining of break ends at the same position through the corresponding repair processes, in which the terms of the single order are proportional to , the yield of DSBs at the time . Likewise, binary DSB repairs (second-order repair), which can easily lead to a complex aberration (the incorrect rejoining of the break ends with two different DSBs, the so-called as binary misrepair) is considered as given with the terms which are proportional to . In these considerations, differential equations represent the kinetics of the DNA rejoin, listed as Eq. 1 and Eq. 2 below,
| (1) |
| (2) |
Here is the expected number of DSBs in fast repair per cell at the time from the start of irradiation ; similarly, is the expected number of DSBs in slow repair per cell at time from the start of irradiation and are the lesion production terms for DSBs in fast and slow repair, respectively, which are proportional to the dose rate multiplied by number of lesions per unit of dose and bp and number of bp in a cell . In this work, the instantaneous lesions are defined as and as classified by the definition of Nikjoo et al7. In general, simple DSB tends to be repaired through the fast-repair process, and complex DSB is repaired through a slow-repair process. and are the DSB rejoining rates for simple and complex DSBs, respectively. and are the DSB-DSB binary rejoining rates for simple–simple, complex–complex and simple–complex rejoining combinations, respectively. Similarly, and account for the rates by physiochemical fixation for simple and complex DSBs, respectively).
In the TLK model, two types of model parameters involved in cell death are introduced to calculate the probability of cell death: probability of misrepair and lethality of residual DNA damage. Here, we regard misrepaired DNA damage that remains after the repair processes; however, in reality, alternative repair processes are activated once nonhomologous end joining (NHEJ) repair failed via microhomology-mediated end joining (MMEJ), also known as alternative nonhomologous end-joining (Alt-NHEJ)48. Simple sublethal lesions (i.e., a first-order repair) can be removed from the DNA through biochemical processes that repair individual lesions without any chance for killing the cell, unless an important DNA component (such as a necessary gene) cannot be successfully repaired as a simple aberration. On the other hand, complex sublethal lesions can easily lead to a high chance of killing the cell. In particular, the aberrations (such as dicentrics, acentric rings, and binary-misrepair) are crucial for cell survival. Hence, to link between initial DNA damage and cell death, it is important to first estimate the probability of misrepair that can potentially lead to cell death as well as the lethality that is a fraction of misrepair leading to cell death.
Accounting for the probability of correctly repaired damage ( and ) and the lethality of residual DSBs , the yield of lethal lesions can be calculated as,
| (3) |
where and represent the probabilities of correctly repaired damage in simple and complex DSBs, respectively. The probabilities and describe the partitioning of misrepaired damage into lethal and nonlethal genetic alterations for each repair type. For example, means that if the DSB was not repaired correctly in the fast-repair process regarded as misrepair, the DSB always produces a lethal lesion. As in the original study by Stewart34, in order to reduce the number of adjustable parameters, the following additional (ad-hoc) equality conditions (i–iv) are imposed in this work: (i) the probability of correctly repaired damage is assumed to be 0 as (1-a) , (ii) the rates of DSB fixation is set to , (iii) the rate of binary repair is identical to and (iv) the lethality of binary misrepair is identical to . Under these conditions, Eqs.(1–3) are simplified to
| (4) |
| (5) |
and
| (6) |
Finally, these yields are numerically integrated to calculate the SF,
| (7) |
The differential equation has been solved numerically by means of the fourth-order Runge-Kutta method in the boost/numerical C++ library.
To calculate the DNA unrejoined fraction and SF, we set model parameters of the TLK model for the experimental condition as described in the reference study by Belli et al37. The delivered dose for the unrejoined DNA fraction was 45 Gy at a dose rate of . For the SF calculations, the dose rate was set to , and the SFs were scored 16 days after irradiation. Given that the number of colonies was counted after 7 days from irradiation in the reference experimental study36,49, we calculateed the SF at hours. The time step of the integration was set to hour. We note that the half-repair time of the rejoining can be calculated by , if the repair process is not saturated.
The fraction of activity released (FAR) measured by gel-electrophoresis methods is used to quantify the number and size of fragments obtained by breaking of the DNA fiber, such as that induced by DSBs50,51. Thus, calculating the ratio between FAR and initial FAR, we can estimate the quantity representing the fraction of unrejoined DSBs. According to the random-breakage model37,52,53, the relation between FAR and the number of the unrejoined DSBs can be calculated using the following equation:
| (8) |
where is the maximum fraction of the DNA that can enter the gel plug, is the average DNA length in a chromosome, and is the detection limit length. In this study, was set to , and as estimated by Belli et al37. Finally, the fraction of unrejoined DSBs is calculated as the relative FAR, and the FAR values were scaled by applying , where is the time when the irradiation was stopped.
C. Protectable damage fraction
By integrating the TLK model into the Geant4-DNA application, we calculated the fraction of the damage produced via indirect action (protectable damage). Experimentally, the protectable damage fraction can be measured from the maximum degree of protection (DP) at an infinite dimethylsulfoxide (DMSO) concentration56,57. DMSO has been used as scavenger of radiolytic free radical species, in particular hydroxyl radical. DMSO is permeated among the cells before irradiation at various concentrations. The experimental DP is defined as follows:
| (9) |
where and are the measured at 0 mol of DMSO and the assumed SF at infinite DMSO concentration, respectively. Moreover, the maximum DP can be obtained as the value at the point of intersection of the regression where the concentration of DMSO is infinite , with the equation given by:
| (10) |
where is the density of DSMO, is the slope, and is the intersection (at the limit of infinite DMSO concentration). Similarly, the DP can be calculated with the SFs of the Geant4-DNA application as follows:
| (11) |
where and are the calculated SFs with the initial DSB yields, which were simulated with- and without- chemistry simulations, respectively. In this study, is calculated with and at , where it is not affected by the SF enhancement known as the stochastic effect 33.
By using Nikjoo’s classification, as it was attempted in the previous study 22, it was also possible to calculate the fraction of protectable DSBs that cannot be classified as DSB without indirect damage by
| (12) |
where and are the numbers of and , respectively. We neglected the contribution of to the protectable damage fraction, because it cannot be clearly classified as protectable DSB or not. Because, in the reference 56,57, the scavengable fractions on the V79 cell line are measured by ion irradiation, the proton-induced and are shown as a function of unrestricted at the midplane of cell as evaluated by Belli et al37,41. We quote the DP value based on method2 evaluated for human fibroblast cells in the previous work. These quoted DP values are shown as a function of unrestricted LET at the cell entrance, which is recommended by the ICRU9058.
III. Results
A. Number of initial DSBs after irradiation
Figure 2 shows the yield of DSBs categorized as DSB, , and expressed as the number of breaks per unit absorbed dose (Gy) and per unit of DNA fiber length (Gbp). The yield of increases with the decrease in the incident proton energy, whereas the yield of DSB and is slightly decreasing. We repeated the same simulations without the chemistry interface to calculate the same yields created by direct action. All yields created by direct action were simply increasing with the decrease of the incident proton energy. The total yield of ) was almost consistent with the previous simulations22. For instance, the total yield of DSBs at in this study is 7.02 and was about at , although the geometry of the simulations was slightly different.
FIG. 2.
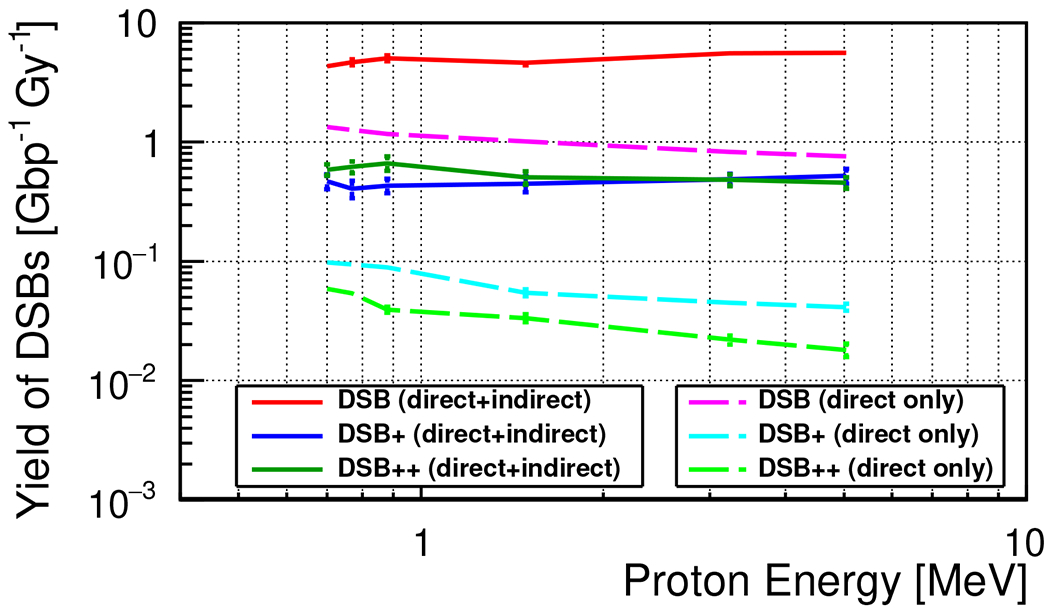
The average yield of DSBs for each damage type, as categorized by Nikjoo’s definition7. The results with the full simulation were labeled as “direct+indirect”, and the results of the simulations without the chemistry interface were labeled as “direct only”.
B. Optimized model parameters of the TLK model
The optimized parameters of the TLK model for V79 cell line are listed in Table I. The repair rate of the fast-repair process was about , and its half-repair time was about 35 minutes. Similarly, the repair rates were approximately and , for the slow repair and binary repair, respectively. In addition, the corresponding half-lives were 12 days and 22 years, respectively. The probability of the misrepair in the slow repair leading to cell death was approximately . The probability for fast-repair () was fixed at and that for binary-repair at at the maximum probability as the result of the optimization.
TABLE I.
Optimized repair parameters for V79 cell line
| 1.19 | 0.0 | 0.16 | 1.0 |
C. DNA rejoining kinetics
The fractions of unrejoined DSBs are shown in Figure 3. As shown in the left panel of the figure, the TLK model was able to reproduce the time evolution of the measured relative FAR (fraction of unrejoined DSBs). This is not surprising, as the data set is involved in the optimization of the TLK model parameters. On the contrary, the fractions with protons at the cell entrance level were not in agreement with the measured data that are not involved in the optimization, as shown in the right panel. This is caused by the limitation of the TLK model, which will be discussed in Section IV. It is worth noting that even if we include the data set for proton in the model parameter optimization process, it is not possible to obtain agreement with both measured data sets. For this reason, if we include both data sets in the optimization, the predicted model curve will be almost at the center in between these two data sets.
FIG. 3.
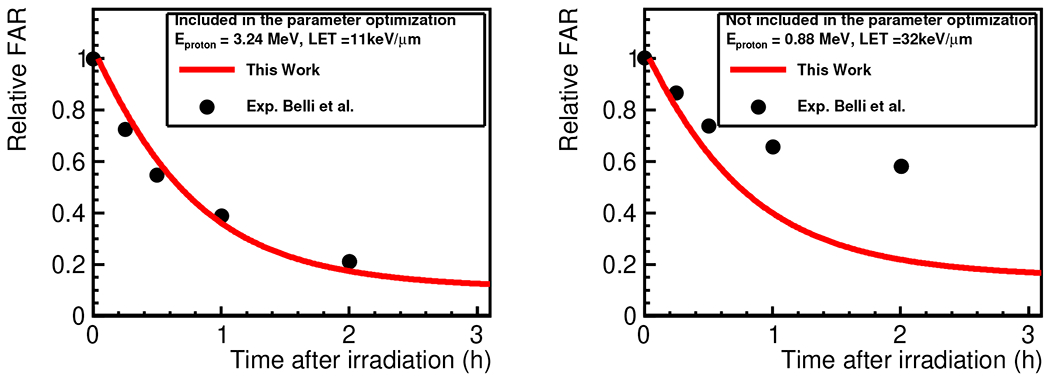
Relative FAR (fraction of unrejoined DSBs) for the V79 cell line as a function of time after irradiation. Left: The incident energy of a proton at the cell entrance is 3.24 MeV, and the experimental data were involved in the TLK model parameter optimization. Right: The incident energy of a proton at the cell entrance is 0.88 MeV, and the experimental data were not involved in the optimization.
D. Cell surviving fraction
Figure 4 shows the cell SF as a function of the delivered dose for each proton energy at the cell entrance (and the unrestricted LET value at cell midplane). Using the optimized parameters listed in Table I, the calculated survival curves are in a reasonable agreement with the measured fraction, although the calculated value underestimated the SFs at the highest energy (5.02 MeV). In addition, at the lowest energy (0.70 MeV), the calculations also underestimated the SFs in the high-dose domain ( Gy). This underestimation in the high-dose domain is well known as a “stochastic effect”33.
FIG. 4.
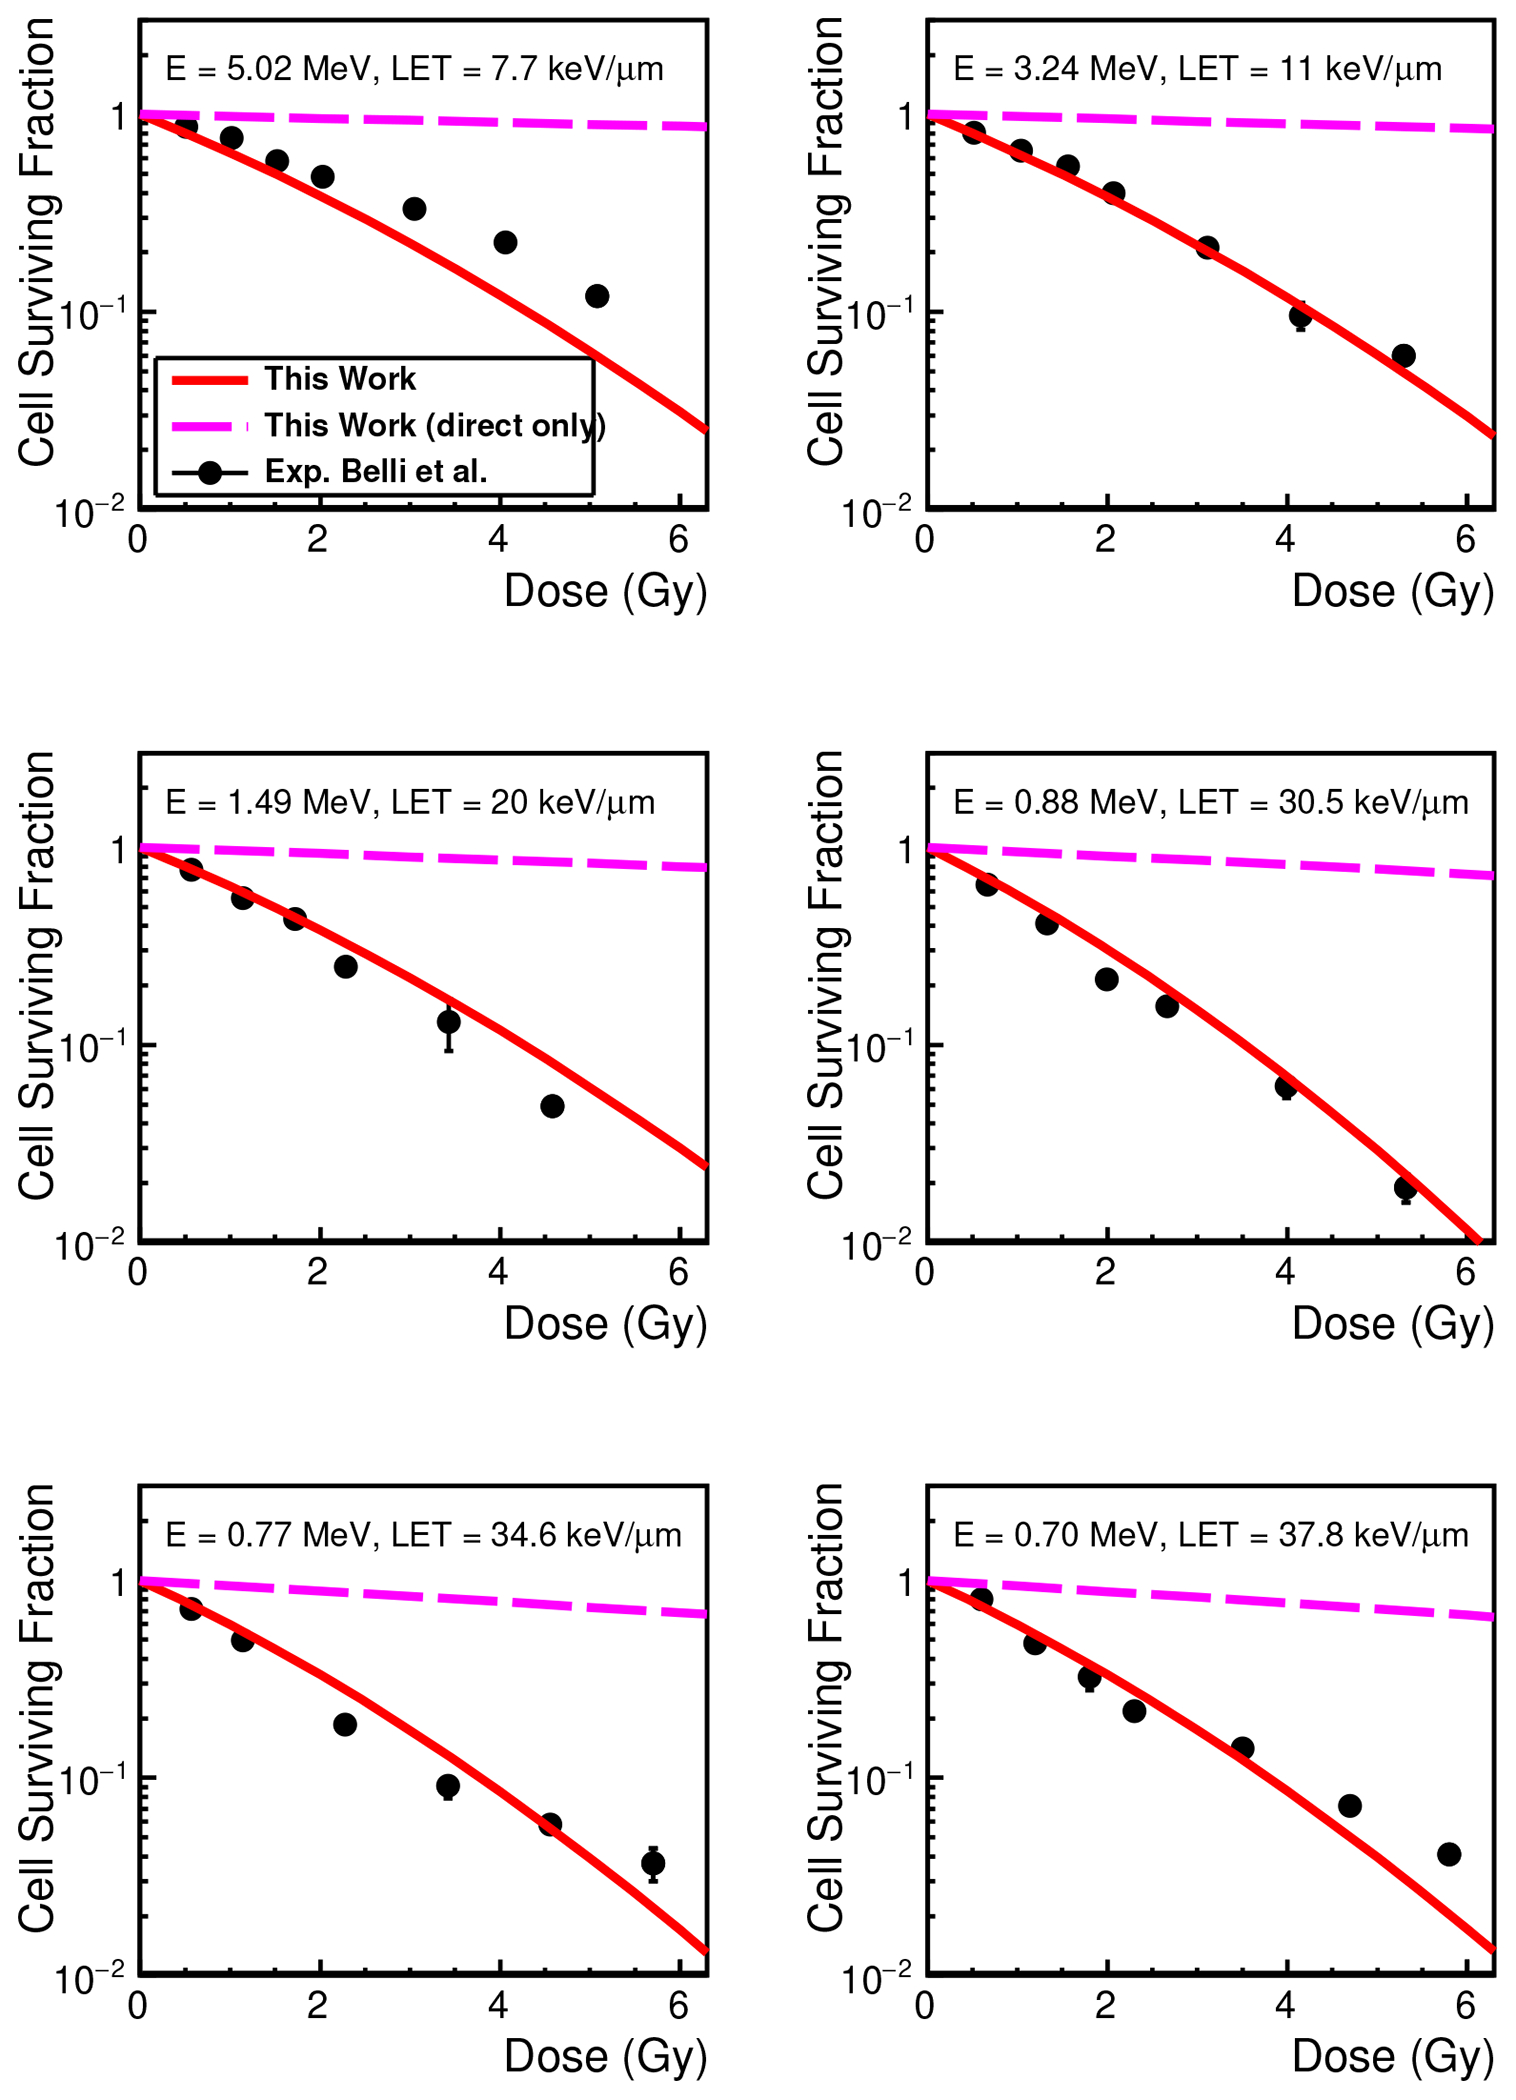
Cell surviving fraction of V79 cell line as a function of delivered dose. The results of the calculations using simulations without the chemistry interface are labeled as “direct only”.
E. Fraction of indirect damage (protectable damage fraction)
The fraction of indirect damage (protectable damage fraction) is shown in Figure 5. The fractions calculated by both method1 and method2 (see the definition in Section. IIC) are in reasonable agreement with the experimental fractions for C-ions measured by Ito et al56, despite the fact that the fractions were calculated and simulated for proton irradiation. In addition, both calculated protectable damage fractions are close to the calculated protectable damage fraction for human fibroblast cells, shown by Geant4-DNA(2020)22, even though the geometrical model of the cell is slightly different (the total number of bp is about in a human fibroblast cell model used in the Geant4-DNA (2020)22).
FIG. 5.
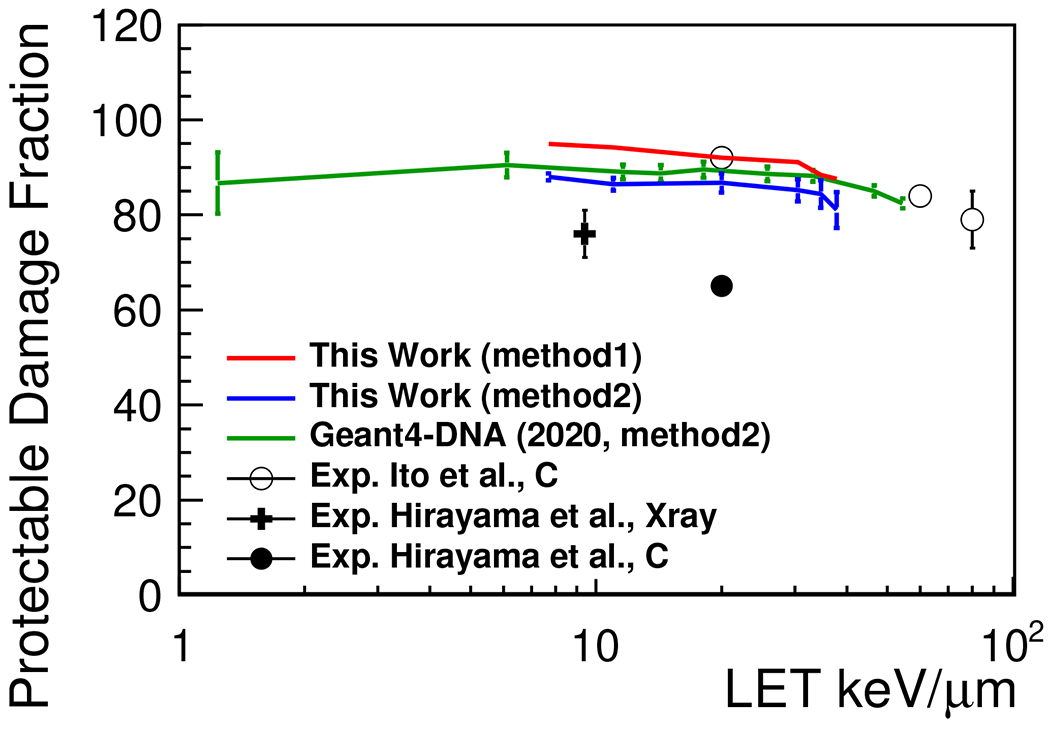
Protectable damage fraction (fraction of indirect damage) as a function of LET. Method1 is result of the calculation based on SF. Method2 is result of the calculation based on the damage classification. The experimental data on the V79 cell line are estimated as protectable damage fraction at the infinite DMSO concentration56,57.
The fractions calculated by method1 tended to be lower than that calculated by method2. A reason for this is that the contribution of protectable damage categorized as is ignored in this study. Throughout the study, the protectable damage fraction was fully validated using experimental data from equivalent methods (the definitions of method1 and the experimental method were sufficiently close to one another), although the source of the irradiation particle was different. Thus, it is now more evident that the developed integrated simulation application allows for the adequate estimation of direct and indirect damage.
IV. Discussion
As shown in Figure 2, excluding the chemical step, the yield of initial DSBs was clearly increasing with the decrease in incident proton energy (in other words, with an increase of LET value). This is consistent with the results of the protectable damage fraction as shown in Figure 5. The simulated DSBs that were categorized as the most complex DSBs in Nikjoo’s classification increased with the increase of LET. This is the reason why, at low proton energy range, the yield of and can increase while the yield of DSB decreases. And this is the primary reason why the SF values at a high LET were decreasing with an increase in the LET, because in this study, we consider only complex DNA damage (complex DSBs and binary DSBs) as lethal damage ( and are assigned a nonzero value). We succeeded in optimizing the TLK model parameters in such a way that the calculated fraction of the unrejoined DSBs was consistent with the experimental data at a proton energy of about . However, using the same parameters, the calculated fraction did not agree with the experimental data at proton energy of about . This result indicates the limitation of the TLK model. In the TLK model, the second repair processes are not considered for the damage that cannot be repaired in the first repair. In nature, once the first repair process fails (e.g., in the NHEJ process), the DNA lesion will attempt to be repaired via different repair processes (Alt-NHEJ is a candidate for the second process for the lesion failure in NHEJ48). Subsequently, the cell attempts to repair the lesion more carefully than a first-repair process, which also means, that the second-repair process is usually slower than the first-repair. Moreover, if the lesion is impossible to repair, the cell gives up on repairing the lesion, and the lesion thus remains after repair failure. This could be the reason for the disagreement between the fraction of unrejoined DSBs at high LET. To obtain global agreement on the fraction of unrejoined DSBs for a wide LET range, we need to consider the handling of these lesions which is a failure in the first-repair process as in the studies by McMahon et al59 and by Belov et al27. It must be noted that, in the current study, we set equal to zero as in the original study by Stewart et al. This is the reason why even the fast-repair kinetics was not well demonstrated, although the error did not seem to propagate toward cell survival prediction.
As shown in Figure 4, the TLK model with the optimized parameters successfully reproduced as a whole the measured in an energy range between 0.70 and . However, at the proton energy of , the disagreement was observed for doses Gy. The energy range of interest in the study by Belli et al36,37 was narrow and focused on measurements in the low-energy domain. This might be the cause of the bias in the parameters on the low-energy side. Thus, we suggest that it is better to have a larger experimental data set for higher energy incident protons(). The TLK model also does not consider the “stochastic effect”. At high LET, the delivered dose to a part of the irradiated cells can be small due to the large variance of the dose distribution in the cell nucleus33,60. This is the reason for the disagreement in the high-dose domain at high LET. To apply this model at such high LET, further development is required for inclusion of the stochastic effect. At this stage, we need to evaluate the limit of overkill effect and consider the distribution of DSB yields. Furthermore, we emphasize that there is no guarantee that the optimized parameters can represent the repair performance of V79 cells under other experimental conditions. Indeed, the condition of the irradiated cells varies considerably among the studies; for example, cell cycle and cell confluency show numerous changes.
As a validation of the model, we have calculated the fraction of indirect damage in the experimental energy range. Experimentally, the fractions are estimated as the SFs with/without DMSO. In the previous study, we have calculated the fraction by using the yield of DSBs, categorized by Nikjoo’s classification. However, in this study, we succeeded in calculating the fraction with an equivalent definition in order to compare with the measured DP fraction. We found that the estimated fractions were close to both the measured fractions and the fractions by DSB classification. One of the reasons shows higher value than , is that underestimates the protectable fraction due to neglecting . In conclusion, this Geant4-DNA radiobiological application was rather reliably validated.
It should be noted that the optimized model parameters can describe rather well the cell’s characteristic repair performance. However, the experimental data are not sufficient to optimize the parameters for slow and binary processes sensitively, as we mentioned in Appendix A. In this study, we were able to determine the parameter set for calculating the fraction of unrejoined DSBs and SFs simultaneously, but the parameters might have large systematic uncertainties. To evaluate repair performance (or even to evaluate the systematic uncertainty), we need the measured fraction of unrejoined DSBs until a time which is equivalent with the half-life of the slow-repair process (a few dozen hours at least).
V. Conclusion
By integrating the TLK model into a Geant4-DNA radiobiological application, we successfully reproduced both the DNA rejoining kinetics at low LET and cell SF, simultaneously. This is the first study to develop a mechanistic model correlating both the cell SF and DNA rejoining kinetics with the estimated initial DNA damage in a realistic cell geometry simulated by track structure MC simulations at DNA level for various LET, thus, linking mechanistic physical/chemical damage processes and biological endpoints. We note three limitations of this study, which should be considered for further investigation. (1) We need to consider the second-repair process (and/or aborting repair) after the first-repair process fails. (2) To evaluate the cell’s repair performance, the maximum time range should be extended until a time at least comparable to the half-life of the slow-repair process. (3) To reduce biasing of the optimization, it is preferable to have more measured data obtained with higher energies protons.
Acknowledgements
D. Sakata acknowledges financial support from JSPS KAKENHI, grant number JP20K16840. A. Ristić Fira, I. Petrović and M. Djordjević wish to acknowledge financial support from the Ministry of Education, Science and Technological Development of Serbia and CNRS PICS #8070 France – Serbia Project. M. Bernal thanks the FAPESP foundation in Brazil (project no. 2011/51594-2, 2015/21873-8, 2018/15316-7 and 2020/08647-7) and the CNPq (project no. 306298/2018-0). I. Kyriakou and D. Emfietzoglou acknowledge financial support from the European Space Agency (ESA Contract No. 4000126645/19/NL/BW). J. Schuemann was supported by NIH/NCI grant number R01 CA187003. We thank the European Space Agency for funding support through the ”BioRad III” 4000132935/21/NL/CRS (2021-2023) contract.
A. Appendix: Model parameter optimization
The model parameters in Eqs.(4–6) were optimized for the V79 cell line in a manner consistent with the six experimental SF curves and one relative FAR curve. To optimize the parameters and solve the optimization problems, we used Ceres Solver 54, which is an open-source library based on a nonlinear least-squares method for solving optimization problems. In general, to solve the linear least squares problem form for the parameters , we need to determine the minimum of the key computational cost using the following formula:
| (A1) |
where is a matrix of an -dimensional vector of variables (the number of data points), and -dimensional function of (the number of optimized parameters), whereas is the Jacobian. We select SPARSE_NORMAL_CHOLESKY as the algorithm of the Jacobian factorization, given that the optimization problem is usually sparse. The residual cost for each data point was calculated as with the same weight for all configurations of both the and relative unrejoined , where was calculated as the value with simulated DSBs.
For the optimization, we had limitations on both the model side and experimental data side. On the model side, the parameter-reduced TLK model considered fast-, slow-, and binary-repair processes. All the damage were rejoined, once the damage was repaired through one of these repair processes (regardless the repair has succeeded or not), even when the repair failed. Additionally, the model did not consider second repair processes for the damage that could not be repaired during the first repair. Given the limitation, one unrejoined DSB curve was excluded from the optimization, although, in the experimental study by Belli et al.37, two unrejoined DSB curves were available. This has been discussed in Section IV. On the data set side, the maximum time range of the unrejoined DSB curve was about 2 hours from the irradiation. However, the speed of slow- and binary-repair was much slower (for instance, it takes dozens of hours to repair DNA damage via the HR process55). Thus, the reference data are not so sensitive toward the parameter optimization for the slow repair processes. Because of these limitations, we restricted the value range of all model parameters and set equal to 0.0, similar to that in the original study by Stewart34. In this study, the parameters were adjusted for optimization, subject to the following constraints: (equivalent to a 83 minutes and 4 minutes half-life, respectively), (equivalent to a half-life of 17 years and 83 minutes, respectively), (equivalent to a half-life of years and 17 years, respectively), set to , and .
References
- 1.Nikjoo H, et al. , Track structure in radiation biology: theory and applications, Int. J. Radiat. Biol 1998;73:355–364. [DOI] [PubMed] [Google Scholar]
- 2.Nikjoo H, et al. , Perspectives in radiation biophysics: From radiation track structure simulation to mechanistic models of DNA damage and repair, Rad. Phys. Chem 2016;128:3–10. [Google Scholar]
- 3.Nikjoo H, et al. , Radiation track, DNA damage and response—a review, Rep. Prog. Phys 2016;79:116601. [DOI] [PubMed] [Google Scholar]
- 4.Kyriakou I, et al. , Review of the Geant4-DNA simulation toolkit for radiobiological applications at the cellular and DNA level Cancers 2021;14(1):35. [DOI] [PMC free article] [PubMed] [Google Scholar]
- 5.Hemnani T, et al. , Reactive oxygen species and oxidative DNA damage, Ind. J Phys. Phar 1998;42:440–452. [PubMed] [Google Scholar]
- 6.Uehara S, et al. , Cross-section of water vapour for the Monte Carlo electrons track structure code from to the MeV region, Phys. Med. Biol 1993;38:1841–1858. [Google Scholar]
- 7.Nikjoo H, et al. , Computational modeling of low-energy electron-induced DNA damage by early physical and chemical events, Int. J. Radiat. Biol 1997;71:467–483. [DOI] [PubMed] [Google Scholar]
- 8.Nikjoo H, et al. , Computational approach for determining the spectrum of DNA damage induced by ionizing radiation, Rad. Res 2001;156:577–583. [DOI] [PubMed] [Google Scholar]
- 9.Friedland W, et al. , Monte Carlo simulation of the production of short DNA fragments by low-linear energy transfer radiation using higher-order DNA models, Rad. Res 1998;150:170–182 [PubMed] [Google Scholar]
- 10.Friedland W, et al. , Simulation of DNA damage after proton irradiation, Rad. Res 2003;159:401–410. [DOI] [PubMed] [Google Scholar]
- 11.Friedland W, et al. , Track structures, DNA targets and radiation effects in the biophysical Monte Carlo simulation code PARTRAC, Mutat. Res 2011;711:28–40. [DOI] [PubMed] [Google Scholar]
- 12.Friedland W, et al. Comprehensive track-structure based evaluation of DNA damage by light ions from radiotherapy-relevant energies down to stopping, Sci. Rep 2017;7:45161. [DOI] [PMC free article] [PubMed] [Google Scholar]
- 13.Plante I, et al. , Applications of Monte Carlo methods in biology, medicine and other fields of science, InTech; 2011. Monte-Carlo Simulation of Ionizing Radiation Tracks:315–356. [Google Scholar]
- 14.Plante I, et al. , Radiation physics and chemistry. September 2016. Vol. 139. Elsevier Ltd; 2017. Considerations for the Independent Reaction Times and Step-by-Step Methods for Radiation Chemistry Simulations:157–172. [Google Scholar]
- 15.Incerti S, et al. , The Geant4-DNA project, Int. J. Model. Simul. Sci. Comput 2009;1:157–178. [Google Scholar]
- 16.Incerti S, et al. , Comparison of Geant4 very low energy cross section models with experimental data in water, Med. Phys 2010;37:4692–4708. [DOI] [PubMed] [Google Scholar]
- 17.Bernal MA, et al. , Track structure modeling in liquid water: A review of the Geant4–DNA very low energy extension of the Geant4 Monte Carlo simulation toolkit, Phys. Med 2015;31:157–178. [DOI] [PubMed] [Google Scholar]
- 18.Incerti S, et al. , Geant4–DNA example applications for track structure simulations in liquid water: a report from the Geant4–DNA Project, Med. Phys 2018;45:e722–e739. [DOI] [PubMed] [Google Scholar]
- 19.Lampe N, et al. , Mechanistic DNA damage simulations in Geant4-DNA part 1: A parameter study in a simplified geometry, Phys. Med 2018;48:135–145. [DOI] [PubMed] [Google Scholar]
- 20.Lampe N, et al. , Mechanistic DNA damage simulations in Geant4-DNA part 2: Electron and proton damage in a bacterial cell, Phys. Med 2018;48:146–155. [DOI] [PubMed] [Google Scholar]
- 21.Sakata D, et al. , Evaluation of early radiation DNA damage in a fractal cell nucleus model using Geant4-DNA, Phys. Med 2019;62:152–157. [DOI] [PubMed] [Google Scholar]
- 22.Sakata D, et al. , Fully integrated Monte Carlo simulation for evaluating radiation induced DNA damage and subsequent repair using Geant4-DNA, Sci. Rep 2020;10:20788. [DOI] [PMC free article] [PubMed] [Google Scholar]
- 23.Meylan S, et al. , Simulation of early DNA damage after the irradiation of a fibroblast cell nucleus using Geant4-DNA, Sci. Rep 2017;7:11923. [DOI] [PMC free article] [PubMed] [Google Scholar]
- 24.Perl J, et al. , TOPAS: An innovative proton Monte Carlo platform for research and clinical applications, Med. Phys 2012;39:6818–6837. [DOI] [PMC free article] [PubMed] [Google Scholar]
- 25.Schuemann J, et al. , TOPAS-nBio: An extension to the TOPAS simulation toolkit for cellular and sub-cellular radiobiology, Rad. Res 2018;191:125–138. [DOI] [PMC free article] [PubMed] [Google Scholar]
- 26.McNamara AL, et al. , Geometrical structures for radiation biology research as implemented in the TOPAS-nBio toolkit, Phys. Med. Biol 2018;63:175018. [DOI] [PMC free article] [PubMed] [Google Scholar]
- 27.Belov OV, et al. , A quantitative model of the major pathways for radiation-induced DNA double-strand break repair, J. Theo. Biol 2015;366:115–130. [DOI] [PubMed] [Google Scholar]
- 28.Puck TT, et al. , Rapid method for viable cell titration and clone production with HeLa cells in tissue culture: the use of X-irradiated cells to supply conditioning factors, Proc. Natl. Acad. Sci 1995;41:432–437. [DOI] [PMC free article] [PubMed] [Google Scholar]
- 29.Puck TT, et al. , Action of X rays on mammalian cells, J Exp. Med 1956;103:653–666. [DOI] [PMC free article] [PubMed] [Google Scholar]
- 30.Sørensen BS, et al. , In vitro RBE-LET dependence for multiple particle types, Acta. Oncol 2011;50:757–762. [DOI] [PubMed] [Google Scholar]
- 31.Goodhead DT, Initial events in the cellular effects of ionizing radiations: clustered damage in DNA, Int. J. Radiat. Biol 1994;65:7–17. [DOI] [PubMed] [Google Scholar]
- 32.Liamsuwan T, et al. , Microdosimetry of low-energy electrons, Int. J. Radiat. Biol 2012;88:899–907. [DOI] [PubMed] [Google Scholar]
- 33.Sato T, et al. , Cell survival fraction estimation based on the probability densities of domain and cell nucleus specific energies using improved microdosimetric kinetic models, Rad. Res 2012;178:341–356. [DOI] [PubMed] [Google Scholar]
- 34.Stewart RD, Two-lesion kinetic model of double-strand break rejoining and cell killing, Rad. Res 2001;156:365–378. [DOI] [PubMed] [Google Scholar]
- 35.Tang N. Évaluation, à partir de modélisations nanodosimétriques, de l’influence de la compaction de la chromatine sur les effets radio-induits précoces et extension aux effets tardifs (réparation des dommages à l’ADN et mort cellulaire). phD thesis (Written in French) from the University of Bordeaux; (France: ). [Google Scholar]
- 36.Belli M, et al. , RBE-LET relationships for cell inactivation and mutation induced by low energy protons in V79 cells: further results at the LNL facility, Int. J. Rad. Biol 1998;74:501–509. [DOI] [PubMed] [Google Scholar]
- 37.Belli M, et al. , DNA DSB induction and rejoining in V79 cells irradiated with light ions: a constant field gel electrophoresis study, Int. J. Rad. Biol 2000;76:1095–1104. [DOI] [PubMed] [Google Scholar]
- 38.de Lara CM, et al. , Dependence of the yield of DNA double-strand breaks in Chinese hamster V79-4 cells on the photon energy of ultrasoft X rays, Rad. Res 2001;155:440–448. [DOI] [PubMed] [Google Scholar]
- 39.Siragusa M, et al. , Radiobiological effects of tritiated water short-term exposure on V79 clonogenic cell survival, Int. J. Radiat. Biol 2018;94:157–165. [DOI] [PubMed] [Google Scholar]
- 40.Blöcher D, In CHEF electrophoresis a linear induction of DSB corresponds to a nonlinear fraction of extracted DNA with dose, Int. J. Radiat. Biol 1990;57:7–12. [DOI] [PubMed] [Google Scholar]
- 41.Belli M, et al. , DNA Fragmentation in mammalian cells exposed to various light ions, Adv. Space Res 2001;27:393–399. [DOI] [PubMed] [Google Scholar]
- 42.Emfietzoglou D, Inelastic cross-sections for electron transport in liquid water: a comparison of dielectric models, Radiat. Phys. Chem 2003;66:373–385. [Google Scholar]
- 43.Kyriakou I, et al. , The impact of new Geant4-DNA cross section models on electron track structure simulations in liquid water, J. Appl. Phys 2016;119:194902. [Google Scholar]
- 44.Kyriakou I, et al. , Technical Note: Improvements in Geant4 energy-loss model and the effect on low-energy electron transport in liquid water, Med. Phys 2015;42:3870–3876. [DOI] [PubMed] [Google Scholar]
- 45.Bordage MC, et al. , Implementation of new physics models for low energy electrons in liquid water in Geant4-DNA, Phys. Med 2016;32:1833–1840. [DOI] [PubMed] [Google Scholar]
- 46.Kyriakou I, et al. , Microdosimetry of electrons in liquid water using the low-energy models of Geant4, J. Appl. Phys 2017;122:024303. [Google Scholar]
- 47.Green NJB, et al. , Stochastic modeling of fast kinetics in a radiation track, J Phys Chem. 1990;94:251–258. [Google Scholar]
- 48.McVey M, et al. , MMEJ repair of double-strand breaks (director’s cut): deleted sequences and alternative endings, Tren. Genet 2008;24:529–38. [DOI] [PMC free article] [PubMed] [Google Scholar]
- 49.Belli M, et al. , RBE-LET relationship for the survival of V79 cells irradiated with low energy protons, Int. J. Rad. Biol 1989;55:93–104. [DOI] [PubMed] [Google Scholar]
- 50.Kryndushkin DS, et al. , Yeast [PSI+] prion aggregates are formed by small Sup35 polymers fragmented by Hsp104, J. Biol. Chem 2003;278:49636–49643. [DOI] [PubMed] [Google Scholar]
- 51.Iliakis GE, et al. , Measurement of DNA double strand breaks in CHO cells at various stages of the cell cycle using pulse field gel electrophoresis: Calibrations by means of 125I decay, Int. J. Radiat. Biol 1991;59:343–357. [DOI] [PubMed] [Google Scholar]
- 52.Contopoulou CR, et al. , Analysis of DNA double strand breakage and repair using orthogonal field alternation gel electrophoresis, Yeast 1987;3:71–76. [DOI] [PubMed] [Google Scholar]
- 53.Cook VE, et al. , A quantitative model of DNA fragments generated by ionizing radiation, and possible experimental applications, Rad. Res 1991;125:102–106. [PubMed] [Google Scholar]
- 54. http://ceres-solver.org .
- 55.Zhiyong M, et al. , Comparison of nonhomologous end joining and homologous recombination in human cells, DNA Repair (Amst). 2008;7:1765–1771. [DOI] [PMC free article] [PubMed] [Google Scholar]
- 56.Ito A, et al. , Contribution of indirect action to radiation-induced mammalian cell inactivation: Dependence on photon energy and heavy-ion LET, Rad. Res 2006;165:703–712. [DOI] [PubMed] [Google Scholar]
- 57.Hirayama R, et al. , Contributions of direct and indirect actions in cell killing by high-LET radiations, Rad. Res 2009;171:212–218. [DOI] [PubMed] [Google Scholar]
- 58.Report 90: Key Data for Ionizing-Radiation Dosimetry: Measurement Standards and Applications, J. Int. Com. Rad. Units Meas 2016;14:1. [Google Scholar]
- 59.McMahon S, et al. , Mechanistic modelling of DNA repair and cellular survival following radiation-induced DNA damage, Sci. Rep 2016;6:33290. [DOI] [PMC free article] [PubMed] [Google Scholar]
- 60.Cordoni FG, et al. , Cell Survival Computation via the Generalized Stochastic Microdosimetric Model (GSM2); Part I: The Theoretical Framework, Rad. Res 2022;197(3):218–232. [DOI] [PubMed] [Google Scholar]