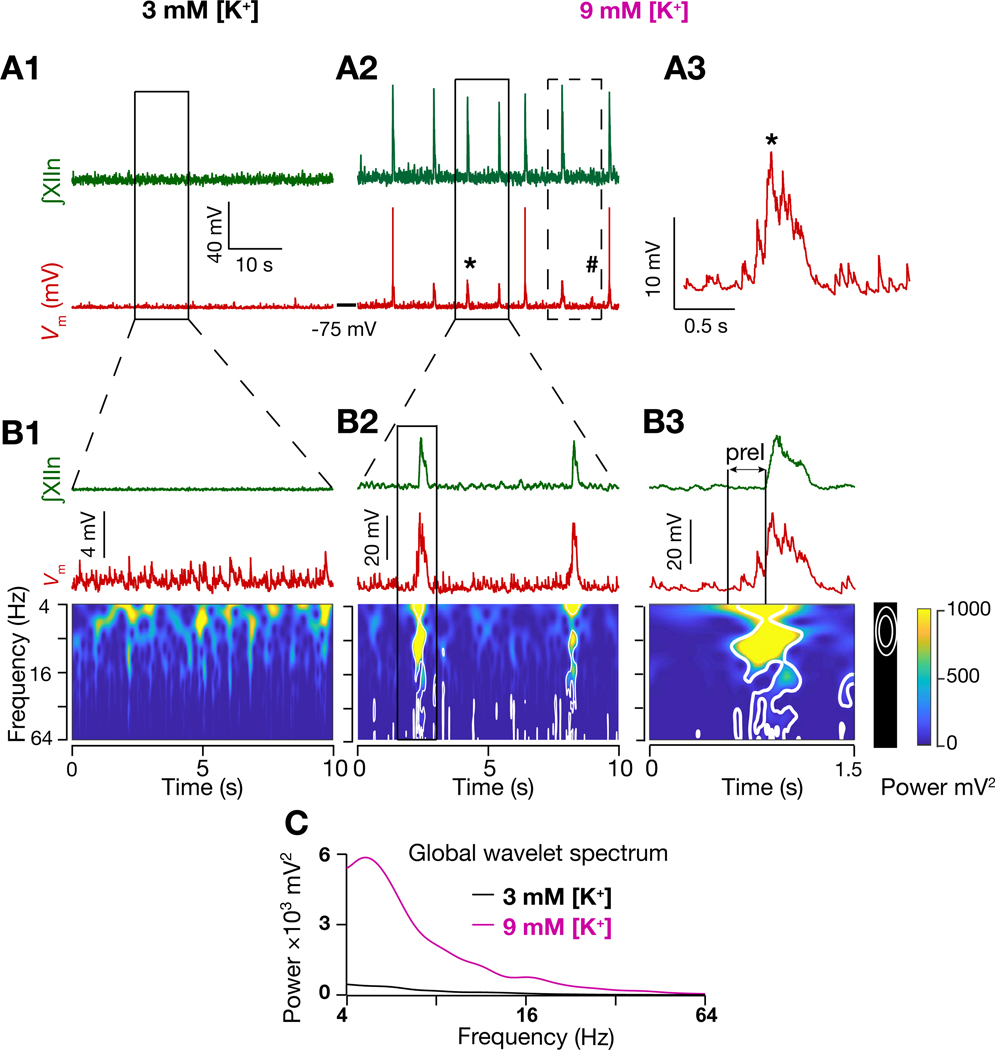
Figure 2. Inspiratory activity is correlated with spectrotemporal reorganization of inputs onto preBötC I-M SST+ neurons.
(A1-A2) ∫XIIn (green) and I-M SST+ neuron membrane potential (; red) in 3 mM [K+]ACSF (A1) and in 9 mM [K+]ACSF (A2); (A3) expanded from (A2) marked by *. Dashed box in (A2) represents the deflection corresponding to a missed burst in the XIIn, marked by #, which resulted in a longer interburst interval for the next burst. (B1-B3) ∫XIIn, and associated frequency-time plot for I-M SST+ neuron in 3 mM [K+]ACSF (nonrhythmic; B1) and in 9 mM [K+]ACSF (rhythmic, B2); expanded traces from solid boxed region in (A1) and (A2), as indicated. (B3) expanded boxed region from (B2). White contours in frequency-time plots enclose regions where local power was significantly higher (95% confidence level) than background spectrum, i.e., global wavelet spectrum of in (B1). Note in (B3) emergence of input synchrony in preI period well before the emergence of I-burst in XIIn. (C) global wavelet spectrum of in 3 mM K+ (B1) and 9 mM K+ (B2). Also, see Figure S1.

