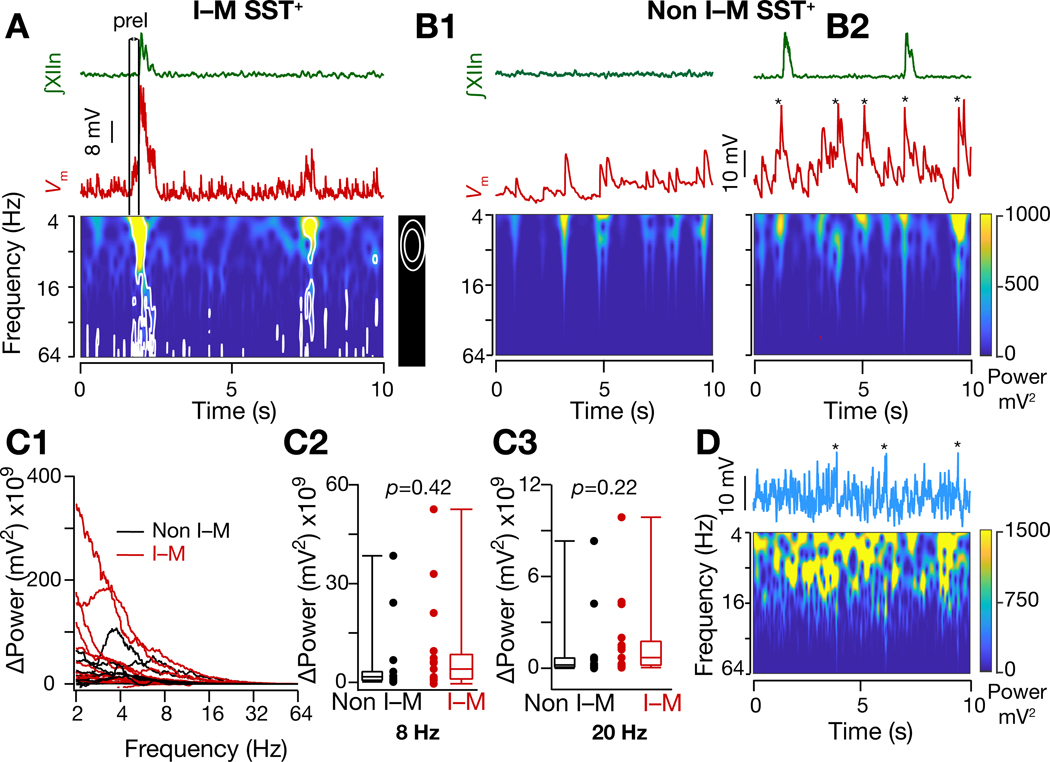
Figure 4. Input synchrony during an I-burst is specific to I-M SST+ neurons.
(A) Frequency-time plot of of an I-M SST+ neuron (from dashed box region of Figure 2(A2)) under rhythmic conditions showing reduced synchrony during I-burst failure compared to production of I-burst (first peak), i.e., corresponding to preI activity not followed by an I-burst (second smaller peak). (B1-B2) Same as (A) but for non I-M SST+ neuron under control (3mM [K+]ACSF) (B1) and rhythmic (9mM [K+]ACSF) (B2) conditions. median filtered to remove APs (indicated by *). (C1- C3) Change in power of I-M and non-I-M SST+ neurons when brainstem slices were shifted from nonrhythmic to rhythmic conditions; p values for Wilcoxon rank sum test. (D) Frequency-time plot of median filtered of a model neuron when 10 excitatory synapses were activated randomly with 15 Hz mean frequency. Note absence of bursting. * indicate median filtered APs. Also, see Figure S3.

