Introduction
Scientific investigation is fundamentally an effort to establish relationships between cause and effect. Like human interactions within a society, scientific relationships provide a model through which we interpret disease and treatment. Such models are both complex and iterative and our attempts to understand the world around us are subject to multiple confounders and biases. As a result, the journey to derive truth in light of these cognitive fragilities has taken multiple millennia. Even at present, we have relatively few cures to alleviate human suffering. Nonetheless, our capacity for treatment discovery is heavily influenced by our ability to uncover the correct causal model. It is therefore imperative for each generation of surgeons to systematically evaluate current practices and question their incongruencies.
Washington on His Deathbed (Figure 1) by Junius Stearns reveals the bedside scene of a dying president. Following his Farewell Address in 1796, George Washington retired to his Mount Vernon estate, south of what is present-day Washington D.C., at the age of 65. His property was extensive, and Washington rode on horseback approximately 6 hours each day to oversee his plantation’s projects. On December 12, 1799, weather conditions turned poor with rain, snow, and sleet. In spite of this, Washington continued with his daily routine, subsequently experiencing chest congestion on the evening of the following day. He awoke the morning of December 14th with a sore throat and shortness of breath.1 In the course of his ensuing illness which historians now believe to have been severe epiglottitis, Washington underwent multiple phlebotomies, toxic ingestions, herbal treatments and cathartics in an effort to save his life.2 Physicians, Drs. James Craik, Gustavus Richard Brown and Elisha Cullen Dick, were well-trained practitioners of their day and believed these modalities to represent best practices in the treatment of the former President. Nonetheless, their efforts were unsuccessful, and the first president of the United States succumbed to his illness at 10:20pm on December 14, 1799.
Figure 1.
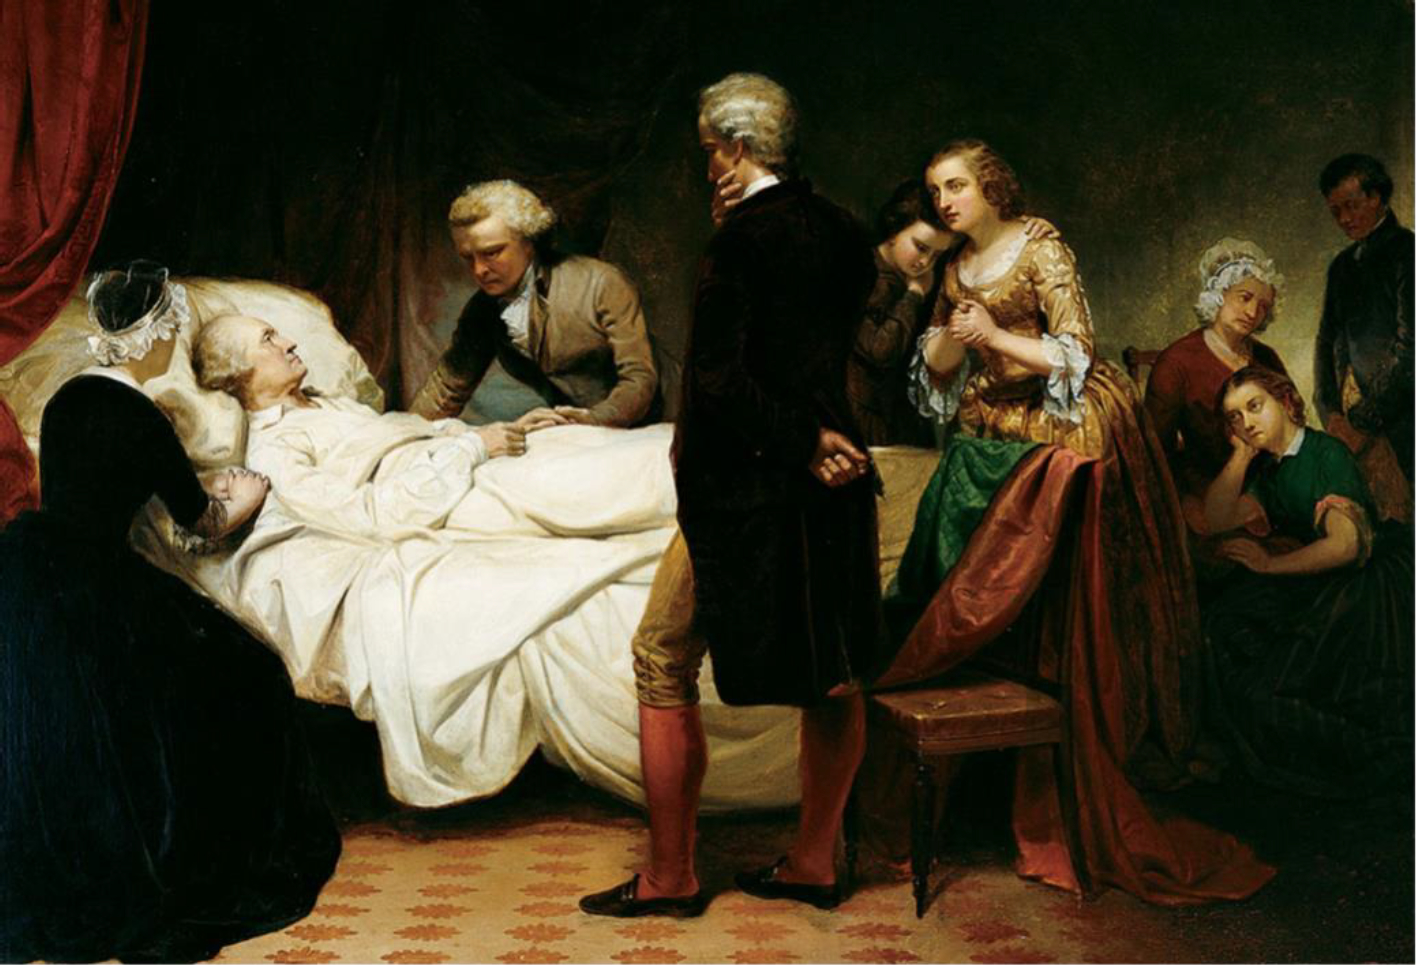
Washington on his Deathbed. Stearns, Junius Brutus. 1851. Oil on canvas. 37.25 in × 54.13 in. From Dayton Art Institute. Dayton, OH. https://www.daytonartinstitute.org/exhibits/junius-brutus-stearns-washington-on-his-deathbed/, accessed 21 March, 2022.
The challenges at Washington’s bedside transcend space and time. The same fundamental challenges faced by his treatment team are in play each day in thousands of hospital rooms across the world. His physicians undoubtedly had the same conversations: Which intervention will have the best chance of success? What are the risks and benefits of each? When should we change our approach in the absence of a response? What would have happened if we made a different decision? Unfortunately, in any given decision tree, turning back the hands of time and introducing the same set of circumstances with the use of a different treatment (i.e., the perfect counterfactual) is merely a thought experiment. Often, a combination of associations and extrapolated experiences is substituted for causality, the gold standard for decision making evidence. The conclusion of a causal relationship is a rare indulgence, one that is classically exemplified in the public health literature with story of Dr. John Snow and the pump handle.
Dr. John Snow, considered the “Father of Epidemiology” for his investigations into the causes of cholera outbreaks and prevention of their recurrence, was an anesthesiologist in London, UK during the mid-19th century. He examined the patterns of infection during the cholera epidemic of 1854. The result was a detailed spot map of London’s Golden Square area (Figure 2). Believing cholera to be a water-borne illness, Snow made careful note of the local water pump stations on his map. Appreciating a density of disease around Pump A (i.e., the Broad Street pump), he concluded that the disease must be arising from that location. Curiously, he also observed that no cases of cholera were identified amongst workers at a brewery 2 blocks east of Pump A. Dr. Snow subsequently discovered that the workers used a well on the premises as their source of water rather than pump water. Given that the Broad Street pump was the common water source for the residents of Golden Square, Snow presented his findings to municipal officials and the pump handle was removed, concluding the outbreak.3
Figure 2.
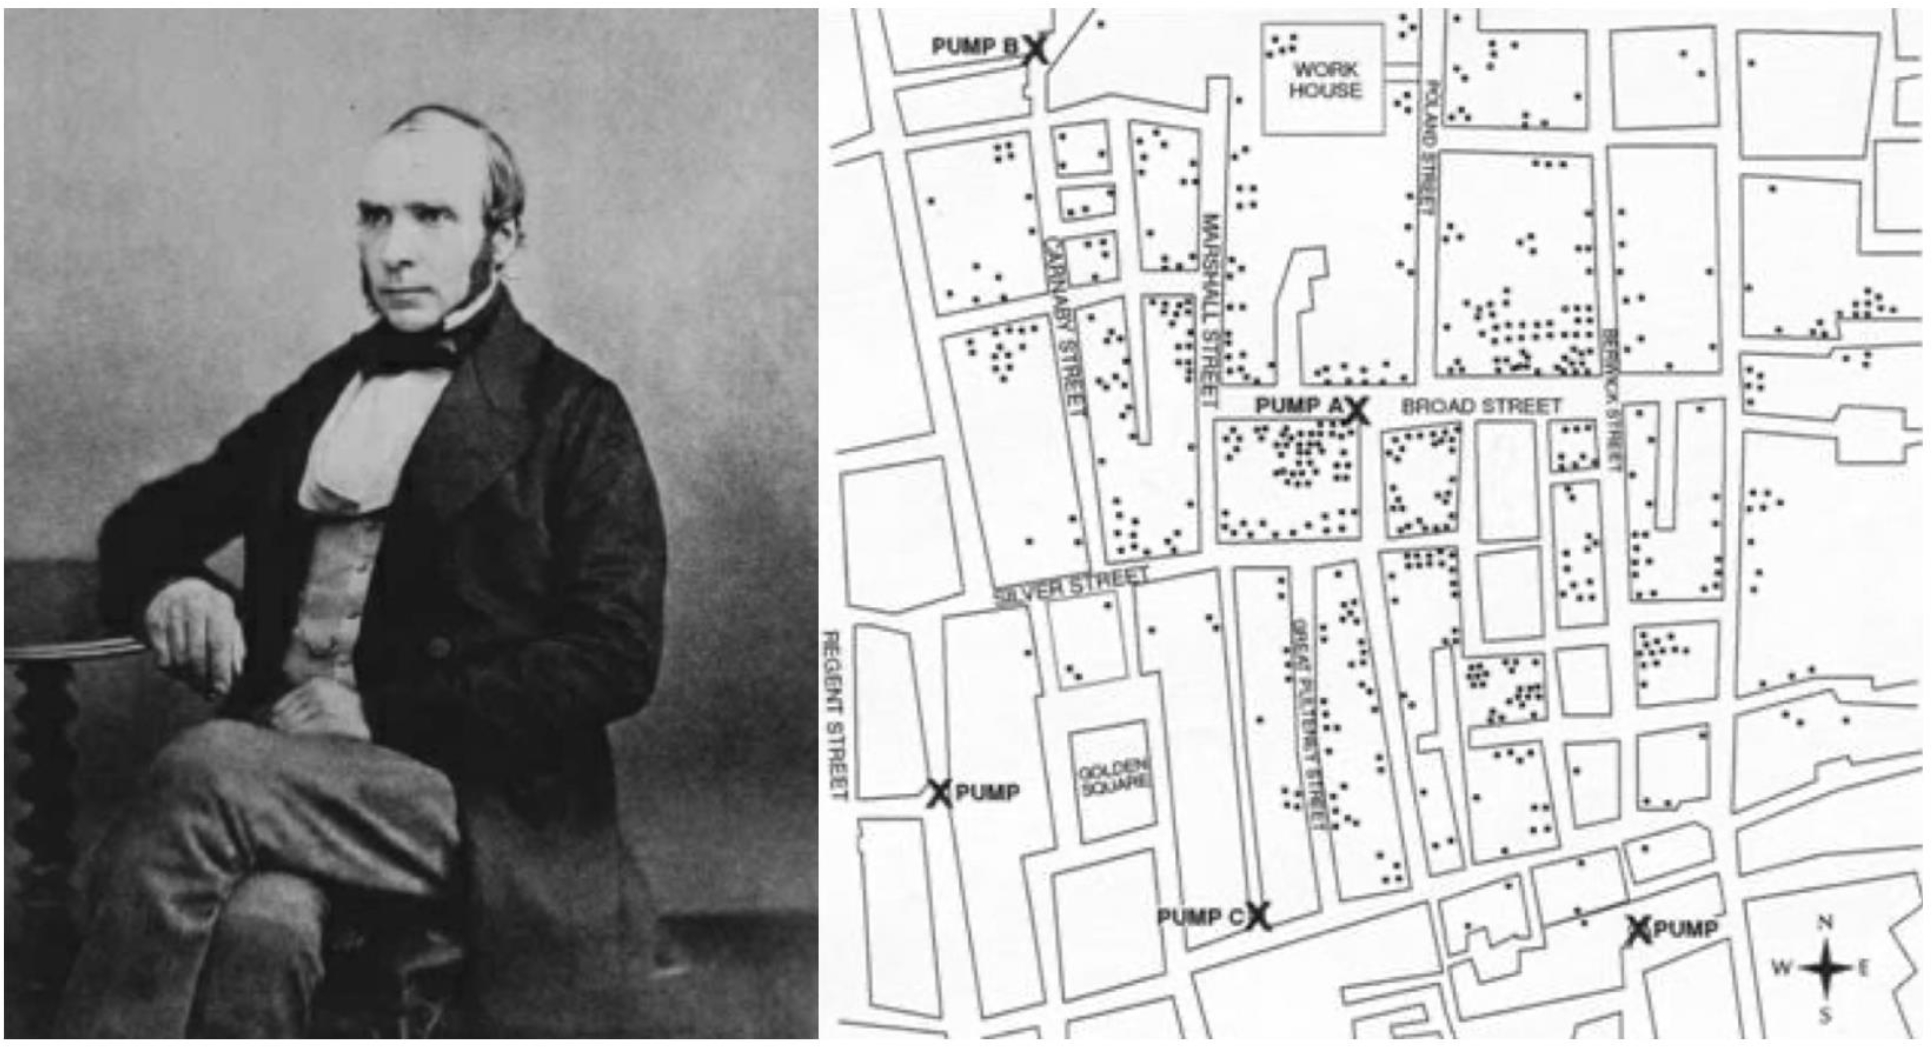
Dr. John Snow (left) and rendering of his spot map of deaths from cholera in Golden Square, London. Modified from Snow J. Snow on cholera. London: Humphrey Milford: Oxford University Press; 1936.
While John Snow created a foundation for modern epidemiologic measurement, scientific investigation of clinical phenomenon rarely yields the luxury of “removing the pump handle” and the effort to determine causal relationships is typically more challenging. Instead, correlative relationships, where the intersection between a possible cause and effect is nebulous, are far more common and investigators are left to postulate about which factors may be causal to the outcome. In this vein, Sir Bradford Hill (Figure 3), an English economist, epidemiologist and statistician, credited with pioneering the design of the modern randomized clinical trial, introduced his Causal Criteria in 1965.4,5 These essential elements of determining a “cause” include strength of the association, consistency of the observed association, specificity (between cause and effect), temporality (cause precedes effect), biological gradient, plausibility, coherence (consistency with “generally known facts”), experiment, and analogy. Dr. Hill comments:
Figure 3.
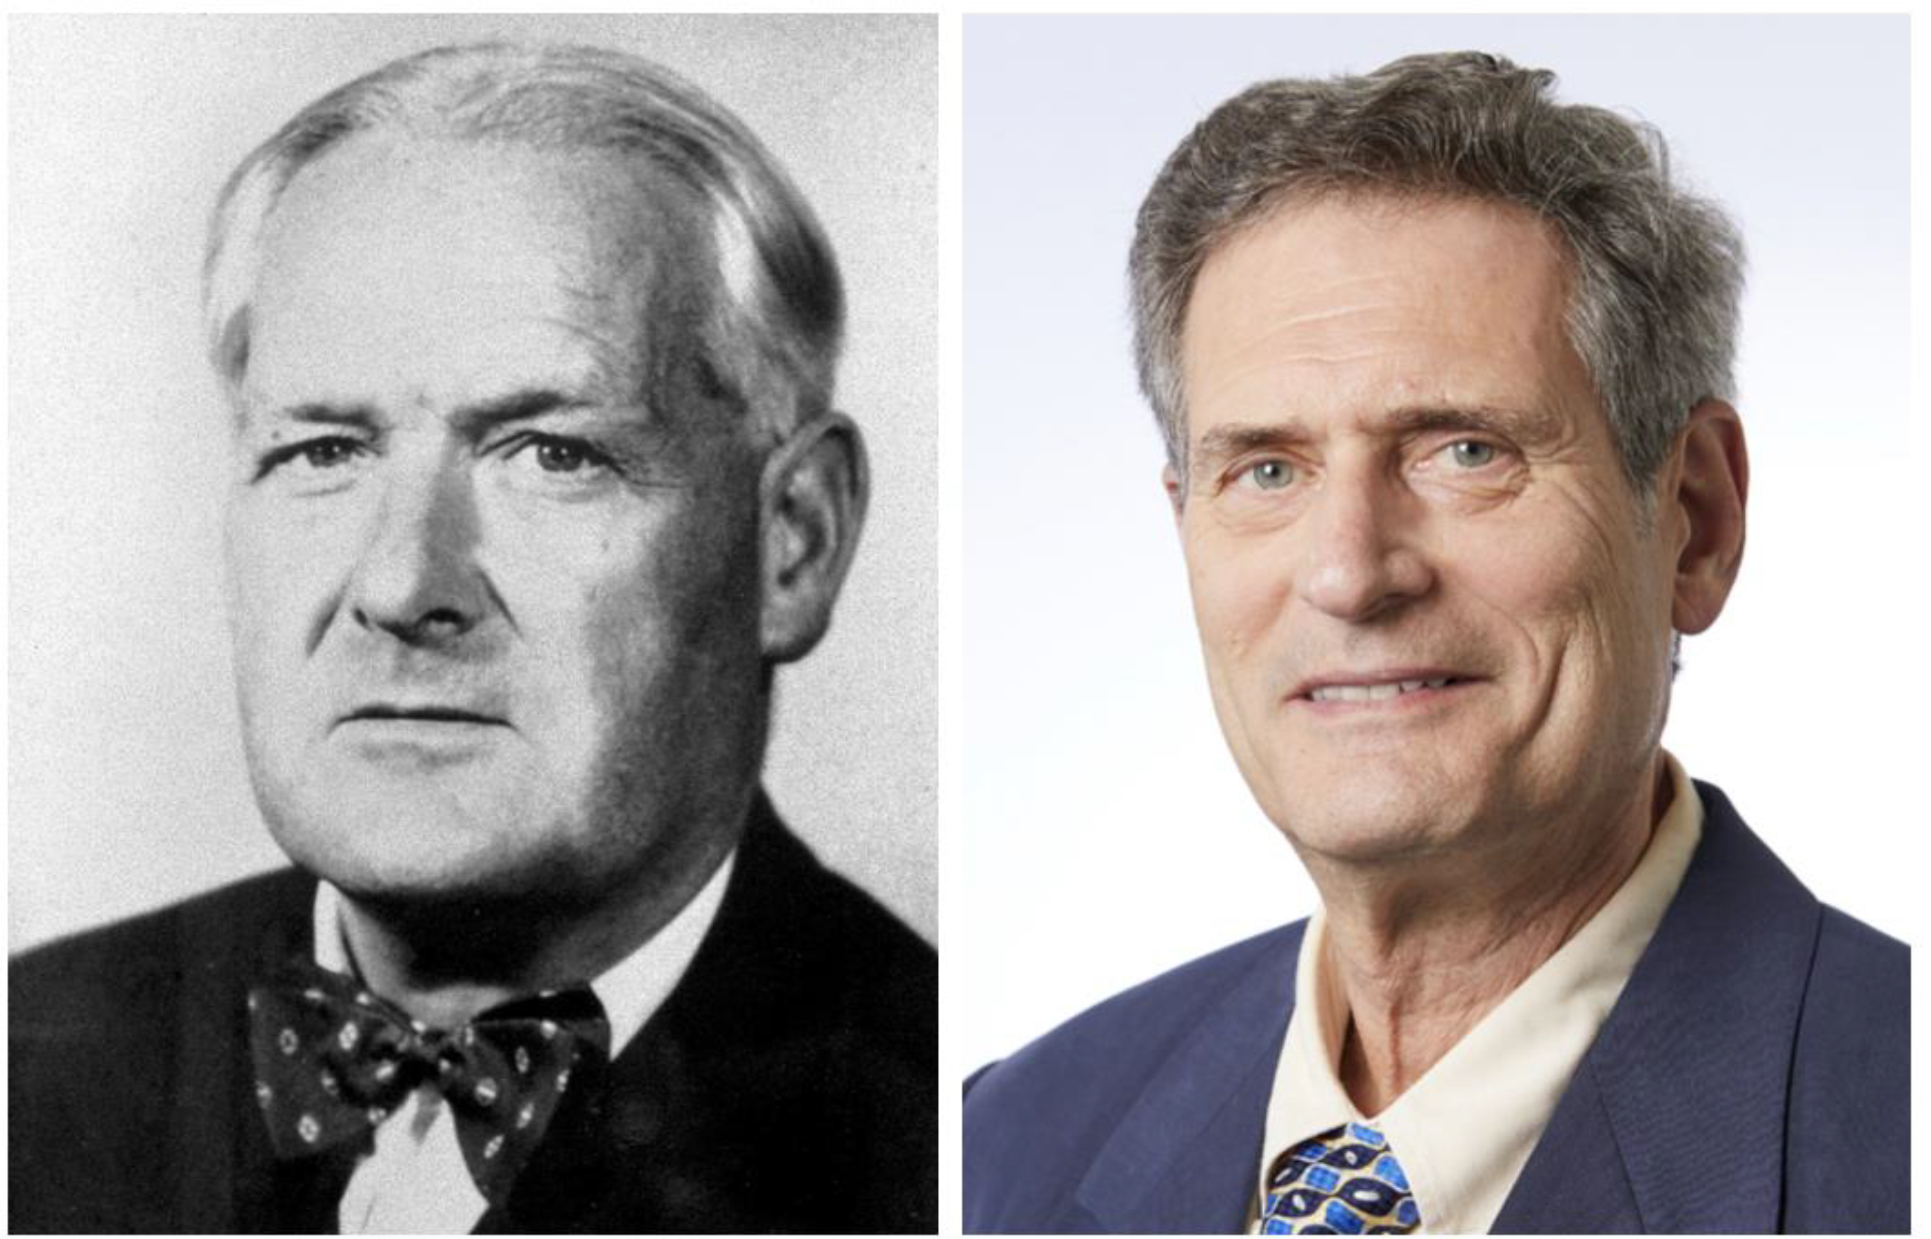
Sir Bradford Hill (left) and Dr. Kenneth Rothman (right).
“None of my nine viewpoints can bring indisputable evidence for or against the cause-and-effect hypothesis and none can be required as a sine qua non. What they can do, with greater or less strength, is to help us make up our minds on the fundamental question – is there any other way of explaining this set of facts before us, is there any other answer equally, or more, likely than cause and effect.”4
Building upon the work of Hill, Dr. Kenneth Rothman (Figure 3), a professor of epidemiology at Boston University, introduced the Causal Pie Model in 1976. He defines cause as: “…an act or event or a state of nature which initiates or permits, alone or in conjunction with other causes, a sequence of events resulting in an effect.”6 From this approach, he discerns 3 different types of cause (Figure 4). A sufficient cause is a set of conditions, without any one of which the disease would not have occurred (i.e., the whole pie). A component cause is any one of the set of conditions which are necessary for the completion of a sufficient cause (i.e., a piece of the pie). A necessary cause is a component cause that is a member of every sufficient cause.
Figure 4.

Example of the Causal Pie Model. Sufficient cause: A+B+C+D; Component cause: A-D; Necessary cause: A.
Taking these definitions together, several conclusions can be drawn from this model. First, the satisfaction of a sufficient cause makes the disease inevitable. While this obviates the ability to prevent disease, the timeline for disease manifestation (i.e., malignancy) may be prolonged, allowing for treatment to cure. Secondly, the component causes to create a sufficient cause may occur far apart in time, facilitating opportunities for preventative intervention. Lastly, blocking the action of any component cause, prevents the completion of the sufficient cause, antagonizing the disease by that pathway.
Ultimately, the degree to which causal assertions of a given investigation are incorporated into surgical practice depends upon the relationship between 3 factors: study design, data interpretation, and quality of care in surgery. This relationship may be expressed in the form of 2 questions:
Are the conclusions from a given investigation appropriately interpreted based on the study design?
Are the conclusions likely to yield improvements in quality of care in surgery?
If a study or trial is poorly designed, then its conclusions are uninterpretable. If the conclusions are unlikely to improve quality of care, then they will not be incorporated into practice models for surgical decision making. In turn, the levels (or categories) of evidence represent the degrees to which these questions are answered with decreasing amounts of bias and uncertainty. The following discussion will provide a framework of understanding for each of these 3 inter-related factors.
Discussion
Quality of Care in Surgery
As Washington lay critically ill, the treatment practices of his physician team were being interrogated in Philadelphia. Benjamin Rush, a charismatic physician, statesman, and signer of the Declaration of Independence, was an ardent supporter of phlebotomy as a panacea for disease.2 Craik, Brown, and Dick were all familiar with Rush. Craik and Rush served together in the Revolutionary War, Brown was his medical classmate in Edinburgh, and Dick was his trainee in Philadelphia.7 For the past 2 years, Rush had been ensnared in a legal battle with William Cobbett, a journalist who alleged that Rush’s enthusiastic blood-letting practice during the 1797 yellow fever epidemic in Philadelphia was tantamount to murder.7 Though Cobbett was found guilty of libel (on the day of Washington’s death), Rush never recovered his medical reputation and subsequently closed his practice. Fearing for their own reputations, Craik and Dick issued a statement to the nation following Washington’s death, describing his illness and their treatment course. The article was negatively received with friends and members of the medical community suggesting that Washington was murdered.2 Though phlebotomy was considered an accepted, yet heroic, therapy of the day, its treatment failure in this high-profile case called its utility into question.
Clinical research is fundamentally driven by outcomes. The Donabedian model, first proposed in the 1960s, provided a dynamic and generalizable assessment tool for quality of health care via evaluation of structure, process, and outcomes.8 Structure is the environment where care is being delivered and entails institutional, workforce and supply factors. Process is the coordination of care delivery and outcomes are the effects of care delivered to the patient. Necessarily, outcomes are impacted by both structure and process. Allowing for selective evaluation in these separate elements, this model has been successfully applied to the care improvement of multiple different pathologies, including lung cancer, prostate cancer, congenital heart defects and morbid obesity.9
The field of surgery began to systematically explore outcomes toward quality improvement in the 1990s and early 2000s by applying the Donabedian model to create both the National Surgical Quality Improvement Program (NSQIP) in the United States and the Physiological and Operative Severity Score for the Enumeration of Mortality and Morbidity (POSSUM) in Europe.10–13 NSQIP was originally birthed as the National Veterans Affairs Surgical Risk Study (NVASRS) and was developed in response to public criticism of the Department of Veterans Affairs (VA) for high operative mortality rates at the 133 VA hospitals in the 1980s.14 Congress passed Public Law 99–166, mandating annual VA reporting of surgical outcomes on a comorbidity risk-adjusted basis for comparison to domestic averages. NVASRS collected pre-operative, intraoperative, and 30-day post-operative outcome variables at 44 VA medical centers on more than 117,000 operations across nine surgical specialties from October 1991 to December 1993.14,15 The data correlated to the quality of structures and processes at the various centers and allowed the VA to improve post-operative mortality by 47% and morbidity by 43% across its system from 1991–2006.15 NSQIP, established as an ongoing VA quality initiative following NVASRS, was subsequently piloted at several university institutions in 1999. The experiences of these non-VA centers validated the predictive and risk-adjusted models created by the VA in the heterogenous patient population of the private sector.15 Presently, the American College of Surgeons, as the managing body of NSQIP within the private sector, has enrolled more than 700 hospitals across the United States and over 100 hospitals internationally to its program, now the largest clinical general surgery registry in the world.15
While national initiatives, such as NSQIP, have unquestionably improved the quality and standardization of surgical care, variations in surgical outcomes persist. Much to the chagrin of surgeons, patients, hospitals, insurance companies and national agencies alike, there is no perfect metric for quality.16 Importantly, in revisiting the Donabedian model, none of the three variables (i.e., structure, process, or outcome) can be appropriately applied to evaluation of every procedure type. As demonstrated in Figure 5 from Ibrahim and Dimick, the quality metric used to asses a given operation is based upon both the volume and risk associated with that procedure.16
Figure 5.
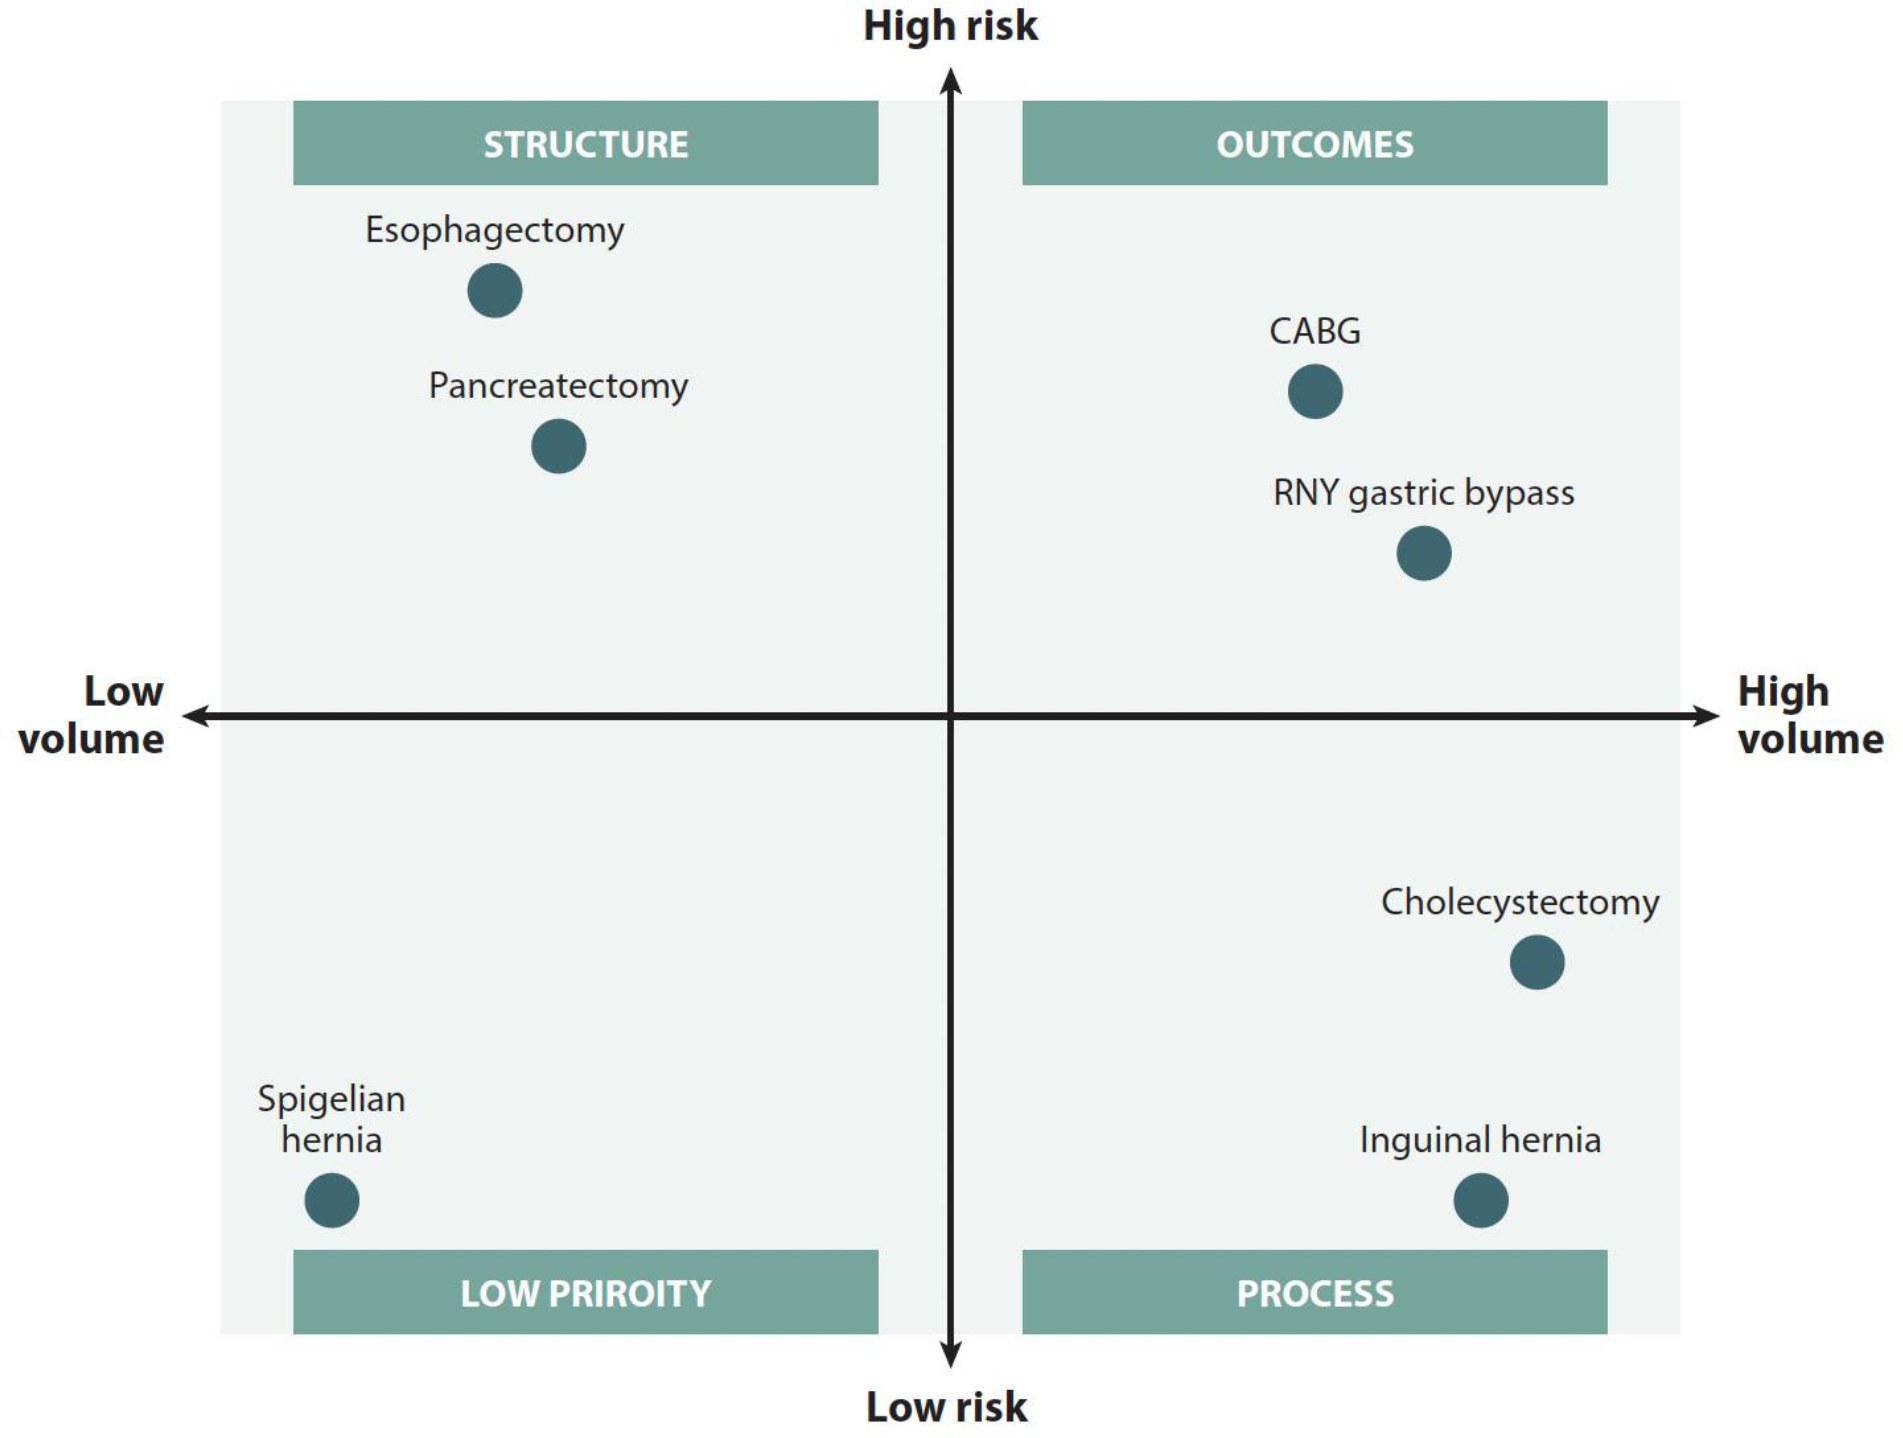
Qualification of exemplary procedure types in correspondence with volume and risk. Reprinted with permission from Ibrahim AM, Dimick JB. What Metrics Accurately Reflect Surgical Quality? Annu Rev Med. 2018;69:481–491.
Whereas high-risk/high volume operations may be appropriately evaluated by their outcomes, low-risk/high volume procedures (i.e. laparoscopic cholecystectomy) would be unlikely to yield discriminatory outcomes between facilities.17 The quality of these operations are likely best compared by process. Alternatively, procedures that are high-risk/low volume may generate inadequate numbers at a given center to accurately compare outcomes. Therefore, quality may be measured in the variable of structure (i.e., volume of operations), which is supported by prior work.18,19
Because of the limitations described in traditional quality assessments, exploration of new metrics is an imperative. As the surgical field is fundamentally interventional, there is the inherently human variable of quality in performance. Based on intra-operative video monitoring, differences in technical skills may influence outcomes.20 Comparison based on this modality could yield standardization in technique and training, a variable yet to be included within the graduate surgical education frameworks of the United States.21,22 Furthermore, patient-reported outcomes, or the quality-of-life assessments following operation, could inform traditional outcome measurements. Though there is popular agreement that these should be included, the processes for their collection and evaluation remain unstandardized.16
The evolution of the Donabedian concept has provided surgical researchers a framework by which quality of care may be evaluated. However, proper study design remains crucial for durable progress to be made in these categories. Data that are collected in response to flawed hypotheses, gathered inappropriately, and applied incorrectly frustrate improvements in surgical care. Thus, it is upon surgeons to evaluate the literature for appropriate conclusions based on study design prior to updating practice models for surgical decision making.
Study Design and Levels of Evidence
Clinical research in surgery is generated primarily from analytical study designs, though case reports are frequently written on interesting or uncommon topics to generate awareness. Interpretation of outcomes from a case report is extremely limited, not generalizable and should frame what is possible rather than what is probable. Beyond anecdotal reports, the two general categories of medical research include experimental and observational designs. Observational designs are commonly referred to as “studies” while experimental designs are termed “trials”, as they include some form of assigned intervention. In general, the quality of evidence from the hierarchy in Figure 6 is inversely proportional to the level of potential bias within a given design. Generally defined, bias is ”any systematic error in the design, conduct, or analysis of a study that results in a mistaken estimate” or “any tendency which prevents unprejudiced consideration of a question.”23,24 Bias may occur at all phases of a trial or study, influencing study design, data collection, analysis and interpretation.
Figure 6.
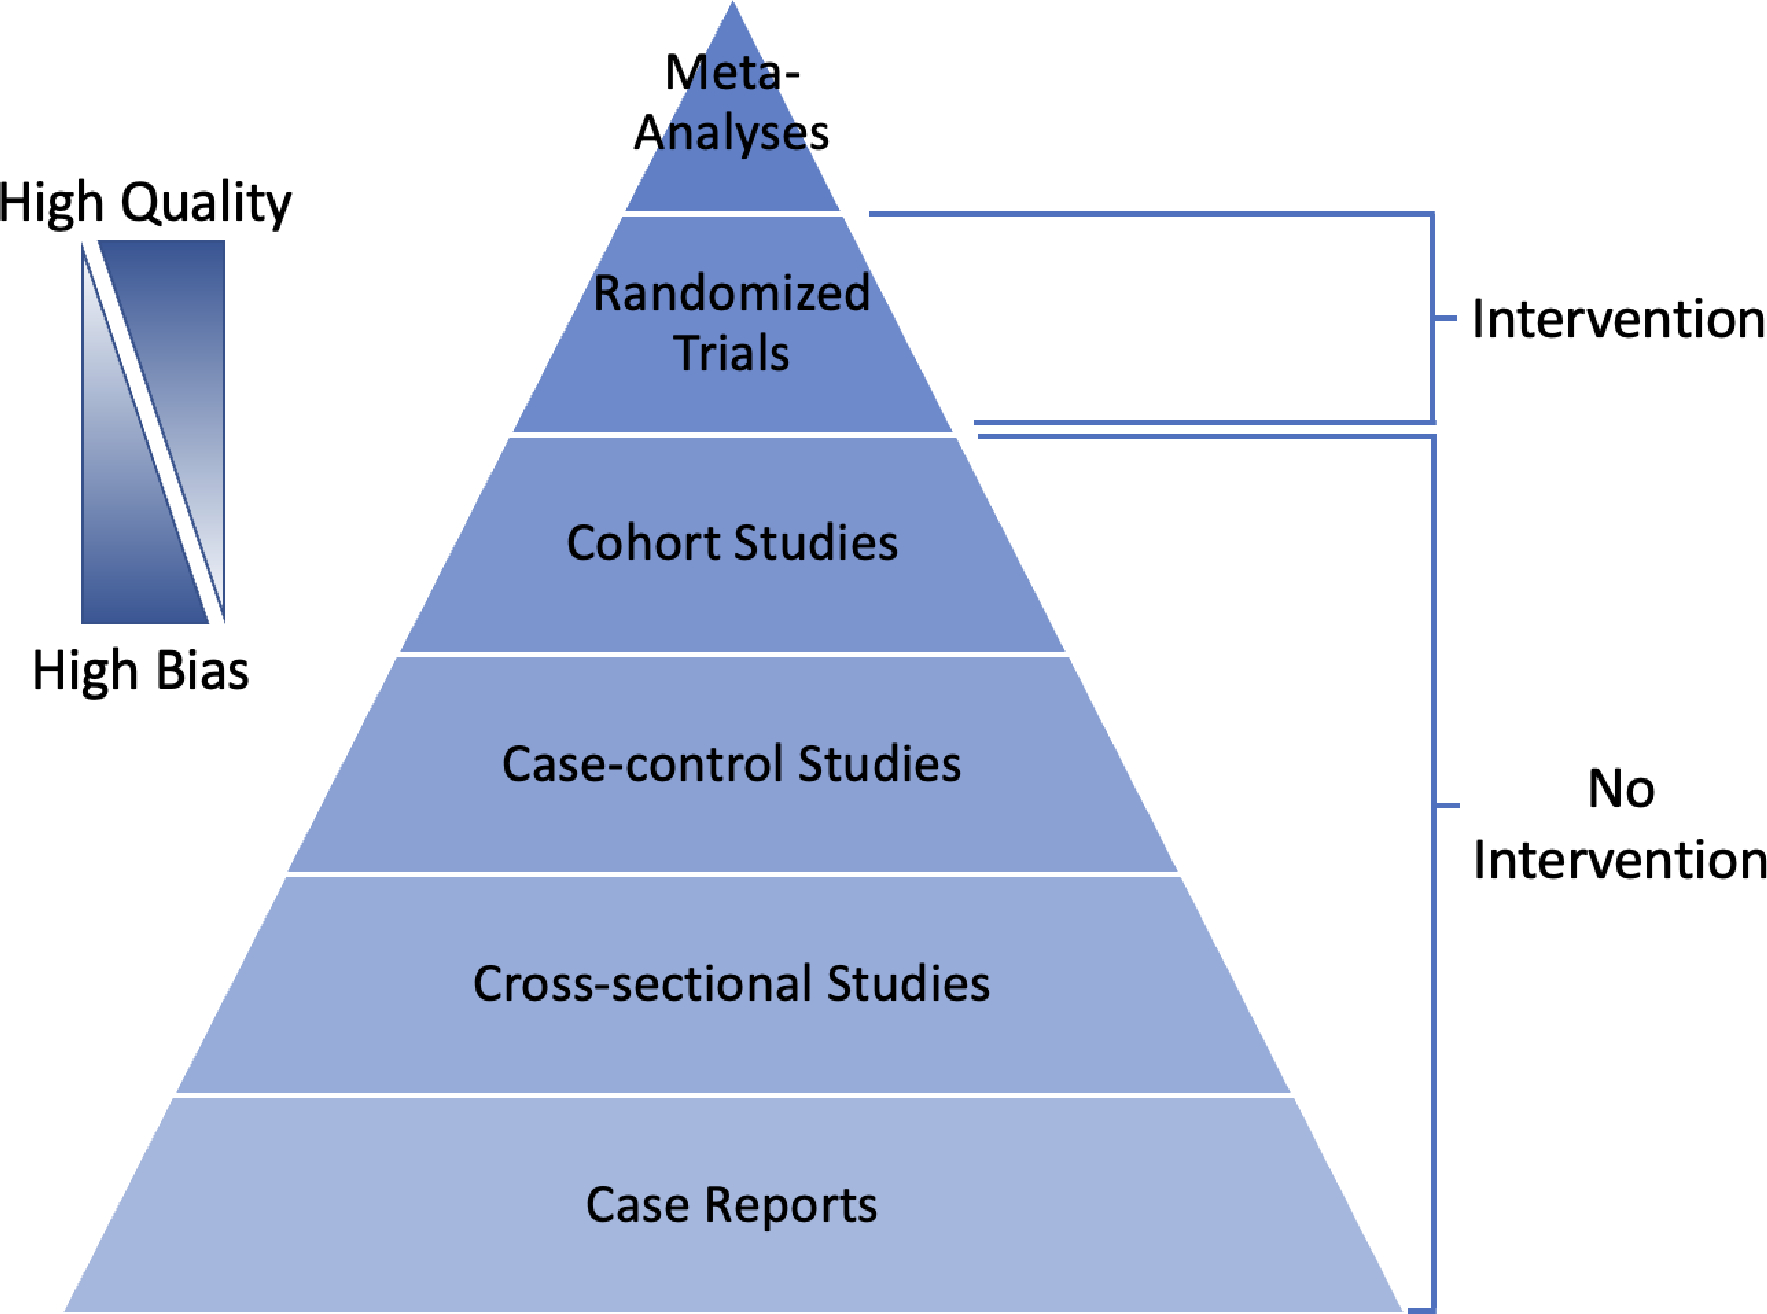
Clinical evidence quality hierarchy based upon study type.
Epidemiologic observational studies can be divided into three categories: cohort studies, case-control studies, and cross-sectional studies. Observational studies may be prospective or retrospective and are ideal in circumstances where a given intervention may be unethical to assign to participants (i.e., cigarettes, alcohol). Rather than introducing an exposure, participants in prospective cohort studies are chosen based on their current exposure status and followed over a period to assess incidence of a variety of outcomes. The primary rationale for this type of study is to learn about the health effects of an exposure. The relationship between the exposure and the disease state is expressed in terms of relative risk (or risk ratio). In other words, the incidence of a given outcome is compared as a ratio of rates between the exposed and un-exposed (control) groups. The major value of cohort studies is in their evaluation of multiple outcomes, particularly for rare exposures. Their limitation is the inability to study multiple exposures, as a single exposure is typically the basis for study inclusion. Prospective cohort studies are also a poor choice for diseases that take a long time to manifest or are very rare, as few outcomes may be observed during the study period. An alternative design, commonly employed in surgical research, is the retrospective cohort study where the exposure and outcome have already been observed. This allows for the choice of an exposure without a delay in measuring outcomes, which can reduce the burden of running a prospective study. However, as data for these studies are largely gleaned from electronic medical records and administrative databases, they are typically not collecting data for research and are prone to multiple biases related to selection, recall, misclassification, and missing data. While having great potential to advance research, electronic medical records and other administrative databases come with challenges that require their own consideration when designing studies.25,26 One useful framework for conceptualizing the design of observational studies is to emulate a target trial (i.e., the trial that would be run in an ideal world).27
Case-control studies are always retrospective and begin with the selection of a single outcome (i.e., disease) rather than a single exposure. Here the key research question is, “Given your outcome status, did you previously have the exposure of interest?”. Importantly, controls must have the opportunity to have developed the disease of interest. For instance, a group of men would not be an appropriate control for uterine cancer incidence in a sample of women. Results of a relationship between disease and exposure in case-control studies are expressed as an odds ratio, as risk between exposure and outcome cannot be directly established. Since case-control studies sample based on the outcome of interest, they are good tools for rare diseases and diseases with long latencies, taking into account multiple exposures. A weakness of case-control studies is their inability to look at multiple outcomes, inability to directly measure risk based on exposure, and susceptibility to bias from choice of controls. Matching of cases and controls is common in case-control studies to increase statistical efficiency but such choices should be carefully thought through and evaluated to avoid unintended consequences.28
Cross-sectional studies look at a population sample during a single time point, like a “snapshot” in time. Alternatively, they may be followed up with repeated measures over multiple time points (repeated cross-sectional or panel study). The main purpose of this design type is to answer questions about the prevalence (i.e., how many cases) or incidence (i.e., how many new cases in a repeated measure design) of a given disease within the population of interest. The strengths of cross-sectional studies are in their ability to describe multiple variables within a population.29 They frequently contain large sample sizes and serve as preliminary data for planning of future investigation. Since they ascertain exposure and outcome at the same time, the ability of cross-sectional studies to suggest causality is limited. A flowsheet to assist with study definition is listed below in Figure 7.30
Figure 7.
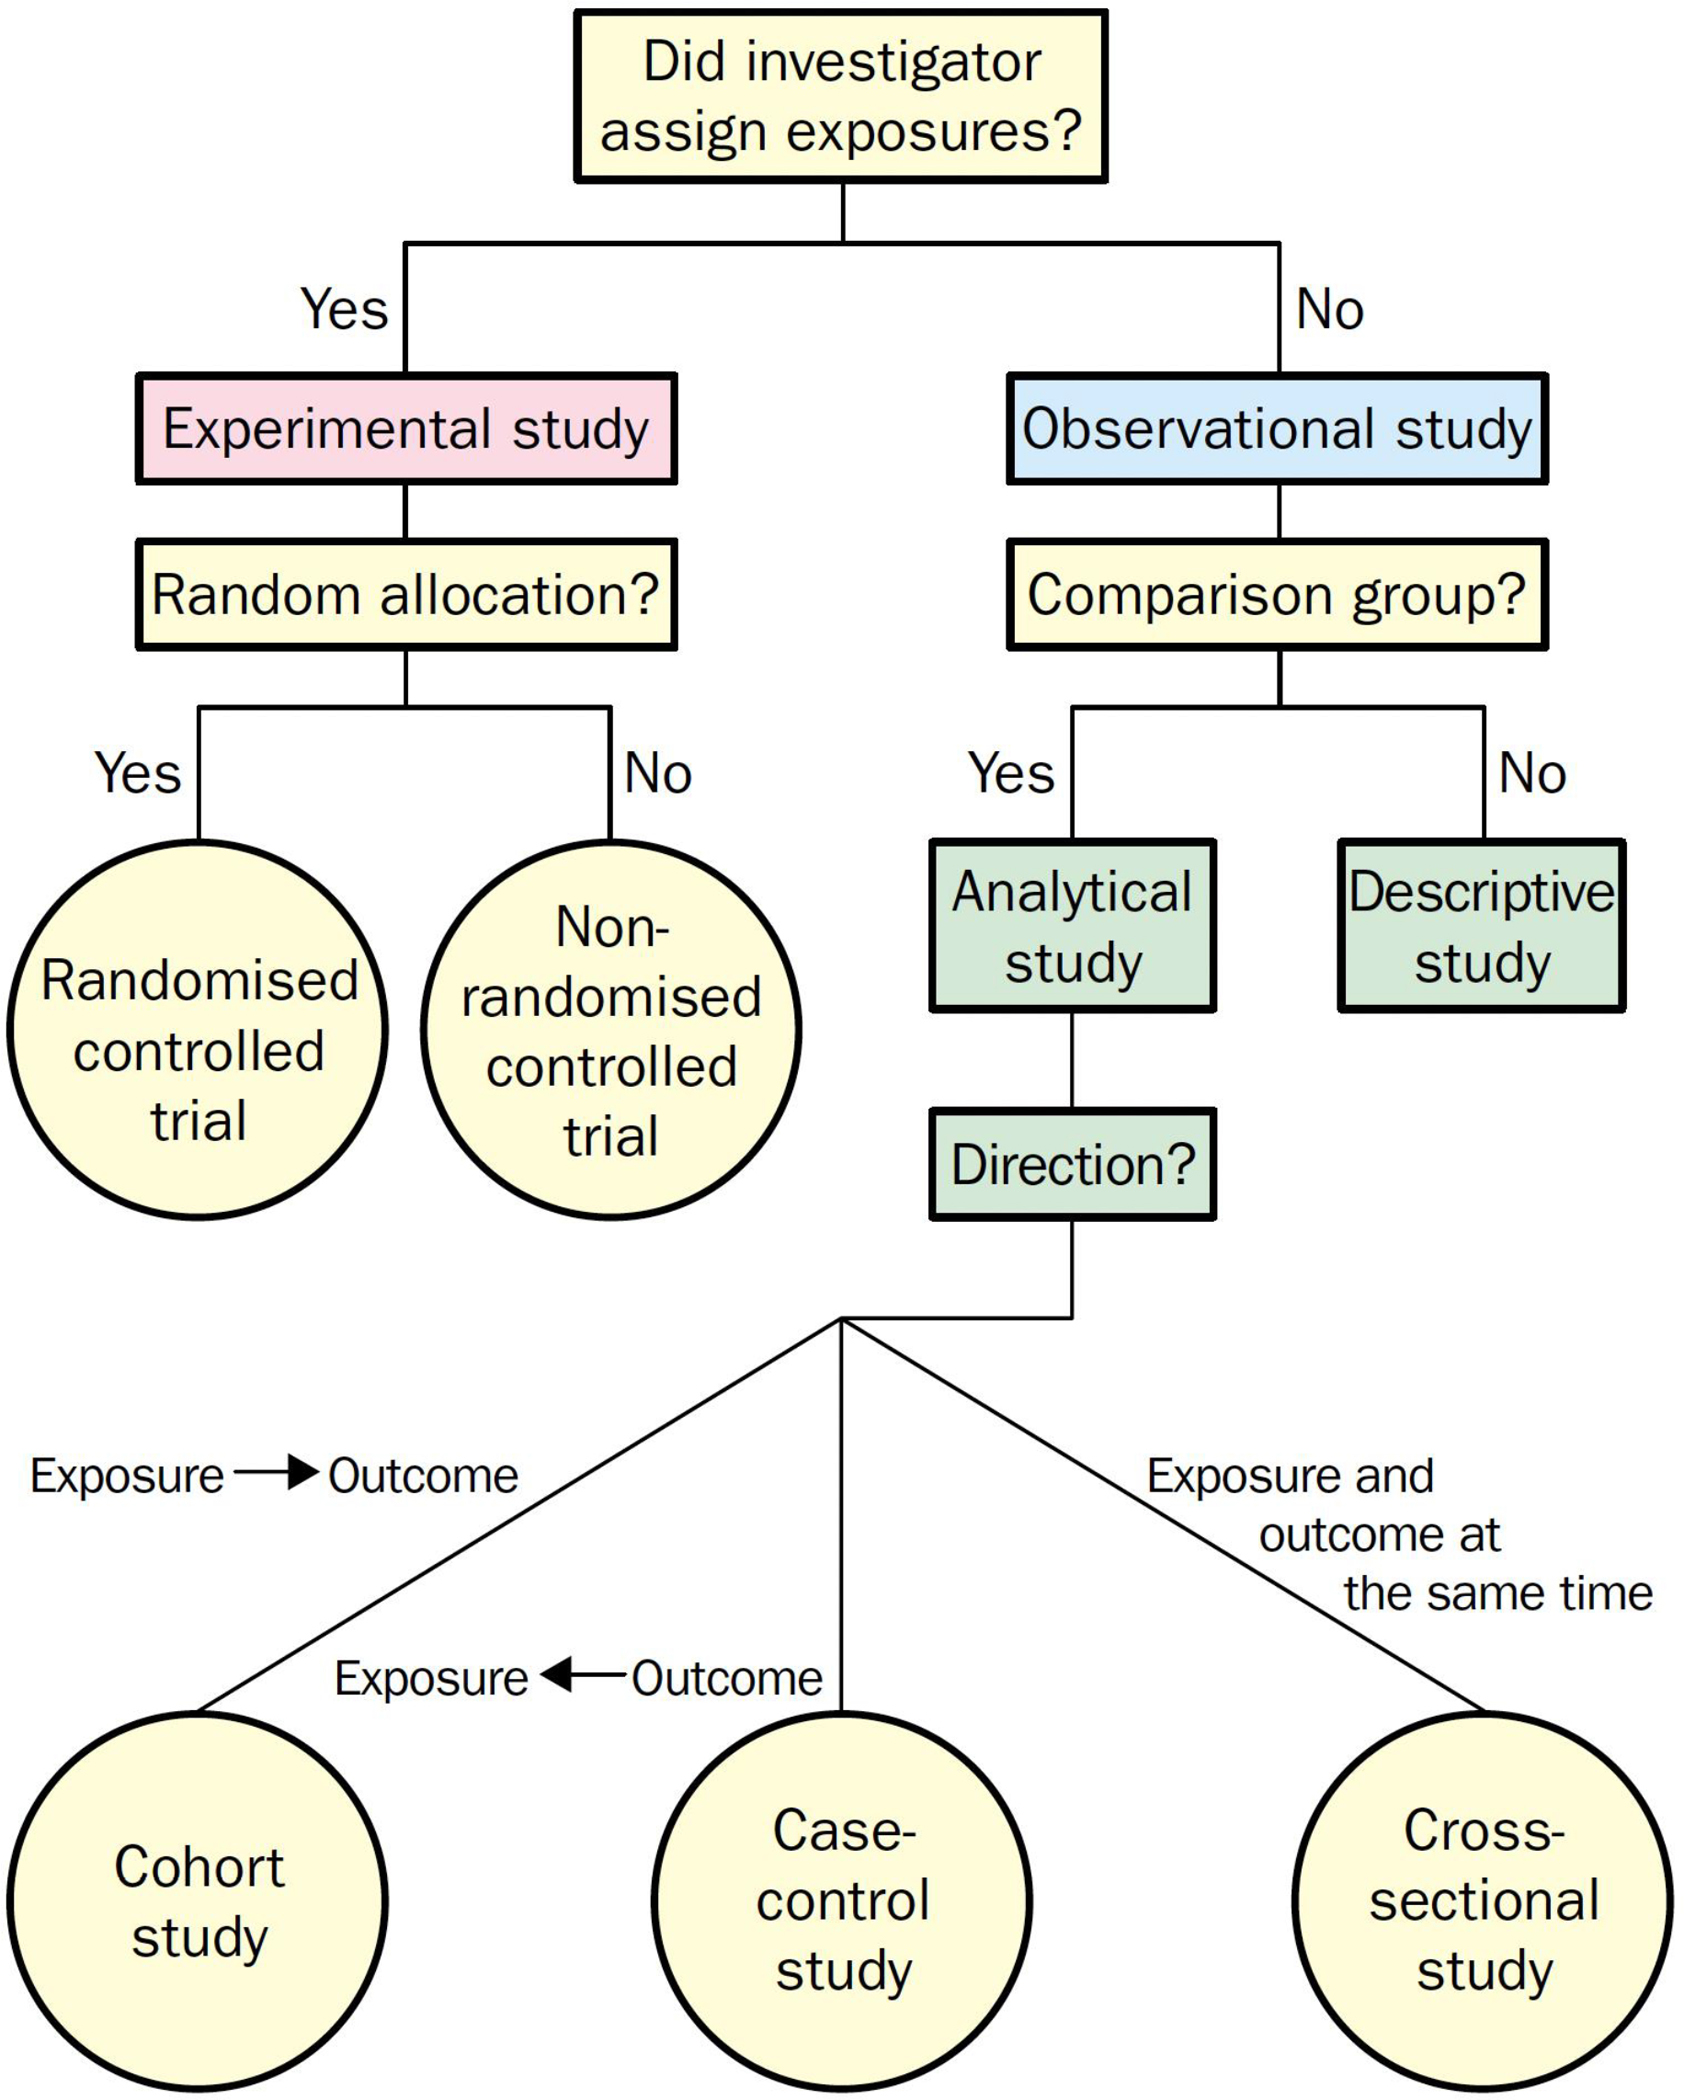
Flowchart for definition of clinical research designs. Reprinted with permission from Grimes DA, Schulz KF. An overview of clinical research: the lay of the land. Lancet (London, England). 2002;359(9300):57–61. doi:10.1016/S0140-6736(02)07283-5
Methods of Interpretation
If the data needed to assist surgeons with making the best quality of care decisions for patients comes from a variety of study designs, how do we decide which data to adopt and which to reject? One way is with a directed acyclic graph (DAG).31 A DAG provides a visual representation of the assumed model and relationships between variables of interest (Figure 8). Through the effective use of DAGs, one can identify potential sources of bias (i.e. confounders) during the study design phase and select appropriate analyses to mitigate such bias. Creating a DAG can also be a helpful exercise when interpreting the published literature, allowing for critical evaluation of hypotheses, achievement of stated outcomes and clinical relevance.
Figure 8.

Directed acyclic graph format demonstrating the relationship between exposure and disease. A confounder is a variable not on the causal pathway but associated with both the exposure and disease.
After settling on a causal model and a target quantity (i.e. estimand) of interest, one must consider the balance between accuracy (bias) and precision (variance). As shown in Figure 9, the ideal case is of high accuracy and high precision where estimates are tightly centered on the target. In practice, accuracy of an estimator is often determined by the design and analytical strategy, whereas precision is largely determined by sample size. Due to the link between precision and sample size, it is important to be aware of the Big Data Paradox, which notes that, despite increasing precision, small biases are often compounded with increasing sample sizes.32,33 In surgery, this paradox could arise from use of large claims or electronic health record databases that are subject to inherent structural biases. In other words, data quality is often more important than data quantity for generating high quality evidence.
Figure 9.
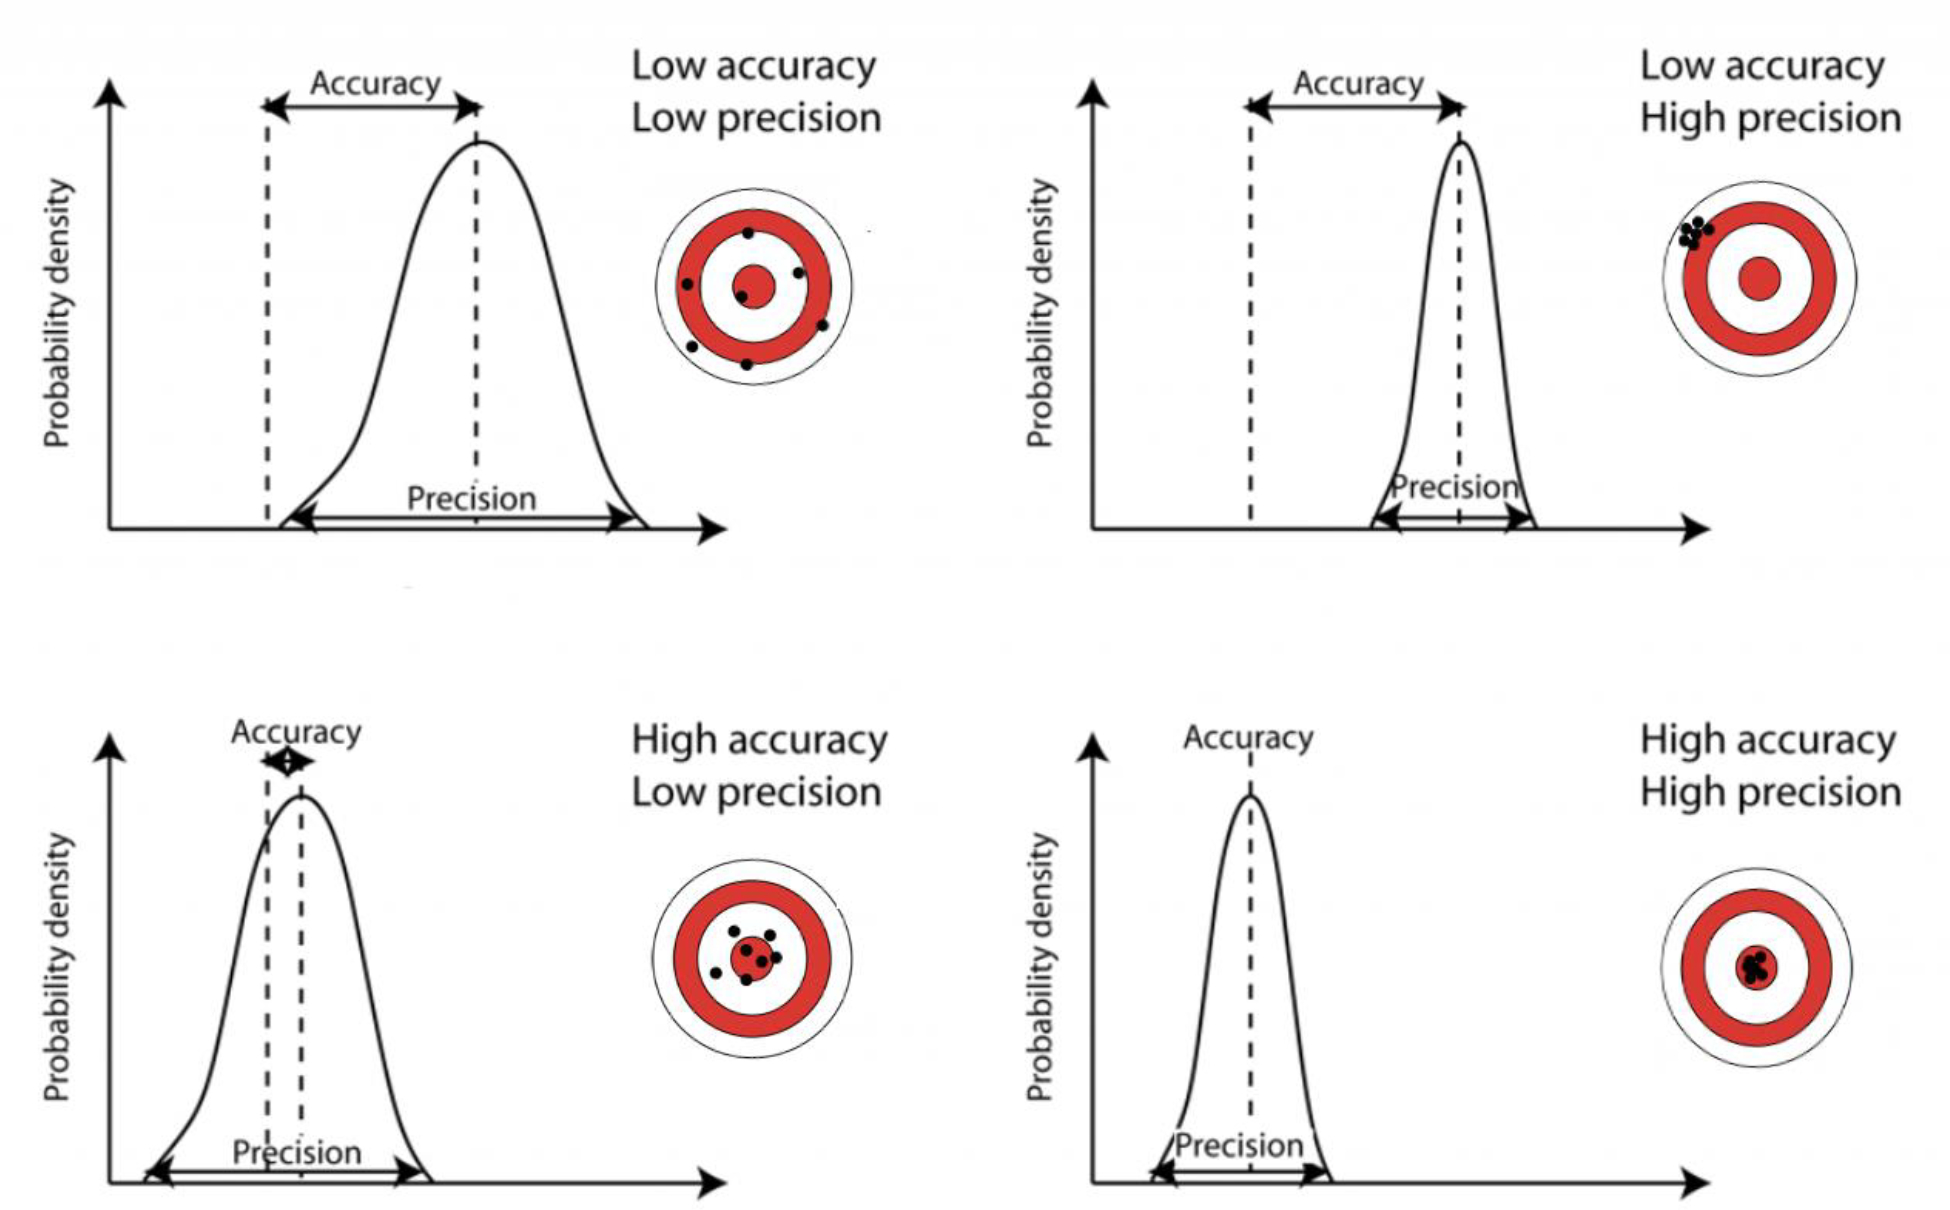
Graphical representations of variations within precision and accuracy. Courtesy of Dr. Bethan Davis, AntarcticGlaciers.org
Most importantly, interpretation of study results is based on notions of statistical and clinical significance. Statistical significance is typically determined by the result of a null hypothesis test. Hypothesis testing assumes a null hypothesis in the causal model and, typically, no effect of treatment. A p-value is calculated to determine the probability that one would observe data as extreme or more extreme than what was actually observed, assuming the null hypothesis model is true. If the p-value is small enough, the null hypothesis is rejected because it is unlikely that the data would have been observed if the null hypothesis were actually true. Confidence intervals provide another way of illustrating uncertainty around a parameter estimate and are linked to hypothesis tests. Confidence intervals show the set of parameters that would be compatible with the data observed.34 For example, a confidence interval of (−1, 2) would be compatible with a null hypothesis, inclusive of 0, but also null hypotheses of all effects in the interval from −1 to 2.
It is critical to examine whether an estimated statistical effect is relevant to clinical practice. While one could identify increasingly small statistically significant effects in large sample sizes, those differences only remain clinically meaningful to a point. It is up to the surgeon to determine the minimal clinically important difference (MCID) for their estimand. Determination of the MCID should be planned prior to data collection for an appropriate power calculation and to prevent unnecessary data collection.
Several important fallacies can arise while interpreting results. The vast majority can be prevented by pre-planning, pre-specification, and pre-registration of the design, outcomes, and analysis plan. Determination of statistical power, a function of variability and sample size, is a key part of this preparation to ensure appropriate decision-making about the primary endpoints based upon the study design characteristics. Power calculations are not useful after an analysis (post-hoc power) or to argue for the truth of the null hypothesis.35 It should be noted that absence of evidence against the null hypothesis is not evidence of absence of an effect. Other fallacies related to multiple testing, p-hacking, and selective presentation of results can also be mitigated through rigorous planning and pre-specification.36
Summary
The death of George Washington illustrates the struggle that physicians and surgeons face on a regular basis – the persistent and inherent duality of critically appraising the literature and applying it to the patient at the bedside. Washington’s physicians had no intention of expediting his demise. It was their causal model and evidence structure that were incorrect. Unfortunately, the challenge of the counterfactual persists through time – we cannot go back and try a different treatment under the same set of circumstances. Bias exists everywhere and there is no such thing as a “bias free” study design that perfectly applies to every clinical scenario. It is upon us to be able to interpret the contemporary data and evolve our practices with the best evidence we have. In this way, the final hours of Washington’s life serve as both the narrative of our history in medicine and the plow to which we must set our hands.
Key points:
Surgical decision-making requires integration of multiple objective and subjective pieces of evidence/inputs.
Objective evidence in the surgical literature can be confounded by multiple biases.
Recognizing these biases within the surgical literature is essential to categorizing evidence and developing a reliable fund of knowledge.
Synopsis:
Surgical decision-making is a continuum of judgements that take place during the pre-, intra- and post-operative periods. The fundamental, and most challenging, step is determining whether a patient will benefit from an intervention given the dynamic interplay of diagnostic, temporal, environmental, patient-centric and surgeon-centric factors. Myriad combinations of these considerations generate a wide spectrum of reasonable therapeutic approaches within the standards of care. Though surgeons may seek evidenced-based practices to support their decision making, threats to the validity of evidence and appropriate application of evidence may influence implementation. Furthermore, a surgeon’s conscious and unconscious biases may additionally determine individual practice.
Acknowledgement
The authors wish to appreciate the thoughtful review of this chapter from Drs. Lucas P. Neff, Department of Pediatric Surgery, Wake Forest School of Medicine and Michael Chang, Chief Medical Officer and Associate Vice President for Medical Affairs, University of Southern Alabama.
Abbreviation/Glossary list:
- NSQIP
National Surgical Quality Improvement Program
- DAG
directed acyclic graph
- MCID
minimal clinically important difference
Footnotes
Disclosure statement: The project described was supported by the National Center for Advancing Translational Sciences, National Institutes of Health, through Grant KL2TR001421. The content is solely the responsibility of the authors and does not necessarily represent the official views of the NIH.
References
- 1.Kort A George Washington’s Final Years - And Sudden, Agonizing Death. History. Published 2020. Accessed March 22, 2022. https://www.history.com/news/george-washington-final-years-death-mount-vernon [Google Scholar]
- 2.Morens DM. Death of a President. 10.1056/NEJM199912093412413. 2008;341(24):1845–1850. doi: 10.1056/NEJM199912093412413 [DOI] [PubMed] [Google Scholar]
- 3.Lesson 1: Introduction to Epidemiology. CDC. Published 2012. Accessed March 22, 2022. https://www.cdc.gov/csels/dsepd/ss1978/Lesson1/Section2.html#_ref5 [Google Scholar]
- 4.Hill AB. THE ENVIRONMENT AND DISEASE: ASSOCIATION OR CAUSATION? Proc R Soc Med. 1965;58(5):295–300. doi: 10.1177/003591576505800503 [DOI] [PMC free article] [PubMed] [Google Scholar]
- 5.Doll R Sir Austin Bradford Hill and the progress of medical science. BMJ Br Med J. 1992;305(6868):1521. doi: 10.1136/BMJ.305.6868.1521 [DOI] [PMC free article] [PubMed] [Google Scholar]
- 6.Rothman KJ. Causes. Am J Epidemiol. 1976;104(6):587–592. doi: 10.1093/OXFORDJOURNALS.AJE.A112335 [DOI] [PubMed] [Google Scholar]
- 7.North RL. Benjamin Rush MD: assassin or beloved healer? Proc (Bayl Univ Med Cent). 2000;13(1):45. doi: 10.1080/08998280.2000.11927641 [DOI] [PMC free article] [PubMed] [Google Scholar]
- 8.Donabedian A Evaluating the Quality of Medical Care. Milbank Q. 2005;83(4):691–729. doi: 10.1111/J.1468-0009.2005.00397.X [DOI] [PMC free article] [PubMed] [Google Scholar]
- 9.Santry HP, Strassels SA, Ingraham AM, Oslock WM, Ricci KB, Paredes AZ, Heh VK, Baselice HE, Rushing AP, Diaz A, et al. Identifying the fundamental structures and processes of care contributing to emergency general surgery quality using a mixed-methods Donabedian approach. BMC Med Res Methodol. 2020;20(1):1–19. doi: 10.1186/S12874-020-01096-7/PEER-REVIEW [DOI] [PMC free article] [PubMed] [Google Scholar]
- 10.Peskin GW. Quality care in surgery. Arch Surg. 2002;137(1):13–14. doi: 10.1001/ARCHSURG.137.1.13 [DOI] [PubMed] [Google Scholar]
- 11.Marti MC, Roche B. Quality control in outpatient surgery: what data are useful? Ambul Surg. 1998;6(1):21–23. doi: 10.1016/S0966-6532(97)10006-3 [DOI] [Google Scholar]
- 12.Copeland GP, Jones D, Walters M. POSSUM: a scoring system for surgical audit. Br J Surg. 1991;78(3):355–360. doi: 10.1002/BJS.1800780327 [DOI] [PubMed] [Google Scholar]
- 13.Khuri SF, Daley J, Henderson W, Hur K, Gibbs JO, Barbour G, Demakis J, Irvin G 3rd, Stremple JF, Grover F, et al. Risk adjustment of the postoperative mortality rate for the comparative assessment of the quality of surgical care: results of the National Veterans Affairs Surgical Risk Study. J Am Coll Surg. 1997;185(4):315–327. [PubMed] [Google Scholar]
- 14.Khuri SF, Daley J, Henderson WG. The Comparative Assessment and Improvement of Quality of Surgical Care in the Department of Veterans Affairs. Arch Surg. 2002;137(1):20–27. doi: 10.1001/ARCHSURG.137.1.20 [DOI] [PubMed] [Google Scholar]
- 15.History of ACS NSQIP. American College of Surgeons. Published 2022. Accessed March 25, 2022. https://www.facs.org/quality-programs/acs-nsqip/about/history
- 16.Ibrahim AM, Dimick JB. What Metrics Accurately Reflect Surgical Quality? Annu Rev Med. 2018;69:481–491. doi: 10.1146/annurev-med-060116-022805 [DOI] [PubMed] [Google Scholar]
- 17.Ibrahim AM, Hughes TG, Thumma JR, Dimick JB. Association of Hospital Critical Access Status With Surgical Outcomes and Expenditures Among Medicare Beneficiaries. JAMA. 2016;315(19):2095–2103. doi: 10.1001/JAMA.2016.5618 [DOI] [PubMed] [Google Scholar]
- 18.Birkmeyer JD, Stukel TA, Siewers AE, Goodney PP, Wennberg DE, Lucas FL. Surgeon volume and operative mortality in the United States. N Engl J Med. 2003;349(22):2117–2127. doi: 10.1056/NEJMSA035205 [DOI] [PubMed] [Google Scholar]
- 19.Birkmeyer JD, Siewers AE, Finlayson EVA, Stukel TA, Lucas FL, Batista I, Welch HG, Wennberg DE. Hospital volume and surgical mortality in the United States. N Engl J Med. 2002;346(15):1128–1137. doi: 10.1056/NEJMSA012337 [DOI] [PubMed] [Google Scholar]
- 20.Birkmeyer JD, Finks JF, O’Reilly A, Oerline M, Carlin AM, Nunn AR, Dimick J, Banerjee M, Birkmeyer NJO. Surgical skill and complication rates after bariatric surgery. N Engl J Med. 2013;369(15):1434–1442. doi: 10.1056/NEJMSA1300625 [DOI] [PubMed] [Google Scholar]
- 21.Habuchi T, Terachi T, Mimata H, Kondo Y, Kanayama H, Ichikawa T, Nutahara K, Miki T, Ono Y, Baba S, et al. Evaluation of 2,590 urological laparoscopic surgeries undertaken by urological surgeons accredited by an endoscopic surgical skill qualification system in urological laparoscopy in Japan. Surg Endosc. 2012;26(6):1656–1663. doi: 10.1007/S00464-011-2088-0 [DOI] [PubMed] [Google Scholar]
- 22.Tanigawa N, Lee SW, Kimura T, Mori T, Uyama I, Nomura E, Okuda J, Konishi F. The Endoscopic Surgical Skill Qualification System for gastric surgery in Japan. Asian J Endosc Surg. 2011;4(3):112–115. doi: 10.1111/J.1758-5910.2011.00082.X [DOI] [PubMed] [Google Scholar]
- 23.Pannucci CJ, Wilkins EG. Identifying and Avoiding Bias in Research. Plast Reconstr Surg. 2010;126(2):619. doi: 10.1097/PRS.0B013E3181DE24BC [DOI] [PMC free article] [PubMed] [Google Scholar]
- 24.Schlesselman JJ, Stolley PD. Case-Control Studies : Design, Conduct, Analysis. Oxford University Press; 1982. [Google Scholar]
- 25.Shortreed SM, Cook AJ, Coley RY, Bobb JF, Nelson JC. Challenges and Opportunities for Using Big Health Care Data to Advance Medical Science and Public Health. Am J Epidemiol. 2019;188(5):851–861. doi: 10.1093/AJE/KWY292 [DOI] [PubMed] [Google Scholar]
- 26.Casey JA, Schwartz BS, Stewart WF, Adler NE. Using Electronic Health Records for Population Health Research: A Review of Methods and Applications. 10.1146/annurev-publhealth-032315-021353. 2016;37:61–81. doi: [DOI] [PMC free article] [PubMed] [Google Scholar]
- 27.Hernán MA, Robins JM. Using Big Data to Emulate a Target Trial When a Randomized Trial Is Not Available. Am J Epidemiol. 2016;183(8):758–764. doi: 10.1093/AJE/KWV254 [DOI] [PMC free article] [PubMed] [Google Scholar]
- 28.Mansournia MA, Nicholas •, Jewell P, Greenland S. Case-control matching: effects, misconceptions, and recommendations. doi: 10.1007/s10654-017-0325-0 [DOI] [PMC free article] [PubMed]
- 29.Wang X, Cheng Z. Cross-Sectional Studies: Strengths, Weaknesses, and Recommendations. Chest. 2020;158(1):S65–S71. doi: 10.1016/J.CHEST.2020.03.012 [DOI] [PubMed] [Google Scholar]
- 30.Grimes DA, Schulz KF. An overview of clinical research: the lay of the land. Lancet (London, England). 2002;359(9300):57–61. doi: 10.1016/S0140-6736(02)07283-5 [DOI] [PubMed] [Google Scholar]
- 31.Lipsky AM, Greenland S. Causal Directed Acyclic Graphs. JAMA. 2022;327(11):1083–1084. doi: 10.1001/jama.2022.1816 [DOI] [PubMed] [Google Scholar]
- 32.Meng XL. Statistical paradises and paradoxes in big data (I): Law of large populations, big data paradox, and the 2016 US presidential election. 10.1214/18-AOAS1161SF. 2018;12(2):685–726. doi: 10.1214/18-AOAS1161SF [DOI] [Google Scholar]
- 33.Bradley VC, Kuriwaki S, Isakov M, Sejdinovic D, Meng XL, Flaxman S. Unrepresentative big surveys significantly overestimated US vaccine uptake. Nat 2021 6007890. 2021;600(7890):695–700. doi: 10.1038/s41586-021-04198-4 [DOI] [PMC free article] [PubMed] [Google Scholar]
- 34.Greenland S, Senn SJ, Rothman KJ, Carlin JB, Poole C, Goodman SN, Altman DG. Statistical tests, P values, confidence intervals, and power: a guide to misinterpretations. Eur J Epidemiol. 2016;31(4):337. doi: 10.1007/S10654-016-0149-3 [DOI] [PMC free article] [PubMed] [Google Scholar]
- 35.Hoenig JM, Heisey DM. The Abuse of Power. 10.1198/000313001300339897. 2012;55(1):19–24. doi: 10.1198/000313001300339897 [DOI] [Google Scholar]
- 36.Nuzzo R How scientists fool themselves - And how they can stop. Nature. 2015;526(7572):182–185. doi: 10.1038/526182A [DOI] [PubMed] [Google Scholar]


