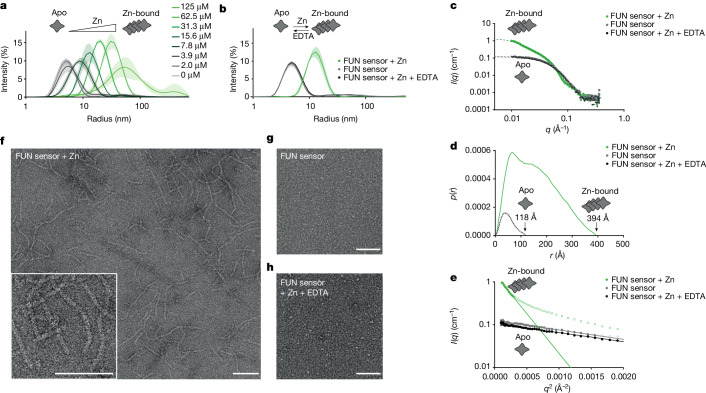
Fig. 3. The FUN sensor forms protein filaments in the presence of physiological concentrations of zinc.
a, DLS experiments with the FUN sensor in a zinc concentration series show that the particle size of the FUN sensor increases with zinc concentrations above 3.9–7.8 µM. b, The increase in particle size is reversible when zinc is removed using EDTA. c–e, SAXS analysis of the FUN sensor, showing c, scattering data, I(q), versus modulus of the scattering vector, q, of the FUN sensor in the apo and zinc-bound forms, and following zinc removal using EDTA. d, Pair distance-distribution (p(r)) plot with maximum distance (Dmax) indicated. e, Guinier plots of ln(I(q)) versus q2. Closed circles show data used in the fit and open circles are omitted data points. The p(r) function shows radii of gyration of 39 ± 1 Å for the pure FUN sensor sample and the EDTA plus zinc-containing sample, and 125 ± 1 Å for the zinc-bound sample. The values calculated from p(r) were slightly lower for all samples for the Guinier analysis. f–h, Negative-staining electron microscopy images of the FUN sensor showing filament structures in the presence of Zn (f), and no visible filaments in the absence of Zn (g) or when Zn is removed using EDTA (h). Scale bars, 100 nm.

