

Abstract
The school age period is characterized by significant physical and intellectual growth, necessitating the monitoring of macronutrient intake and its impact on weight and height. The objective of this study is to investigate the association between the quality and quantity of protein and fat consumption with anthropometric indices in primary school girls in Kerman. This cross-sectional analysis was conducted on primary school girls aged 6–12 (n 330) from ten schools in Kerman, Iran. A validated and reliable dish-based 185-item food frequency questionnaire was used. We calculated the amount of proteins and fats as the percentage of daily calories and grams per day. Plant-based and animal-based proteins were used to assess the protein quality. To assess the fat quality, we considered trans fatty acids (TFA), cholesterol, vegetable oils, solid vegetable oils, animal oils, omega-6 Polyunsaturated fatty acids (PUFAs), omega-3 PUFA, and (PUFAs + Monounsaturated fatty acids (MUFAs))/Saturated fatty acids (SFAs), PUFAs/SFA, and (MUFA + PUFA)/(SFA + TFA). There was a significant positive association between height-for-age z-score (HAZ) and plant protein (p < 0.001) and vegetable oils (p = 0.038) after adjustment. In higher tertiles of animal protein, weight-for-age z-score (WAZ) (p = 0.024) were significantly higher. A significant positive association was observed between omega-3 PUFA and mid-upper arm circumference (MUAC) (p = 0.039) and BMI-for-age z-score (BAZ) (p = 0.016). Our study emphasizes the importance of monitoring protein and fat intake in primary school girls for optimal growth. Positive associations were found between plant-based protein, vegetable oils and HAZ, as well as animal protein and WAZ, highlighting the impact of protein quality on growth indicators.
Keywords: Quality, Quantity, Protein, Fat, Anthropometric indices, Student, Kerman
Subject terms: Paediatric research, Nutrition
Introduction
Child growth is globally recognized as a key indicator of physical well-being in children1. Anthropometric indices such as weight, height, body mass index (BMI), and mid-upper arm circumference (MUAC) used to assess growth patterns and body composition in children and adolescents2. Overweight, obesity, thinness, and stunting are the most common nutritional and developmental disorders in children and adolescents with significant implications for their health and well-being3–6. According to weight-for-age, height-for-age, and weight-for-height, Kerman has malnutrition rates of 6.06, 5.58, and 75.9%, respectively, with malnutrition being more prevalent in girls than in boys7. Therefore, early identification and treatment of childhood developmental abnormalities should be considered.
Diet plays an important role in every child’s overall health and influences their development during chronic illnesses8. Research on elementary and high school students has shown that obesity and less-than-optimal child development outcomes are risk factors for chronic illnesses that are inversely correlated with low nutrition quality9,10. Hence, it is crucial to assess the quality of children's diets. Among macronutrients, proteins and fats are essential for energy and the expected growth process11. Studies have revealed that the type and quality of foods have a variety of impacts on body weight in addition to the quantity of each macronutrient, such as carbohydrates, proteins, and fats12.
In a previous study on Iranian children, lower protein and fat intake were associated with a higher risk of being underweight, while higher protein intake was associated with a higher risk of being overweight13. However, Pourhashemi et al. found no significant association between macronutrient intakes and anthropometric indices in primary school children14.
It is essential to monitor both the quantity and quality of macronutrients consumed by children to evaluate the quality of their diet and understand how it affects their weight and height status. The diet and health of girls are particularly important as they will become mothers and have a significant influence on their children's well-being. To the best our knowledge, this is the first study to assess the association between the quality and quantity of protein and fat intake with anthropometric indices among primary school girls in Kerman, Iran.
Method
Study design and subjects
Cross-sectional data were collected from 330 primary school girls in Kerman, Iran. Kerman is located in the southeast of Iran, with the administrative center in the city of Kerman. It is Iran's largest province and covers nearly 11 percent of the country's territory. The population of the region is about 3 million people (ranking 9th in the country). To calculate the required sample size for this study, the mean and standard deviation of BMI from a cross-sectional study conducted on 7–11-year-old Iranian children were used (Mean ± SD = 16.0 ± 2.9 kg/m2)15. Then, the sample size was calculated using the following formula: n = [(z1 − α/2)2 × s2]/d2, with d = 2% and alpha = 0.05. The calculated sample size is 323. To strengthen the study, the obtained number was estimated to be 330. The power of the study was 80%. We used cluster random-sampling methods to recruit children. Inclusion criteria included children aged 6–12 years old, without chronic diseases such as diabetes, congenital metabolic diseases like maple syrup urine disease and phenylketonuria, thyroid gland diseases, epilepsy, and asthma, and without the use of corticosteroids, thyroid medications, diabetes medications, epilepsy medications, or allergy medications. Children were excluded if their parents did not complete the consent form. The Ethics Committee of Tehran University of Medical Sciences approved the study protocol (IR.TUMS.MEDICINE.REC.1400.582). All methods were performed in accordance with guidelines and regulations of the Ethics Committee of Tehran University of Medical Sciences. Informed consent was obtained from all participants’ legal guardians.
Data collection tool
We used reliable and validated questionnaires, including the consent form, assessment of socioeconomic status, the International Physical Activity Questionnaire short form16, and a dish-based food frequency questionnaire (FFQ). The questionnaires were completed in person by asking the parents of the students.
Dietary intake
To assess participants' dietary intake, we designed a dish-based food frequency questionnaire. The reliability and validity of questionnaire were then evaluated. The parents of the children filled out this form. The frequency of children's consumption was determined by parents based on their consumption in the last year on a daily, weekly, or monthly basis. The weights listed for each food item were converted to grams using the instructions for home scales. The NUTRITIONIST 4 program (First Data Bank, San Bruno, California) was used to assess dietary intakes to estimate energy and nutrient consumption.
Demographic and socioeconomic status
Using a valid and reliable questionnaire created to measure SES and its association with health outcomes among Iranians, demographic and socioeconomic status (SES) were evaluated. The education and job of parents, family size, being a landlord or tenant, owning a car, number of cars, number of rooms in the house, and having appliances such as washing machine, dishwasher, LCD TV, side-by-side refrigerator, air conditioner, vacuum cleaner, computer, laptop, and advanced heating system were the items asked from parents17. To determine the socioeconomic status score, each questionnaire item was coded. Finally, the codes were summed and sorted into weak (1–5 scores), medium (6–10 scores), and rich (11–15 scores) categories for qualitative description.
Anthropometric indices
The anthropometry parameters—weight, height, and mid-upper arm circumference (MUAC)—were measured for all children. A digital scale with a precision of 100 g was used to measure body weight with minimal clothing and no shoes. Height was measured using a plastic tape attached to the wall with 0.1 cm precision while standing in a normal position without shoes. MUAC was measured using a tape at the point between the shoulder and elbow (i.e., the olecranon process and the acromion). Body weight (in kilograms) was divided by the square of height (in square meters) to calculate BMI. To calculate z-scores for BMI-for-age (BAZ), height-for-age (HAZ) and weight-for-age (WAZ), the guidelines of the World Health Organization (WHO) were used. Thus, BMI for age and sex were categorized as obese (BAZ ≥ 2 SD), overweight (BAZ ≥ 1 SD), healthy weight (BAZ ≥ − 1 SD and < − 1 SD), and underweight (BAZ < − 2 SD). Categories for HAZ are (HAZ ≤ − 2 SD) short stature and (HAZ ≤ − 3 SD) severe short stature. Categories for WAZ are as follows: − 3 SD < WAZ < − 1 SD is considered underweight, and WAZ ≤ − 2 SD is considered severely underweight18.
Physical activity
The International Physical Activity Questionnaire (IPAQ) short Form is used to assess physical activity (PA) as a covariate. Scores are determined based on the frequently and duration of engagement in low, moderate, high-intensity, and sedentary activities over the previous seven days. For further analysis, the proportion of daily minutes spent in moderate to vigorous physical activity (MVPA) was determined using formula outlined by Saint-Maurice et al.19. Thus, two categories were created: those who met physical activity guidelines (≥ 60 min per day) and those who did not meet them (< 60 min per day), based on the global recommendation of 60 min of MVPA per day (on average)20.
Quality and quantity of macronutrients
The amount of proteins and fats in children's diets was calculated as a percentage of daily calories and grams per day. The quality of consumed fats was evaluated by analyzing the sources of trans fatty acids (TFAs), vegetable oils, solid vegetable oils, animal oils, cholesterol (mg/1000 kcal), omega-6 Polyunsaturated fatty acid (PUFA), omega-3 PUFA, and (PUFAs + Monounsaturated fatty acids (MUFAs))/Saturated fatty acid (SFAs), PUFAs/SFAs, and (MUFAs + PUFAs)/(SFAs + TFAs)21,22. Dietary protein was segregated into two categories to assess its quality: plant-based and animal-based proteins and their sources. Food/drink sources for each fat and protein intake category are shown in Supplementary Table 1.
Validity and reliability of food frequency questionnaire
In this study, to determine the reproducibility, the questionnaire was completed by 56 parents 12 weeks apart and measured using the intra-class correlation coefficient. Three 24-h recalls were collected during the study. Pearson correlations and the Wilcoxon signed-rank test were used to assess validity. To evaluate the strength of the relation for both validity and reliability data, the following correlation rating interpretations were used: Pearson statistics—0.10 to 0.30 weak, 0.30 to 0.50 moderate, > 0.50 strong. ICC statistics—0.00 to 0.10 none, 0.11 to 0.40 slight, 0.41 to 0.60 fair, 0.61 to 0.80 moderate, and 0.81 to 1.0 substantial.
Data analysis
The normality of variables was examined using the histogram and Kolmogorov–Smirnov test. The logarithmic equivalent (Ln transformation) was used when analyzing variables with a non-normal distribution. To evaluate the relationship between protein and fat intake as independent variables and anthropometric indices as dependent variables, one-way ANOVA was utilized. Additionally, the chi-square test was used for descriptive characteristics (i.e., supplement use, socioeconomic level, etc.) to compare the distribution of individuals across groups. An analysis of covariance was conducted to adjust for potential confounding variables: model 2 adjusted for age, supplement use, parents’ smoking, physical activity, and socioeconomic status and model 3 adjusted for age, supplement use, parents’ smoking, physical activity, socioeconomic status, and energy intake. In order to determine the odds ratios and 95% confidence intervals for the risk of underweight and overweight/obesity across tertiles of anthropometric indices in unadjusted and adjusted models, binary logistic regression was used. The regression adjusted model adjusted for age, supplement use, parents' smoking, physical activity, socioeconomic status, and energy intake. In the crude and adjusted model, the first tertile served as the reference group, and odds ratio for other tertiles were calculated. Data were presented as mean ± standard deviation (or standard error) and odds ratio and 95% confidence interval. SPSS version 22 software was used for all statistical analyses, with a p-value < 0.05 considered statistically significant.
Ethics approval and consent to participate
The Human Ethical Committee of Tehran University of Medical Science approved the study protocol (IR.TUMS.MEDICINE.REC.1400.582). Informed consent was obtained from a parent and/or legal guardian in the study.
Results
Participant characteristics
Table 1 shows the sociodemographic characteristics of the participants. The mean age of the participants was 9.02 ± 1.813 years, with a mean BMI of 17.49 ± 3.93 kg/m2. Among the participants, 18.5% reported using dietary supplements. Additionally, 324 (98.1%) out of 330 participants failed to meet the physical activity guidelines outlined by the World Health Organization. One hundred and eighty-six participants were classified in the low socioeconomic group.
Table 1.
Characteristics of participants (primary school girls in Kerman) in tertiles of protein and fat quantities.
| Tertiles of macronutrients quantities (g) | |||||||||
|---|---|---|---|---|---|---|---|---|---|
| Variable | Tertiles of protein quantity | Tertiles of fat quantity | |||||||
| Tertile 1 ≤ 51.52 N = 110 |
Tertile 2 > 51.52 < 73.15 N = 110 |
Tertile 3 ≥ 73.15 N = 110 |
p value* | Tertile 1 ≤ 50.84 N = 110 |
Tertile 2 > 50.84 < 72.02 N = 110 |
Tertile 3 ≥ 72.02 N = 110 |
p value⃰ | ||
| Quantitative variablesa/mean ± SD | |||||||||
| Age (year) | 8.64 (1.79) | 9.03 (1.88) | 9.4 (1.76) | 0.007 | 8.75 (1.75) | 8.95 (1.87) | 9.37 (1.76) | 0.032 | |
| Weight (kg) | 28.42 (10.32) | 34.43 (12.37) | 38.58 (14.17) | 0.0001 | 28.91 (10.60) | 34.04 (12.26) | 38.48 (14.28) | 0.0001 | |
| Height (cm) | 131.74 (13.21) | 137.97 (13.37) | 140.32 (12.75) | 0.0001 | 132.96 (13.18) | 136.58 (13.88) | 140.5 (12.66) | 0.0001 | |
| BMI (kg/m2) | 15.90 (3.03) | 17.55 (3.57) | 19.01 (4.44) | 0.0001 | 15.86 (3.12) | 17.67 (3.47) | 18.93 (4.48) | 0.0001 | |
| MUAC (cm) | 20.44 (2.93) | 22.00 (3.55) | 23.48 (3.99) | 0.0001 | 20.46 (2.94) | 22.00 (3.42) | 23.46 (4.11) | 0.0001 | |
| Qualitative variablesb/N (%) | |||||||||
| Grade | 1st | 27 (8.2%) | 18 (5.5%) | 13 (3.9%) | 0.031 | 23 (7.0%) | 22 (6.7%) | 13 (3.9%) | 0.166 |
| 2nd | 22 (6.7%) | 14 (4.2%) | 15 (4.5%) | 22 (6.7%) | 14 (4.2%) | 15 (4.5%) | |||
| 3rd | 20 (6.1%) | 23 (7.0%) | 12 (3.6%) | 23 (7.0%) | 16 (4.8%) | 16 (4.8%) | |||
| 4th | 12 (3.6%) | 17 (5.2%) | 24 (7.3%) | 11 (3.3%) | 20 (6.1%) | 22 (6.7%) | |||
| 5th | 15 (4.5%) | 17 (5.2%) | 25 (7.6%) | 16 (4.8%) | 17 (5.2%) | 24 (7.3%) | |||
| 6th | 14 (4.2%) | 21 (6.4%) | 21 (6.4%) | 15 (4.5%) | 21 (6.4%) | 20 (6.1%) | |||
| Socioeconomic status | Low | 80 (24.2%) | 58 (17.6%) | 48 (14.5%) | 0.0001 | 78 (23.6%) | 61 (18.5%) | 47 (14.2%) | 0.001 |
| Medium | 30 (9.1%) | 50 (15.2%) | 57 (17.3%) | 31 (9.4%) | 47 (14.2%) | 59 (17.9%) | |||
| High | 0 (0%) | 2 (0.6%) | 5 (1.5%) | 1 (0.3%) | 2 (0.6%) | 4 (1.2%) | |||
| Supplement use | Yes | 13 (3.9%) | 18 (5.5%) | 29 (8.8%) | 0.017 | 9 (2.7%) | 22 (6.7%) | 29 (8.8%) | 0.002 |
| No | 97 (29.4%) | 92 (27.9%) | 81 (24.5%) | 101 (30.6%) | 88 (26.7%) | 81 (24.5%) | |||
| Parents' smoking | Yes | 11 (3.3%) | 11 (3.3%) | 16 (4.8%) | 0.475 | 9 (2.7%) | 12 (3.6%) | 17 (5.2%) | 0.233 |
| No | 99 (30.0%) | 99 (30.0%) | 94 (28.5%) | 101 (30.6%) | 98 (29.7%) | 93 (28.2%) | |||
| Physical activity | ≥ 60 min/day | 1 (0.3%) | 0 (0.0%) | 5 (1.5%) | 0.028 | 1 (0.3%) | 1 (0.3%) | 4 (1.2%) | 0.217 |
| < 60 min/day | 109 (33%) | 110 (33.3%) | 105 (31.8%) | 109 (33%) | 109 (33%) | 106 (32.1%) | |||
| Family member | 4 or less | 69 (21.2%) | 79 (23.9%) | 80 (24.5%) | 0.284 | 70 (21.2%) | 76 (23.0%) | 82 (24.8%) | 0.327 |
| 5 to 7 | 40 (12.1%) | 29 (8.8%) | 27 (8.2%) | 39 (11.8%) | 31 (9.4%) | 26 (7.9%) | |||
| More than 7 | 1 (0.3%) | 2 (0.6%) | 3 (0.9%) | 1 (0.3% | 3 (0.9%) | 2 (0.6%) | |||
BMI body mass index, MUAC mid-upper arm circumference. aThe p value reported for the quantitative variables was resulted from one-way ANOVA, and the numbers are reported as mean ± SD. bThe p value for the qualitative variables was calculated by the Chi-square test, and the results are based on N (%). *p value < 0.05 shows a significant level of association.
Validity and reliability of food frequency questionnaire
The results of this study demonstrate that the developed FFQ is reliable and valid. The correlation coefficients between dietary intake estimates obtained from the FFQ and 24-HRs recalls were 0.52 for carbohydrates, 0.54 for proteins, and 0.51 for fats. The Intraclass correlation coefficients used to assess the reproducibility of the FFQ ranged from 0.54 to 0.77 (Supplementary Table 2). Furthermore, most nutrient values did not show significant differences between the FFQ and 3-day dietary records, as indicated by the Wilcoxon signed-rank test (p ≥ 0.05). Therefore, this FFQ serves as a valuable tool for assessing dietary intake in this age group.
Dietary intake of participants
The mean consumption of energy, macronutrients, fatty acids, vitamins, minerals, and dietary groups across the three tertiles of macronutrient consumption are shown in Supplementary Table 3. All these intakes (except energy intake) were adjusted for energy intake. Intake of energy, cholesterol, MUFA, vitamins D, A, B2, B3, B5, B6, B12, and minerals including calcium, magnesium, zinc, phosphorus, iron, potassium, as well as dairy products, grains, and meat was significantly higher in the highest tertile of protein intake compared to the lowest tertile. With increasing fat intake, the intake of energy, cholesterol, PUFA, MUFA, SFA, vitamins D, B2, B5, B6, B12, and minerals including calcium, magnesium, zinc, phosphorus, potassium, as well as dairy products and meat group increased significantly.
Anthropometric indices across tertiles of protein and fat quantity
The results are indicated based on comparing tertile 3 with tertile 1. There was a significant direct association between protein and anthropometric indices, including MUAC (23.07 ± 0.29 vs. 20.88 ± 0.29 cm; p < 0.001), BAZ (0.65 ± 0.13 vs. − 0.34 ± 0.13; p < 0.001), and HAZ (0.77 ± 0.11 vs. 0.21 ± 0.11; p = 0.001) in Model 2. Additionally, anthropometric parameters including MUAC (23.09 ± 0.29 vs. 20.79 ± 0.29 cm; p < 0.001), BAZ (0.62 ± 0.13 vs. − 0.41 ± 0.13; p < 0.001), and HAZ (0.83 ± 0.11 vs. 0.32 ± 0.11; p = 0.012) increased significantly with an increase in fat consumption in model 2. No significant association was observed between anthropometric indices and protein and fat quantity after adjusting for energy intake in model 3. The adjustment models showed no significant association between protein and fat intake with WAZ (Supplementary Table 4).
Anthropometric indices across tertiles of protein and fat quality
Both animal and plant-based protein sources were positively associated with anthropometric indices including MUAC (Animal: 23.09 ± 0.30 vs. 20.77 ± 0.29 cm; p < 0.001, Plant: 22.78 ± 0.30 vs. 20.75 ± 0.29 cm; p < 0.001), BAZ (Animal: 0.66 ± 0.13 vs. − 0.35 ± 0.13; p < 0.001, Plant: 0.56 ± 0.13 vs. − 0.36 ± 0.13; p < 0.001) and HAZ (Animal: 0.86 ± 0.11 vs. 0.23 ± 0.11; p = 0.001, Plant: 0.67 ± 0.11 vs. 0.15 ± 0.11; p < 0.001) in model 2. No significant association was observed between protein source intake and WAZ in model 2 (Table 2). After further adjusting for energy intake, we found a significant direct association between WAZ and animal protein sources (2.38 ± 1.23 vs. − 2.87 ± 1.12; p = 0.024), and between HAZ and plant protein sources (0.48 ± 0.16 vs. 0.34 ± 0.16; p < 0.001). Similarly, a significant association was observed between the intake of various fatty acid sources, including vegetable oil, cholesterol, omega-6 PUFA, and omega-3 PUFA, with anthropometric indices (including MUAC, BAZ, and HAZ), which was maintained after adjusting for confounders for vegetable oil, cholesterol, and omega-6 PUFA (model 2). The association between omega-3 PUFA and HAZ disappeared after adjustment (model 2). The significant direct association between solid vegetable oils and MUAC (23.33 ± 3.94 vs. 20.30 ± 2.76; p < 0.001) and HAZ (0.81 ± 1.07 vs. 0.46 ± 1.15; p = 0.036), but this association was not observed after adjustment in model 2. In model 3, we observed a significant direct association between HAZ and vegetable oil (0.68 ± 0.13 vs. 0.31 ± 0.13; p = 0.038) and between omega-3 PUFA and BAZ (0.51 ± 0.15 vs. 0.07 ± 0.08; p = 0.016) and MUAC (22.60 ± 0.34 vs. 21.76 ± 0.19; p = 0.039). In the higher tertile of animal oils, MUAC (22.46 ± 3.72 vs. 22.29 ± 3.86 cm; p = 0.041) and HAZ (0.82 ± 1.14 vs. 0.38 ± 1.33; p = 0.034) were significantly higher, but this association was not detected in the adjustment models. A significant positive relationship was observed between TFAs and MUAC after adjustment in model 2 (22.57 ± 0.29 vs. 21.45 ± 0.29 cm; p = 0.025). No significant association was found between various fatty acid sources and the WAZ of subjects (Tables 3, 4, 5, 6, 7).
Table 2.
Association between anthropometric indices and protein quality (animal and plant protein) among primary school girls in Kerman.
| Tertiles of protein quality | |||||||||
|---|---|---|---|---|---|---|---|---|---|
| Variable | Tertiles of animal protein | Tertiles of plant protein | |||||||
| Tertile 1 ≤ 30.14 N = 110 |
Tertile 2 > 30.14 < 44.32 N = 110 |
Tertile 3 ≥ 44.32 N = 110 |
p value* | Tertile 1 ≤ 20.76 N = 109 |
Tertile 2 > 20.76 < 28.4 N = 111 |
Tertile 3 ≥ 28.4 N = 110 |
p value* | ||
| MUAC (cm) | Model 1a | 20.49 (2.87) | 21.91 (3.66) | 23.51 (3.93) | < 0.001 | 20.30 (2.76) | 22.27 (3.72) | 23.33 (3.94) | < 0.001 |
| Model 2b | 20.77 (0.29) | 22.05 (0.28) | 23.09 (0.30) | < 0.001 | 20.75 (0.29) | 22.37 (0.28) | 22.78 (0.30) | < 0.001 | |
| Model 3c | 21.25 (0.35) | 22.03 (0.28) | 22.63 (0.34) | 0.061 | 21.60 (0.41) | 22.38 (0.28) | 21.93 (0.42) | 0.174 | |
| BAZ | Model 1a | − 0.42 (1.34) | 0.24 (1.39) | 0.73 (1.40) | < 0.001 | − 0.45 (1.33) | 0.33 (1.45) | 0.65 (1.35) | < 0.001 |
| Model 2b | − 0.35 (0.13) | 0.23 (0.13) | 0.66 (0.13) | < 0.001 | − 0.36 (0.13) | 0.34 (0.13) | 0.56 (0.13) | < 0.001 | |
| Model 3c | − 0.11 (0.16) | 0.23 (0.12) | 0.44 (0.16) | 0.105 | 0.02 (0.19) | 0.35 (0.12) | 0.17 (0.19) | 0.246 | |
| HAZ | Model 1a | 0.16 (1.32) | 0.69 (1.14) | 0.90 (1.08) | < 0.001 | 0.10 (1.28) | 0.92 (1.11) | 0.73 (1.12) | < 0.001 |
| Model 2b | 0.23 (0.11) | 0.67 (0.11) | 0.86 (0.11) | 0.001 | 0.15 (0.11) | 0.93 (0.11) | 0.67 (0.11) | < 0.001 | |
| Model 3c | 0.32 (0.14) | 0.67 (0.11) | 0.77 (0.13) | 0.107 | 0.34 (0.16) | 0.94 (0.11) | 0.48 (0.16) | < 0.001 | |
| WAZ | Model 1a | − 1.74 (13.58) | 0.47 (1.32) | 0.99 (1.28) | 0.073 | − 0.26 (1.22) | 0.66 (1.32) | − 0.95 (14.98) | 0.454 |
| Model 2b | − 1.70 (0.91) | 0.38 (0.88) | 1.05 (0.98) | 0.107 | − 0.05 (0.90) | 0.68 (0.89) | − 1.25 (1.03) | 0.378 | |
| Model 3c | − 2.87 (1.12) | 0.39 (0.87) | 2.38 (1.23) | 0.024 | 1.28 (1.29) | 0.60 (0.89) | − 2.78 (1.48) | 0.139 | |
MUAC mid-upper arm circumference, BAZ BMI-for-age z-score, HAZ height-for-age z-score, WAZ weight-for-age z-score.
aModel 1 was resulted from one-way ANOVA, and the numbers are reported as mean ± SD. Model 1: crude.
bModel 2 was resulted from covariance analysis, and the numbers are reported as mean ± SE. Model 2: Adjusted for age, supplement use, parents' smoking, physical activity, and socioeconomic status.
cModel 3: Model 2 + energy intake.
*p value < 0.05 shows a significant level of association.
Table 3.
Association between anthropometric indices and fat quality (vegetable oil and solid vegetable oil) among primary school girls in Kerman.
| Tertiles of fat quality | |||||||||
|---|---|---|---|---|---|---|---|---|---|
| Variable | Tertiles of vegetable oil | Tertiles of solid vegetable oil | |||||||
| Tertile 1 ≤ 7.61 N = 105 |
Tertile 2 > 7.61 < 9.84 N = 115 |
Tertile 3 ≥ 9.84 N = 110 |
p value* | Tertile 1 ≤ 0.4 N = 129 |
Tertile 2 > 0.4 < 1.4 N = 76 |
Tertile 3 ≥ 1.4 N = 125 |
p value* | ||
| MUAC (cm) | Model 1a | 20.49 (2.87) | 21.91 (3.66) | 23.51 (3.93) | < 0.001 | 20.30 (2.76) | 22.27 (3.72) | 23.33 (3.94) | < 0.001 |
| Model 2b | 20.77 (0.29) | 22.05 (0.28) | 23.09 (0.30) | < 0.001 | 20.75 (0.29) | 22.37 (0.28) | 22.78 (0.30) | 0.359 | |
| Model 3c | 21.91 (0.33) | 21.85 (0.27) | 22.16 (0.33) | 0.785 | 22.13 (0.27) | 21.91 (0.33) | 21.85 (0.28) | 0.782 | |
| BAZ | Model 1a | − 0.24 (1.46) | 0.10 (1.29) | 0.67 (1.47) | < 0.001 | 0.04 (1.48) | 0.18 (1.48) | 0.32 (1.40) | 0.317 |
| Model 2b | − 0.14 (0.13) | 0.12 (0.13) | 0.56 (0.13) | 0.002 | 0.01 (0.12) | 0.23 (0.16) | 0.32 (0.12) | 0.229 | |
| Model 3c | 0.17 (0.15) | 0.14 (0.12) | 0.23 (0.15) | 0.885 | 0.21 (0.12) | 0.218 (0.15) | 0.13 (0.12) | 0.898 | |
| HAZ | Model 1a | 0.17 (1.28) | 0.71 (1.23) | 0.86 (1.06) | < 0.001 | 0.46 (1.15) | 0.44 (1.50) | 0.81 (1.07) | 0.036 |
| Model 2b | 0.20 (0.11) | 0.75 (0.10) | 0.79 (0.11) | < 0.001 | 0.50 (0.10) | 0.46 (0.13) | 0.76 (0.10) | 0.140 | |
| Model 3c | 0.31 (0.13) | 0.75 (0.10) | 0.68 (0.13) | 0.038 | 0.60 (0.11) | 0.45 (0.13) | 0.66 (0.11) | 0.486 | |
| WAZ | Model 1a | − 0.08 (1.28) | − 0.95 (13.36) | 0.79 (1.39) | 0.398 | 0.27 (1.37) | − 1.78 (16.67) | 0.45 (1.26) | 0.214 |
| Model 2b | − 0.064 (0.91) | − 0.94 (0.88) | 0.76 (0.98) | 0.443 | 0.20 (0.84) | − 1.84 (1.08) | 0.56 (0.86) | 0.196 | |
| Model 3c | − 0.17 (1.06) | − 0.94 (0.88) | 0.90 (1.17) | 0.447 | 0.24 (0.88) | − 1.84 (1.08) | 0.52 (0.90) | 0.200 | |
MUAC mid-upper arm circumference, BAZ BMI-for-age z-score, HAZ height-for-age z-score, WAZ weight-for-age z-score.
aModel 1 was resulted from one-way ANOVA, and the numbers are reported as mean ± SD. Model 1: crude.
bModel 2 was resulted from covariance analysis, and the numbers are reported as mean ± SE. Model 2: Adjusted for age, supplement use, parents' smoking, physical activity, and socioeconomic status.
cModel 3: Model 2 + energy intake.
*p value < 0.05 shows a significant level of association.
Table 4.
Association between anthropometric indices and fat quality (animal oil and cholesterol) among primary school girls in Kerman.
| Tertiles of fat quality | |||||||||
|---|---|---|---|---|---|---|---|---|---|
| Variable | Tertiles of animal oil | Tertiles of cholesterol | |||||||
| Tertile 1 ≤ 1.06 N = 85 |
Tertile 2 > 1.06 < 2.22 N = 131 |
Tertile 3 ≥ 2.22 N = 114 |
p value* | Tertile 1 ≤ 209.86 N = 110 |
Tertile 2 > 209.86 < 302.96 N = 110 |
Tertile 3 ≥ 302.96 N = 110 |
p value* | ||
| MUAC (cm) | Model 1a | 22.29 (3.86) | 21.34 (3.56) | 22.46 (3.72) | 0.041 | 20.88 (3.12) | 21.84 (3.70) | 23.2 (3.95) | 0.0001 |
| Model 2b | 22.02 (0.34) | 21.80 (0.27) | 22.13 (0.29) | 0.724 | 21.12 (0.29) | 21.79 (0.28) | 23.00 (0.29) | 0.0001 | |
| Model 3c | 22.45 (0.33) | 21.92 (0.26) | 21.86 (0.29) | 0.234 | 21.72 (0.33) | 21.82 (0.28) | 22.38 (0.34) | 0.398 | |
| BAZ | Model 1a | 0.16 (1.53) | 0.09 (1.47) | 0.30 (1.37) | 0.519 | − 0.23 (1.44) | 0.08 (1.42) | 0.69 (1.34) | 0.0001 |
| Model 2b | 0.15 (0.15) | 0.13 (0.12) | 0.26 (0.13) | 0.783 | − 0.15 (0.13) | 0.06 (0.13) | 0.64 (0.13) | 0.0001 | |
| Model 3c | 0.34 (0.15) | 0.18 (0.12) | 0.05 (0.13) | 0.387 | 0.13 (0.15) | 0.07 (0.13) | 0.33 (0.15) | 0.438 | |
| HAZ | Model 1a | 0.38 (1.33) | 0.52 (1.19) | 0.82 (1.14) | 0.034 | 0.18 (1.3) | 0.66 (1.2) | 0.92 (1.05) | 0.0001 |
| Model 2b | 0.48 (0.13) | 0.51 (0.10) | 0.76 (0.11) | 0.183 | 0.24 (0.11) | 0.67 (0.11) | 0.85 (0.11) | 0.001 | |
| Model 3c | 0.57 (0.13) | 0.53 (0.10) | 0.66 (0.11) | 0.729 | 0.33 (0.13) | 0.67 (0.11) | 0.75 (0.13) | 0.100 | |
| WAZ | Model 1a | − 1.93 (16.52) | 0.35 (1.26) | 0.51 (1.28) | 0.154 | − 1.52 (13.53) | 0.31 (1.35) | 0.90 (1.24) | 0.131 |
| Model 2b | − 1.74 (1.09) | 0.25 (0.79) | 0.51 (0.93) | 0.247 | − 1.37 (0.90) | 0.27 (0.93) | 0.78 (0.93) | 0.227 | |
| Model 3c | − 1.80 (1.13) | 0.24 (0.79) | 0.56 (0.96) | 0.247 | − 2.11 (1.07) | 0.213 (0.93) | 1.64 (1.15) | 0.109 | |
MUAC mid-upper arm circumference, BAZ BMI-for-age z-score, HAZ height-for-age z-score, WAZ weight-for-age z-score.
aModel 1 was resulted from one-way ANOVA, and the numbers are reported as mean ± SD. Model 1: crude.
bModel 2 was resulted from covariance analysis, and the numbers are reported as mean ± SE. Model 2: Adjusted for age, supplement use, parents' smoking, physical activity, and socioeconomic status.
cModel 3: Model 2 + energy intake.
*p value < 0.05 shows a significant level of association.
Table 5.
Association between anthropometric indices and fat quality (omega-6 PUFAs and omega-3 PUFAs) among primary school girls in Kerman.
| Tertiles of fat quality | ||||||||
|---|---|---|---|---|---|---|---|---|
| Variable | Tertiles of omega-6 PUFAs | Tertiles of omega-3 PUFAs | ||||||
| Tertile 1 ≤ 9.55 N = 110 |
Tertile 2 > 9.55 < 12.88 N = 110 |
Tertile 3 ≥ 12.88 N = 110 |
p value* | Equal or less than median ≥ 0.019 N = 247 |
More than median < 0.019 N = 83 |
p value* | ||
| MUAC (cm) | Model 1a | 20.82 (3.09) | 21.76 (3.46) | 23.33 (4.12) | 0.0001 | 21.51 (3.45) | 23.34 (4.14) | 0.0001 |
| Model 2b | 21.24 (0.29) | 21.86 (0.28) | 22.82 (0.29) | 0.001 | 21.62 (0.19) | 23.01 (0.34) | 0.001 | |
| Model 3c | 22.29 (0.38) | 21.90 (0.28) | 21.72 (0.39) | 0.661 | 21.76 (0.19) | 22.60 (0.34) | 0.039 | |
| BAZ | Model 1a | − 0.33 (1.41) | 0.23 (1.38) | 0.65 (1.40) | 0.0001 | − 0.02 (1.42) | 0.80 (1.35) | 0.0001 |
| Model 2b | − 0.23 (0.13) | 0.23 (0.13) | 0.55 (0.13) | 0.0001 | 0.01 (0.08) | 0.70 (0.15) | 0.0001 | |
| Model 3c | 0.19 (0.17) | 0.24 (0.12) | 0.10 (0.18) | 0.804 | 0.07 (0.08) | 0.51 (0.15) | 0.016 | |
| HAZ | Model 1a | 0.32 (1.36) | 0.62 (1.14) | 0.82 (1.11) | 0.009 | 0.48 (1.21) | 0.91 (1.20) | 0.006 |
| Model 2b | 0.35 (0.11) | 0.63 (0.11) | 0.78 (0.11) | 0.037 | 0.51 (0.07) | 0.81 (0.13) | 0.055 | |
| Model 3c | 0.60 (0.15) | 0.64 (0.11) | 0.52 (0.15) | 0.794 | 0.55 (0.07) | 0.71 (0.13) | 0.327 | |
| WAZ | Model 1a | − 0.04 (1.33) | − 1.10 (13.99) | 0.81 (1.38) | 0.336 | − 0.51 (9.31) | 0.99 (1.34) | 0.208 |
| Model 2b | 0.145 (0.87) | − 1.41 (0.92) | 0.91 (0.97) | 0.212 | − 0.44 (0.61) | 0.77 (0.77) | 0.339 | |
| Model 3c | − 0.08 (1.21) | − 1.40 (0.92) | 1.17 (1.37) | 0.211 | − 0.44 (0.62) | 0.79 (1.13) | 0.354 | |
MUAC mid-upper arm circumference, BAZ BMI-for-age z-score, HAZ height-for-age z-score, WAZ weight-for-age z-score, PUFA polyunsaturated fatty acid.
aModel 1 was resulted from one-way ANOVA, and the numbers are reported as mean ± SD. Model 1: crude.
bModel 2 was resulted from covariance analysis, and the numbers are reported as mean ± SE. Model 2: Adjusted for age, supplement use, parents' smoking, physical activity, and socioeconomic status.
cModel 3: Model 2 + energy intake.
*p value < 0.05 shows a significant level of association.
Table 6.
Association between anthropometric indices and fat quality (trans fatty acids and PUFAs/SFAs) among primary school girls in Kerman.
| Tertiles of fat quality | |||||||||
|---|---|---|---|---|---|---|---|---|---|
| Variable | Tertiles of TFAs | Tertiles of PUFAs/SFAs | |||||||
| Tertile 1 ≤ 0.41 N = 108 |
Tertile 2 > 0.41 < 0.71 N = 111 |
Tertile 3 ≥ 0.71 N = 111 |
p value* | Tertile 1 ≤ 1.46 N = 103 |
Tertile 2 > 1.46 < 1.65 N = 115 |
Tertile 3 ≥ 1.65 N = 112 |
p value* | ||
| MUAC (cm) | Model 1a | 21.47 (3.21) | 21.91 (3.71) | 22.52 (4.13) | 0.111 | 22.42 (3.47) | 21.58 (3.41) | 21.96 (4.20) | 0.247 |
| Model 2b | 21.45 (0.29) | 21.88 (0.29) | 22.57 (0.29) | 0.025 | 22.32 (0.30) | 21.82 (0.29) | 21.80 (0.29) | 0.384 | |
| Model 3c | 21.95 (0.30) | 21.80 (0.28) | 22.16 (0.29) | 0.680 | 22.26 (0.29) | 21.86 (0.28) | 21.82 (0.28) | 0.495 | |
| BAZ | Model 1a | − 0.00 (1.40) | 0.15 (1.51) | 0.39 (1.43) | 0.115 | 0.32 (1.38) | 0.22 (1.40) | 0.01 (1.56) | 0.293 |
| Model 2b | 0.01 (0.13) | 0.11 (0.13) | 0.41 (0.13) | 0.100 | 0.30 (0.13) | 0.25 (0.13) | 0.00 (0.13) | 0.240 | |
| Model 3c | 0.26 (0.13) | 0.08 (0.12) | 0.21 (0.13) | 0.618 | 0.276 (0.13) | 0.274 (0.12) | 0.007 (0.12) | 0.247 | |
| HAZ | Model 1a | 0.41 (1.40) | 0.61 (1.12) | 0.74 (1.12) | 0.127 | 0.68 (1.12) | 0.63 (1.23) | 0.46 (1.31) | 0.377 |
| Model 2b | 0.44 (0.11) | 0.60 (0.11) | 0.72 (0.11) | 0.212 | 0.64 (0.11) | 0.61 (0.11) | 0.52 (0.11) | 0.736 | |
| Model 3c | 0.56 (0.12) | 0.58 (0.11) | 0.62 (0.11) | 0.945 | 0.62 (0.11) | 0.62 (0.11) | 0.52 (0.11) | 0.770 | |
| WAZ | Model 1a | 0.10 (1.31) | 0.35 (1.34) | − 0.82 (13.61) | 0.610 | 0.55 (1.24) | 0.51 (1.37) | − 1.51 (14.05) | 0.182 |
| Model 2b | 0.19 (0.94) | 0.21 (0.91) | − 0.77 (0.89) | 0.676 | 0.43 (0.95) | 0.60 (0.88) | − 1.50 (0.93) | 0.216 | |
| Model 3c | 0.41 (1.01) | 0.18 (0.91) | − 0.94 (0.93) | 0.583 | 0.42 (0.96) | 0.59 (0.88) | − 1.50 (0.93) | 0.219 | |
MUAC mid-upper arm circumference, BAZ BMI-for-age z-score, HAZ height-for-age z-score, WAZ weight-for-age z-score, PUFA polyunsaturated fatty acid, SFA saturated fatty acid, TFA trans fatty acid.
aModel 1 was resulted from one-way ANOVA, and the numbers are reported as mean ± SD. Model 1: crude.
bModel 2 was resulted from covariance analysis, and the numbers are reported as mean ± SE. Model 2: Adjusted for age, supplement use, parents' smoking, physical activity, and socioeconomic status.
cModel 3: Model 2 + energy intake.
*p value < 0.05 shows a significant level of association.
Table 7.
Association between anthropometric indices and fat quality (PUFAs + MUFAs/SFAs and (MUFAs + PUFAs)/(SFAs + TFAs)) among primary school girls in Kerman.
| Tertiles of fat quality | |||||||||
|---|---|---|---|---|---|---|---|---|---|
| Variable | Tertiles of PUFAs + MUFAs/SFAs | Tertiles of (MUFAs + PUFAs)/(SFAs + TFAs) | |||||||
| Tertile 1 ≤ 0.59 N = 103 |
Tertile 2 > 0.59 < 0.7 N = 115 |
Tertile 3 ≥ 0.7 N = 112 |
p value* | Tertile 1 ≤ 1.42 N = 99 |
Tertile 2 > 1.42 < 1.6 N = 117 |
Tertile 3 ≥ 1.6 N = 114 |
p value* | ||
| MUAC (cm) | Model 1a | 22.37 (3.65) | 21.61 (3.17) | 21.97 (4.26) | 0.322 | 22.31 (3.59) | 21.76 (3.29) | 21.90 (4.22) | 0.538 |
| Model 2b | 22.31 (0.30) | 21.75 (0.28) | 21.89 (0.29) | 0.390 | 22.20 (0.31) | 21.89 (0.28) | 21.86 (0.29) | 0.686 | |
| Model 3c | 22.26 (0.29) | 21.81 (0.27) | 21.87 (0.28) | 0.481 | 22.17 (0.29) | 21.92 (0.27) | 21.85 (0.28) | 0.715 | |
| BAZ | Model 1a | 0.36 (1.51) | 0.10 (1.27) | 0.09 (1.57) | 0.306 | 0.27 (1.43) | 0.21 (1.32) | 0.07 (1.60) | 0.569 |
| Model 2b | 0.34 (0.13) | 0.12 (0.13) | 0.09 (0.13) | 0.372 | 0.25 (0.14) | 0.23 (0.13) | 0.07 (0.13) | 0.575 | |
| Model 3c | 0.32 (0.13) | 0.14 (0.12) | 0.08 (0.12) | 0.422 | 0.24 (0.13) | 0.24 (0.12) | 0.06 (0.12) | 0.526 | |
| HAZ | Model 1a | 0.67 (1.23) | 0.61 (1.17) | 0.49 (1.28) | 0.554 | 0.62 (1.25) | 0.63 (1.12) | 0.51 (1.30) | 0.704 |
| Model 2b | 0.61 (0.11) | 0.58 (0.11) | 0.57 (0.11) | 0.961 | 0.58 (0.12) | 0.60 (0.11) | 0.58 (0.11) | 0.991 | |
| Model 3c | 0.60 (0.11) | 0.59 (0.11) | 0.56 (0.11) | 0.970 | 0.57 (0.11) | 0.61 (0.11) | 0.58 (0.11) | 0.974 | |
| WAZ | Model 1a | 0.64 (1.32) | 0.37 (1.30) | − 1.44 (14.05) | 0.209 | 0.49 (1.25) | 0.52 (1.34) | − 1.40 (13.80) | 0.221 |
| Model 2b | 0.49 (0.94) | 0.47 (0.88) | − 1.42 (0.93) | 0.260 | 0.37 (0.98) | 0.61 (0.87) | − 1.40 (0.91) | 0.245 | |
| Model 3c | 0.49 (0.95) | 0.47 (0.89) | − 1.42 (0.94) | 0.261 | 0.37 (0.98) | 0.61 (0.87) | − 1.39 (0.92) | 0.249 | |
MUAC mid-upper arm circumference, BAZ BMI-for-age z-score, HAZ height-for-age z-score, WAZ weight-for-age z-score, PUFA polyunsaturated fatty acid, MUFA monounsaturated fatty acid, SFA saturated fatty acid, TFA trans fatty acids.
aModel 1 was resulted from one-way ANOVA, and the numbers are reported as mean ± SD. Model 1: crude.
bModel 2 was resulted from covariance analysis, and the numbers are reported as mean ± SE. Model 2: Adjusted for age, supplement use, parents' smoking, physical activity, and socioeconomic status.
cModel 3: Model 2 + energy intake.
*p value < 0.05 shows a significant level of association.
Odds ratio and 95% confidence interval for weight disorders in tertiles of protein and fat quantity
Figure 1 illustrates the odds ratio and 95% confidence interval for underweight, overweight, and obesity in tertiles of protein and fat quantity. A significant association was observed between protein (OR: 0.24; 95% CI: 0.13–0.44; p trend: < 0.001) and fat intake (OR: 0.22; 95% CI: 0.12–0.43; p trend: < 0.001) with overweight and obesity in the crude model. Similarly, an association was seen between protein (OR: 4.36; 95% CI: 1.19–15.93; p trend: 0.017) and fat intake (OR: 6.61; 95% CI: 1.44–30.28; p trend: 0.009) and underweight before adjusting for confounders. However, after adjustment, no significant association was found between underweight and overweight/obesity and protein and fat intake.
Figure 1.
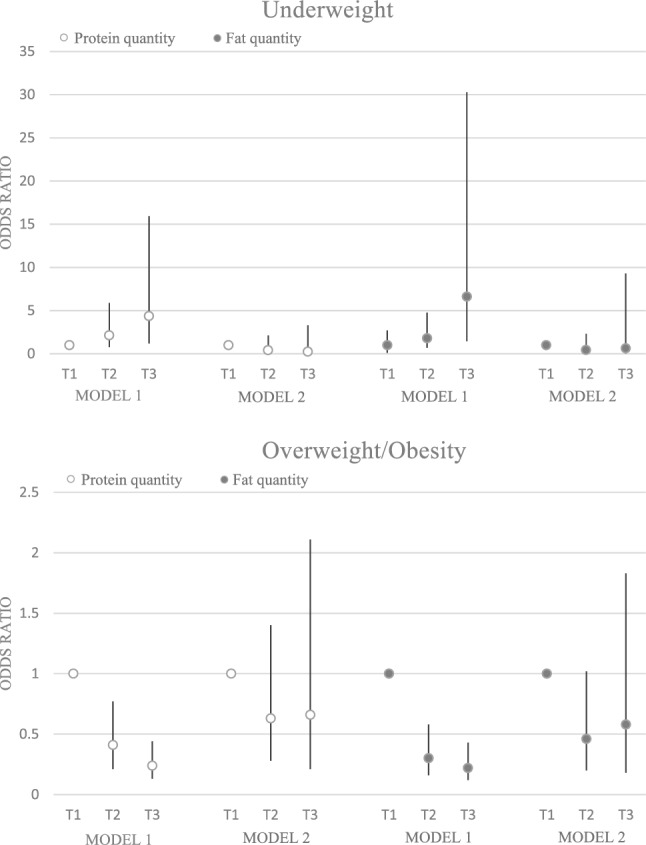
Odds ratio and 95% confidence interval for weight disorders in tertile of protein and fat quantities. Model 1: crude. Model 2: Adjusted for age, supplement use, parents' smoking, physical activity, socioeconomic status, and energy intake.
Odds ratio and 95% confidence interval for weight disorders in tertiles of protein and fat quality
A significant association was observed between animal-based protein and underweight (OR: 14.6; 95% CI: 1.87–113.73; p trend: 0.002), and overweight/obesity (OR: 0.21; 95% CI: 0.11–0.40; p trend: < 0.001). This association did not remain significant after adjustment for confounders. There was a significant positive association between plant-based protein and underweight (OR: 4.41; 95% CI: 1.20–16.10; p trend: 0.016) and overweight/obesity (OR: 021; 95% CI: 0.11–0.41; p trend: < 0.001) before adjustment; however, no significant association was observed after adjustment between plant protein and weight disorders (including underweight, overweight and obesity) (p trend ≥ 0.05) (Fig. 2).
Figure 2.
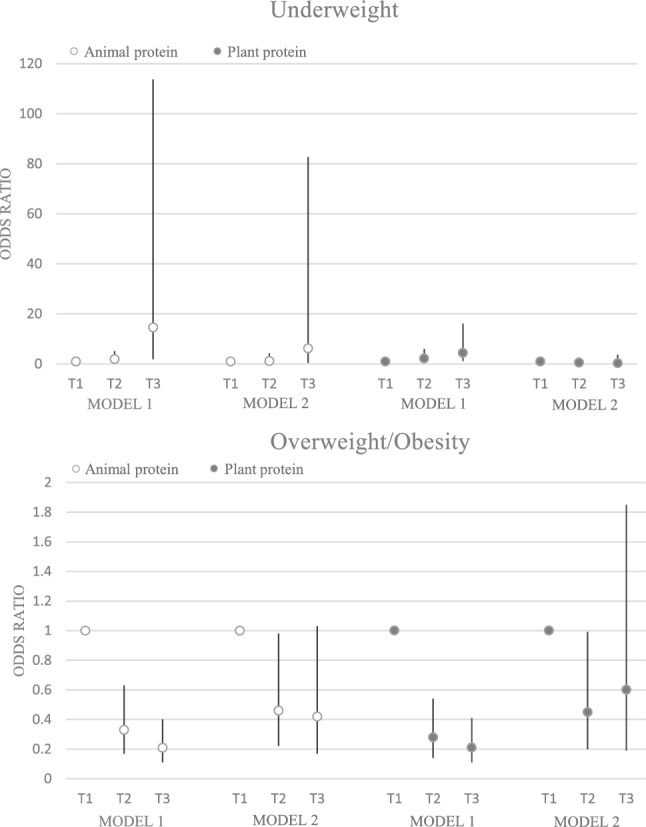
Odds ratio and 95% confidence interval for weight disorders in tertile of protein quality. Model 1: crude. Model 2: Adjusted for age, supplement use, parents' smoking, physical activity, socioeconomic status, and energy intake.
Significant associations were found between underweight and vegetable oil, cholesterol, omega-6, PUFAs/SFAs, (PUFAs + MUFAs)/SFAs, and (MUFAs + PUFAs)/(SFAs + TFAs) (p < 0.05), Which remained significant for (MUFAs + PUFAs)/(SFAs + TFAs) after adjustment (p = 0.040) (Fig. 3). Additionally, we found significant associations between vegetable oil (p trend < 0.001), cholesterol (p trend = 0.001), omega-6 PUFA (p trend < 0.001) and omega-3 PUFA (p trend = 0.001) and overweight in the crude model, which disappeared after adjusting for confounding variables (p trend ≥ 0.05) (Fig. 4).
Figure 3.

Odds ratio and 95% confidence interval for underweight in tertile of fat quality. Model 1: crude. Model 2: Adjusted for age, supplement use, parents' smoking, physical activity, socioeconomic status, and energy intake.
Figure 4.

Odds ratio and 95% confidence interval for overweight/obesity in tertile of fat quality. Model 1: crude. Model 2: Adjusted for age, supplement use, parents' smoking, physical activity, socioeconomic status, and energy intake.
Discussion
To the best of our knowledge, this study is the first to investigate the association between the quality and quantity of protein and fat consumption with selected anthropometric indices among primary school girls in Kerman. The findings showed a positive association between animal protein intake and WAZ, plant protein intake and HAZ, and vegetable oils intake and HAZ. Moreover, a significant positive association was found between the intake of omega-3 PUFA and MUAC and BAZ. Furthermore, the risk of underweight decreased with an increase in the ratio of (MUFAs + PUFAs) to (SFAs + TFAs).
Our study found a positive association between protein intake and anthropometric indices, indicating that higher protein intake is associated with increased body size and weight. Most studies that investigated the relationship between protein quantity and anthropometric indicators had similar results to our study. Among these studies, we can mention the study by Koletzko et al.23 and Markides et al.24. However, this association disappeared when further adjusted for energy intake in model 3. This suggests that the observed relationship in model 2 may be confounded by energy intake. It is possible that individuals with higher protein intake also consume more energy, leading to increased body size and weight. In a research evaluating the effects of a high-protein diet with energy restriction on weight loss and hunger in overweight and obese children, it was found that a high-protein diet had no more significant effect on weight loss, body composition, or changes in appetite or mood compared to a standard diet25. The main difference between our study and this intervention is that their population is overweight and obese children, which can affect the results.
Consistent with previous findings, in the model 2 of the present study, we found a positive relationship between animal protein intake and anthropometric indices (MUAC, BAZ, and HAZ). Studies have demonstrated the positive effect of high-quality protein on children's height26,27. In model 2, we did not find a significant association between animal protein intake and WAZ, but in model 3, which further adjusted for energy intake, a significant association was observed. In a cross-sectional study, Dor et al. found that high daily protein intake, mainly from non-dairy animal sources, was positively associated with overweight/obesity in adolescents28. Conversely, a study on adults indicated that animal protein intake was associated with lower odds of overweight/obesity29.
The positive association between animal protein and WAZ may be attributed to the idea that protein, particularly from animal sources, could contribute to the accumulation of body fat by increasing levels of insulin-like growth factor-1 (GLP-1)28.
The findings of our study suggest that plant protein intake may have a positive association with MUAC, BAZ, and HAZ in children after adjusting for potential confounding factors such as age, supplement use, parents’ smoking, physical activity, and socioeconomic status. Importantly, the significant association with HAZ remained even after further adjusting for energy intake, indicating that plant protein intake may have a direct effect on linear growth independent of total calorie consumption. These results highlight the importance of considering both the quantity and quality of protein sources in children’s diets, and suggest that increasing plant protein intake may be beneficial for promoting healthy growth and development.
The results of our study suggest that there is a positive association between amount of fat intake and anthropometric indices, including MUAC, BAZ, and HAZ, when adjusting for age, supplement use, parents’ smoking, physical activity, and socioeconomic status. This finding is consistent with previous research that has also reported a positive association between fat intake and overweight30. However, when we further adjusted for energy intake in model 3, the association between fat intake and anthropometric indices became non-significant. This suggests that the observed positive association in model 2 may be largely by the energy content of the diet. A cross-sectional study from Ghana reported an inverse association between the percentage of energy obtained from total fat and overweight/obesity31.
Nevertheless, calories from fat alone may have little effect on growth. It seems that the type of fatty acid is more important32. The present study found a positive relationship between HAZ and intake of vegetable oils. Vegetable oils are rich in essential fatty acids, such as omega-3 and omega-6, which play a crucial role in growth and development. A cross-sectional study found a significant positive association between omega-6 PUFA and height Z-score in children33. Furthermore, vegetable oils contain fat-soluble vitamins, including vitamin E and vitamin D, which are essential for bone health and may contribute to the growth of children34–38.
According to our findings, a higher intake of omega-3 was associated with higher MUAC and BAZ. Consistent with our study, several studies have shown a positive relationship between omega-3 intake and weight. A systematic review and meta-analysis did not show a statistically significant effect of omega-3 on lean body mass and BMI but did show a significant effect on body weight39. Additionally, the Nurses’ Health Study found that women who consumed more fish or servings of fish per week were at a greater risk of being overweight40.
On the other hand, some studies have reported conflicting results. In a study on 134 normal-weight and overweight children, obese children had a negative association between their BMI Z-score and plasma n-3 PUFA and DHA, despite having higher intakes of PUFA41. Another study examining the dietary intake of 132 4-year-old children reported that low omega-3 PUFA intake was associated with higher body weight42. Some studies found no correlation between omega-3 intake and weight changes43,44.
The findings of our study indicate that there is a significant negative association between the ratio of (MUFAs + PUFAs)/(SFAs + TFAs) and the risk of underweight, even after adjusting for various confounding variables. There is no study that has reported the association between (MUFAs + PUFAs)/(SFAs + TFAs) and risk of underweight. Most of the research on this topic focuses on the relationship between this ratio and overweight and obesity. It is possible that a higher intake of unsaturated fats may provide essential nutrients and promote healthy weight gain. Future research should explore the potential biological mechanisms and determine if this association persists over time.
In addition to protein and fat, carbohydrates as another macronutrient have an important effect on anthropometric indices. In continuation of our research on the dietary factors influencing anthropometric indices among primary school girls in Kerman city, we conducted a study on the association of quality and quantity of carbohydrate intake with selected anthropometric indices. In this study, we found positive associations between carbohydrate quantity, glycemic load, and fiber intake with MUAC, BAZ, and HAZ, as well as an inverse association between BAZ and the ratio of solid carbohydrates to total carbohydrates45.
Strengths and limitations
The present study has important strengths. One of its strengths was that our study was the first to examine the connection between the type and quantity of protein and fat and the status of weight and height in primary school girls in Kerman. As a result, programs focused on preventing and reducing weight and height issues in this age group can benefit from our study's results on the quality and quantity of protein and fat consumed by primary school girls. The validity and reliability of the 185-item food frequency questionnaire were assessed in this study, which was mainly created for the city of Kerman and included most of the local food consumed by our study population. The impact of several potential confounders, such as age, parents' education, parents' occupation, supplement use, parents' smoking, physical activity, socioeconomic status, and energy intake has been considered in this study. Furthermore, for eight weeks, parents of children received instruction on healthy eating, and the efficacy of this instruction was examined through a study effort. Therefore, by teaching and informing parents, our work was valuable and applicable to society.
However, this research has several limitations. A definitive cause-and-effect association between protein and fat quality and quantity and weight and height status cannot be established due to the study's cross-sectional approach. Another drawback of our study was the use of the FFQ to measure protein and fat consumption, which may underestimate or overestimate absolute quantities of intake. Lastly, we used the IPAQ-short form questionnaire, which is commonly used in adults and adolescents older than 16 years old, to assess physical activity in primary school girls. Thus, it is recommended to use a questionnaire particularly developed for children in future studies. Furthermore, it is recommended that future research explore the association between the quality and quantity of protein and fat intake and the status of height and weight in primary school pupils prospectively. Due to different food habits, further studies should also be conducted in other age and population groups.
Conclusion
In conclusion, the present study suggests significant associations between protein and fat intake and various anthropometric indices among primary school girls. Plant proteins and vegetable oils intake was positively associated with height, while animal protein intake was linked to weight. Additionally, omega-3 PUFA were positively associated with MUAC and BAZ. Further research is required to confirm these associations.
Supplementary Information
Author contributions
NJ, LA, and MRM designed the study; NJ collected the data; NJ analyzed the data; NJ and LA interpreted the findings; NJ drafted the manuscript; and LA and MRM revised the final manuscript. All authors read and approved the final manuscript.
Funding
This work was supported by the Tehran Faculty of Medical Sciences, Tehran, Iran.
Data availability
The data sets used and analyzed during the current study are available from the corresponding author upon reasonable request.
Competing interests
The authors declare no competing interests.
Footnotes
Publisher's note
Springer Nature remains neutral with regard to jurisdictional claims in published maps and institutional affiliations.
Contributor Information
Mohammad Reza Mahmoodi, Email: mahmoodimr@yahoo.com.
Leila Azadbakht, Email: azadbakhtleila@gmail.com.
Supplementary Information
The online version contains supplementary material available at 10.1038/s41598-024-66001-4.
References
- 1.de Onis M. Child growth and development. In: de Pee S, Taren D, Bloem M, editors. Nutrition and Health in a Developing World. Nutrition and Health. Humana Press; 2017. [Google Scholar]
- 2.Karim A, Qaisar R. Anthropometric measurements of school-going-girls of the Punjab, Pakistan. BMC Pediatr. 2020;20:1–13. doi: 10.1186/s12887-020-02135-4. [DOI] [PMC free article] [PubMed] [Google Scholar]
- 3.Xu S, Xue Y. Pediatric obesity: Causes, symptoms, prevention and treatment. Exp. Ther. Med. 2016;11(1):15–20. doi: 10.3892/etm.2015.2853. [DOI] [PMC free article] [PubMed] [Google Scholar]
- 4.Eslami O, Khoshgoo M, Shidfar F. Dietary phytochemical index and overweight/obesity in children: A cross-sectional study. BMC Res. Notes. 2020;13(1):132. doi: 10.1186/s13104-020-04979-6. [DOI] [PMC free article] [PubMed] [Google Scholar]
- 5.Esfarjani F, Roustaee R, Mohammadi F, Esmaillzadeh A. Determinants of stunting in school-aged children of Tehran, Iran. Int. J. Prev. Med. 2013;4(2):173. [PMC free article] [PubMed] [Google Scholar]
- 6.Black RE, Victora CG, Walker SP, Bhutta ZA, Christian P, De Onis M, et al. Maternal and child undernutrition and overweight in low-income and middle-income countries. Lancet. 2013;382(9890):427–451. doi: 10.1016/S0140-6736(13)60937-X. [DOI] [PubMed] [Google Scholar]
- 7.Gholami M, Dehghan A, Kargar N, Mohammadi P, Moosazadeh M. Prevalence of malnutrition in children 7–12 years old in Kerman, 2013. J. Community Health Res. 2014;2(4):261–266. [Google Scholar]
- 8.Benetou V, Kanellopoulou A, Kanavou E, Fotiou A, Stavrou M, Richardson C, et al. Diet-related behaviors and diet quality among school-aged adolescents living in Greece. Nutrients. 2020;12(12):3804. doi: 10.3390/nu12123804. [DOI] [PMC free article] [PubMed] [Google Scholar]
- 9.Naeeni MM, Jafari S, Fouladgar M, Heidari K, Farajzadegan Z, Fakhri M, et al. Nutritional knowledge, practice, and dietary habits among school children and adolescents. Int. J. Prev. Med. 2014;5(Suppl 2):S171. doi: 10.4103/2008-7802.157687. [DOI] [PMC free article] [PubMed] [Google Scholar]
- 10.Zarnowiecki D, Mauch CE, Middleton G, Matwiejczyk L, Watson WL, Dibbs J, et al. A systematic evaluation of digital nutrition promotion websites and apps for supporting parents to influence children’s nutrition. Int. J. Behav. Nutr. Phys. Act. 2020;17:1–19. doi: 10.1186/s12966-020-0915-1. [DOI] [PMC free article] [PubMed] [Google Scholar]
- 11.Mahan LK, Escott-Stump S. Krause’s Food, Nutrition, and Diet Therapy. Saunders; 2004. [Google Scholar]
- 12.Moussavi Javardi MS, Madani Z, Movahedi A, Karandish M, Abbasi B. The correlation between dietary fat quality indices and lipid profile with Atherogenic index of plasma in obese and non-obese volunteers: A cross-sectional descriptive-analytic case-control study. Lipids Health Dis. 2020;19:1–9. doi: 10.1186/s12944-020-01387-4. [DOI] [PMC free article] [PubMed] [Google Scholar]
- 13.Ahmadi A, Moazen M, Mosallaei Z, Mohammadbeigi A, Amin-lari F. Nutrient intake and growth indices for children at kindergartens in Shiraz, Iran. J. Pak. Med. Assoc. 2014;1:3. [PubMed] [Google Scholar]
- 14.Pourhashemi JS, Motlagh GM, Khaniki JRG, Golestan B. Nutritional assessment of macronutrients in primary school children and its association with anthropometric indices and oral health. Pak. J. Nutr. 2007;6(6):687–692. doi: 10.3923/pjn.2007.687.692. [DOI] [Google Scholar]
- 15.Ahmadi E, Tehrani AR, Ahmadi A. Prevalence of obesity, overweight and underweight among elementary school children in southern Iran, 2009. Am. J. Appl. Sci. 2010;7(11):1439–1442. doi: 10.3844/ajassp.2010.1439.1442. [DOI] [Google Scholar]
- 16.Craig CL, Marshall AL, Sjöström M, Bauman AE, Booth ML, Ainsworth BE, et al. International physical activity questionnaire: 12-Country reliability and validity. Med. Sci. Sports Exerc. 2003;35(8):1381–1395. doi: 10.1249/01.MSS.0000078924.61453.FB. [DOI] [PubMed] [Google Scholar]
- 17.Garmaroudi GR, Moradi A. Socio-economic status in Iran: A study of measurement index. Payesh Health Monit. 2010;9(2):137–144. [Google Scholar]
- 18.de Onis M, Onyango AW, Borghi E, Siyam A, Nishida C, Siekmann J. Development of a WHO growth reference for school-aged children and adolescents. Bull. World Health Organ. 2007;85(9):660–667. doi: 10.2471/BLT.07.043497. [DOI] [PMC free article] [PubMed] [Google Scholar]
- 19.Saint-Maurice PF, Welk GJ, Beyler NK, Bartee RT, Heelan KA. Calibration of self-report tools for physical activity research: The Physical Activity Questionnaire (PAQ) BMC Public Health. 2014;14:461. doi: 10.1186/1471-2458-14-461. [DOI] [PMC free article] [PubMed] [Google Scholar]
- 20.World Health Organization . Global Recommendations on Physical Activity for Health. WHO Guidelines Approved by the Guidelines Review Committee. World Health Organization; 2010. [Google Scholar]
- 21.Julibert A, Bibiloni MDM, Bouzas C, Martínez-González MÁ, Salas-Salvadó J, Corella D, et al. Total and subtypes of dietary fat intake and its association with components of the metabolic syndrome in a Mediterranean population at high cardiovascular risk. Nutrients. 2019;11(7):1493. doi: 10.3390/nu11071493. [DOI] [PMC free article] [PubMed] [Google Scholar]
- 22.Raymond JL, Morrow K. Krause and Mahan’s Food and the Nutrition Care Process, 16e, E-Book. Elsevier Health Sciences; 2022. [Google Scholar]
- 23.Koletzko B, Demmelmair H, Grote V, Prell C, Weber M. High Protein Intake in Young Children and Increased Weight Gain and Obesity Risk. Oxford University Press; 2016. pp. 303–304. [DOI] [PubMed] [Google Scholar]
- 24.Markides BR, Crixell SH, de Gruy Page J. High protein intake among preschoolers in childcare in a region at elevated risk for obesity. Matern. Child Health J. 2020;24:1008–1018. doi: 10.1007/s10995-020-02935-1. [DOI] [PubMed] [Google Scholar]
- 25.Duckworth LC, Gately PJ, Radley D, Cooke CB, King RFGJ, Hill AJ. RCT of a high-protein diet on hunger motivation and weight-loss in obese children: An extension and replication. Obesity. 2009;17(9):1808–1810. doi: 10.1038/oby.2009.95. [DOI] [PubMed] [Google Scholar]
- 26.Kaimila Y, Divala O, Agapova SE, Stephenson KB, Thakwalakwa C, Trehan I, et al. Consumption of animal-source protein is associated with improved height-for-age z scores in rural Malawian children aged 12–36 months. Nutrients. 2019;11(2):480. doi: 10.3390/nu11020480. [DOI] [PMC free article] [PubMed] [Google Scholar]
- 27.Thomas T, Singh M, Swaminathan S, Kurpad AV. Age-related differences in height gain with dairy protein and micronutrient supplements in Indian primary school children. Asia Pac. J. Clin. Nutr. 2020;29(2):355–362. doi: 10.6133/apjcn.202007_29(2).0018. [DOI] [PubMed] [Google Scholar]
- 28.Dor C, Stark AH, Dichtiar R, Keinan-Boker L, Sinai T. Non-dairy animal protein consumption is positively associated with overweight and obesity in Israeli adolescents. Foods. 2022;11(14):2072. doi: 10.3390/foods11142072. [DOI] [PMC free article] [PubMed] [Google Scholar]
- 29.Hemler EC, Bromage S, Tadesse AW, Zack R, Berhane Y, Canavan CR, et al. Associations of percentage energy intake from total, animal and plant protein with overweight/obesity and underweight among adults in Addis Ababa, Ethiopia. Public Health Nutr. 2022;25(11):3107–3120. doi: 10.1017/S1368980022001100. [DOI] [PMC free article] [PubMed] [Google Scholar]
- 30.Sherwood NE, Jeffery RW, French SA, Hannan PJ, Murray DM. Predictors of weight gain in the Pound of Prevention study. Int. J. Obes. 2000;24(4):395–403. doi: 10.1038/sj.ijo.0801169. [DOI] [PubMed] [Google Scholar]
- 31.Appiah CA, Steiner-Asiedu M, Otoo GE. Predictors of overweight/obesity in urban Ghanaian women. Int. J. Clin. Nutr. 2014;2(3):60–68. [Google Scholar]
- 32.Field AE, Willett WC, Lissner L, Colditz GA. Dietary fat and weight gain among women in the Nurses’ Health Study. Obesity. 2007;15(4):967–976. doi: 10.1038/oby.2007.616. [DOI] [PubMed] [Google Scholar]
- 33.Adjepong M, Pickens CA, Jain R, Harris WS, Annan RA, Fenton JI. Association of whole blood n-6 fatty acids with stunting in 2-to-6-year-old Northern Ghanaian children: A cross-sectional study. PLoS One. 2018;13(3):e0193301. doi: 10.1371/journal.pone.0193301. [DOI] [PMC free article] [PubMed] [Google Scholar]
- 34.Traber MG. Vitamin E inadequacy in humans: Causes and consequences. Adv. Nutr. 2014;5:503–514. doi: 10.3945/an.114.006254. [DOI] [PMC free article] [PubMed] [Google Scholar]
- 35.Rosado JL. Separate and joint effects of micronutrient deficiencies on linear growth. J. Nutr. 1999;129:531S–533S. doi: 10.1093/jn/129.2.531S. [DOI] [PubMed] [Google Scholar]
- 36.Kim K, Melough MM, Kim D, Sakaki JR, Lee J, Choi K, Chun OK. Nutritional adequacy and diet quality are associated with standardized height-for-age among U.S. children. Nutrients. 2021;13(5):1689. doi: 10.3390/nu13051689. [DOI] [PMC free article] [PubMed] [Google Scholar]
- 37.Gutin B, Stallmann-Jorgensen IS, Le AH, Johnson MH, Dong Y. Relations of diet and physical activity to bone mass and height in black and white adolescents. Pediatr. Rep. 2011;3:e10. doi: 10.4081/pr.2011.e10. [DOI] [PMC free article] [PubMed] [Google Scholar]
- 38.van Stuijvenberg ME, Nel J, Schoeman SE, Lombard CJ, du Plessis LM, Dhansay MA. Low intake of calcium and vitamin D, but not zinc, iron or vitamin A, is associated with stunting in 2- to 5-year-old children. Nutrition. 2015;31:841–846. doi: 10.1016/j.nut.2014.12.011. [DOI] [PubMed] [Google Scholar]
- 39.Delpino FM, Figueiredo LM. Effects of omega-3 supplementation on lean body mass in cancer patients: A systematic review and meta-analysis. Eur. J. Clin. Nutr. 2022;76:1636–1645. doi: 10.1038/s41430-022-01100-x. [DOI] [PubMed] [Google Scholar]
- 40.Iso H, Rexrode KM, Stampfer MJ, Manson JE, Colditz GA, Speizer FE, et al. Intake of fish and omega-3 fatty acids and risk of stroke in women. JAMA. 2001;285(3):304–312. doi: 10.1001/jama.285.3.304. [DOI] [PubMed] [Google Scholar]
- 41.Scaglioni S, Verduci E, Salvioni M, Bruzzese MG, Radaelli G, Zetterström R, et al. Plasma long-chain fatty acids and the degree of obesity in Italian children. Acta Paediatr. 2006;95(8):964–969. doi: 10.1080/08035250600764834. [DOI] [PubMed] [Google Scholar]
- 42.Garemo M, Lenner RA, Strandvik B. Swedish pre-school children eat too much junk food and sucrose. Acta Paediatr. 2007;96(2):266–272. doi: 10.1111/j.1651-2227.2007.00093.x. [DOI] [PubMed] [Google Scholar]
- 43.Rafraf M, Mohammadi E, Asghari-Jafarabadi M, Farzadi L. Omega-3 fatty acids improve glucose metabolism without effects on obesity values and serum visfatin levels in women with polycystic ovary syndrome. J. Am. Coll. Nutr. 2012;31(5):361–368. doi: 10.1080/07315724.2012.10720443. [DOI] [PubMed] [Google Scholar]
- 44.Svensson V, Johansson E, Fischer M, Deng SL, Hagströmer M, Danielsson P. Omega-3 fatty acids does not affect physical activity and body weight in primary school children—A double-blind randomized placebo-controlled trial. Sci. Rep. 2018;8(1):12725. doi: 10.1038/s41598-018-31229-4. [DOI] [PMC free article] [PubMed] [Google Scholar]
- 45.Jannati N, Mohammadi-Faez R, Mahmoodi MR, Azadbakht L. Association between quality and quantity of carbohydrate intake with selected anthropometric indices among primary school girls in Kerman city, Iran: A cross-sectional study. BMC Pediatr. 2024;24(1):267. doi: 10.1186/s12887-024-04739-6. [DOI] [PMC free article] [PubMed] [Google Scholar]
Associated Data
This section collects any data citations, data availability statements, or supplementary materials included in this article.
Supplementary Materials
Data Availability Statement
The data sets used and analyzed during the current study are available from the corresponding author upon reasonable request.