

Abstract
Tumour morphology (tumour burden score (TBS)) and liver function (albumin‐to‐alkaline phosphatase ratio (AAPR)) have been shown to correlate with outcomes in intrahepatic cholangiocarcinoma (ICC). This study aimed to evaluate the combined predictive effect of TBS and AAPR on survival outcomes in ICC patients. We conducted a retrospective analysis using a multicentre database of ICC patients who underwent curative surgery from 2011 to 2018. The Kaplan–Meier method was employed to examine the relationship between a new index (combining TBS and AAPR) and long‐term outcomes. The predictive efficacy of this index was compared to other conventional indicators. A total of 560 patients were included in the study. Based on TBS and AAPR stratification, patients were classified into three groups. Kaplan–Meier curves demonstrated that 124 patients with low TBS and high AAPR had the best overall survival (OS) and recurrence‐free survival (RFS), while 170 patients with high TBS and low AAPR had the worst outcomes (log‐rank p < 0.001). Multivariate analyses identified the combined index as an independent predictor of OS and RFS. Furthermore, the index showed superior accuracy in predicting OS and RFS compared to other conventional indicators. Collectively, this study demonstrated that the combination of liver function and tumour morphology provides a synergistic effect in evaluating the prognosis of ICC patients. The novel index combining TBS and AAPR effectively stratified postoperative survival outcomes in ICC patients undergoing curative resection.
Keywords: albumin‐to‐alkaline phosphatase ratio, curative resection, intrahepatic cholangiocarcinoma, long‐term outcome, tumour burden score
1. INTRODUCTION
Primary liver cancer primarily consists of hepatocellular carcinoma (HCC), intrahepatic cholangiocarcinoma (ICC) and combined hepatocellular‐cholangiocarcinoma (cHCC‐CCA). 1 ICC is the second most common primary hepatic malignancy, accounting for 15%–20% of newly diagnosed liver malignancies. 2 Most patients are diagnosed at advanced stages, losing the opportunity for curative resection. 3 Even for those undergoing surgical treatment, the 5‐year survival rate remains dismal. 4 The poor long‐term survival rate of ICC may be related to the high tendency for regional and distant metastasis and the lack of effective systemic treatment options. Therefore, improving the prognosis prediction for ICC patients may be an effective strategy to address its poor outcomes. 5 While numerous biomarkers have been reported to predict the prognosis of ICC patients, their clinical application remains limited. There is an urgent need for a simple and effective marker to better predict the prognosis of ICC patients, enabling clinicians to implement personalized treatment early to improve patient survival.
The tumour burden score (TBS), a metric based on tumour size and number, was first proposed in 2017 by Sasaki et al. as a survival prediction tool for patients undergoing hepatic resection for colorectal liver metastasis (CRLM). 6 Compared with tumour size and number, TBS showed better efficacy in predicting long‐term survival. Our previous study demonstrated that the prognosis of ICC patients could be stratified by TBS, with elevated TBS associated with decreased overall survival (OS) and recurrence‐free survival (RFS). 7 In addition to tumour burden, liver function indicators such as the Child‐Pugh grade, albumin‐bilirubin (ALBI) grade and albumin‐to‐alkaline phosphatase ratio (AAPR) have been reported to evaluate postoperative complications and prognosis in patients undergoing liver resection. 8 , 9 In our previous work, we compared the accuracy of these three indices in predicting long‐term survival of ICC patients undergoing hepatectomy and found that both the ALBI grade and AAPR were useful surrogate markers for identifying patients at risk of poor postoperative outcomes. Furthermore, AAPR exhibited better effectiveness.
Given that both liver function and tumour burden show promising performance in predicting outcomes of ICC patients, we hypothesized that a combined index would demonstrate even better predictive ability. Thus, in this study, we propose a novel index combining TBS and AAPR to evaluate its effect on OS and RFS in ICC patients. Additionally, we compare its predictive efficacy with other conventional indicators.
2. METHODS
2.1. Study population and data
This retrospective analysis was conducted in accordance with the Declaration of Helsinki 10 and utilized data from Chongqing University Cancer Hospital (Chongqing, China), West China Hospital (Sichuan, China) and The Second Affiliated Hospital of Guangzhou University of Chinese Medicine (Guangdong, China). The study was approved by the Ethics Committees of these institutions. All the pathologically diagnosed ICC patients who underwent curative surgery at these institutions from 2011 to 2018 were initially evaluated. Clinicopathological characteristics and postoperative outcomes were reviewed to select candidates. Exclusion criteria included patients with extrahepatic metastasis or other malignancies, patients with a positive surgical margin, local organ invasion. In addition, 11 patients loss of follow‐up and 23 patients with incomplete data on variables of interest (such as CA19‐9 levels, number of lesions, albumin value and alkaline phosphatase value) were also excluded. All patients or their relatives provided informed consent.
2.2. Variables and outcomes of interest
The demographic and clinicopathological parameters included gender, age, hepatitis B virus positivity (HBsAg), presence of intrahepatic bile duct stones, presence of liver cirrhosis, morphologic type (MF, mass forming; IG, intraductal growth; PI, periductal infiltrating), CA19‐9 (U/mL), maximum lesion size (cm), number of lesions, albumin (g/dL), alkaline phosphatase, differentiation, liver capsule invasion status, perineural invasion status, major vascular invasion status, microvascular invasion status and TNM stages according to the American Joint Committee on Cancer (AJCC) 8th edition staging. Microvascular invasion was defined as involvement of hepatic parenchymal vessels found on histological examination. Major vascular invasion was defined as invasion of the main or first and second‐order branches of the portal vein or hepatic artery. 11
As previously reported, TBS was defined as the distance from the origin of the Cartesian plane, composed of the maximum tumour size (x‐axis) and the number of tumours (y‐axis). Thus, TBS2 = (maximum tumour diameter)2 + (number of tumours)2. The cut‐off value of TBS was consistent with our previous study, 7 a value of 4.71 was used to divided patients into high‐ or low‐TBS groups. AAPR was calculated as the ratio of albumin to alkaline phosphatase; a value of 0.348, as previously reported, was used to stratify patients. 12 By combining the optimal cut‐off values of AAPR and TBS, patients were divided into three subgroups for comparative analysis: low TBS combined with high AAPR, high TBS combined with low AAPR and low TBS combined with low AAPR or high TBS combined with high AAPR.
Patients were followed up according to the National Comprehensive Cancer Network guidelines, with monthly routine tumour marker and imaging examinations (such as ultrasound, computed tomography and/or magnetic resonance imaging) in the first 6 months to monitor recurrence, followed by examinations every 3 months, and then every 6 months thereafter. Those who did not return to the hospital for re‐examination were followed up by telephone survey. OS was calculated from liver resection to death or last follow‐up. RFS was defined as the time from the first surgery to the earliest evidence of recurrence or last follow‐up.
2.3. Statistical analysis
Continuous variables were reported as median and interquartile range (IQR), while categorical variables were reported as counts and percentages (%). Chi‐squared tests were used to compare categorical variables, while Kruskal–Wallis one‐way analysis of variance was used to compare continuous variables. Kaplan–Meier curves were used to describe patient survival, with differences tested using the log‐rank test. Univariate and multivariate Cox regression models were used to identify independent prognostic risk factors. In the univariate analysis, clinical and pathological parameters with p < 0.05 were selected for multivariate analysis. All data were analysed using SPSS (version 23.0, IBM Corp., Armonk, NY, USA) and MedCalc (version 20.0.3.0, Ostend, Belgium). A p‐value less than 0.05 was considered statistically significant.
3. RESULTS
3.1. Patient characteristics
A total of 560 ICC patients who underwent curative resection were included in this study (Table 1). Among them, 286 were male (51.1%) and 274 were female (48.9%). The median age was 59.0 years (IQR: 50.0–65.0). The majority were HBsAg‐negative (397 cases, 70.9%). Intrahepatic bile duct stones were absent in 464 patients (82.9%), while 96 patients had stones. Liver cirrhosis was present in 137 cases (24.5%) and absent in 423 cases (75.5%). The morphological type was determined for most patients, with 445 (79.4%) having mass‐forming (MF) or intraductal growth (IG) types, 100 patients having periductal infiltrating (PI) or MF + PI types, and only 10 patients with unknown morphology. Low‐grade differentiation was observed in 15 cases (2.7%), with the remaining 545 cases (97.3%) being of moderate to poor differentiation.
TABLE 1.
Characteristics of included patients with intrahepatic cholangiocarcinoma.
| Variable | Total (n = 560) |
|---|---|
| Gender, n (%) | |
| Male | 286 (51.1) |
| Female | 274 (48.9) |
| Age, year, median (IQR) | 59 (50–65) |
| HBsAg, n (%) | |
| Positive | 163 (29.1) |
| Negative | 397 (70.9) |
| Hepatolithiasis, n (%) | |
| Present | 96 (17.1) |
| Absent | 464 (82.9) |
| Cirrhosis, n (%) | |
| Present | 137 (24.5) |
| Absent | 423 (75.5) |
| Morphologic type | |
| MF, IG | 445 (79.4) |
| PI, MF + PI | 100 (17.9) |
| Unknown | 15 (2.7) |
| CA19‐9, U/mL, median (IQR) | 71.9 (19.1–813.7) |
| Size of largest lesion, cm, median (IQR) | 5.7 (4.2–7.9) |
| Number of lesions, median (IQR) | 1 (1–2) |
| TBS, median (IQR) | 5.88 (4.41–7.96) |
| Albumin, g/dL, median (IQR) | 42.8 (39.4–45.0) |
| ALP, U/L, median (IQR) | 108 (85–157) |
| AAPR, median (IQR) | 0.387 (0.273–0.514) |
| Differentiation, n (%) | |
| Well | 15 (2.7) |
| Moderate to poor | 545 (97.3) |
| Liver capsule invasion, n (%) | |
| Present | 367 (65.5) |
| Absent | 193 (34.5) |
| Perineural invasion, n (%) | |
| Present | 86 (15.4) |
| Absent | 474 (84.6) |
| Major vascular invasion, n (%) | |
| Present | 146 (26.1) |
| Absent | 414 (73.9) |
| Microvascular invasion, n (%) | |
| Present | 65 (11.6) |
| Absent | 495 (88.4) |
| Lymph node invasion, n (%) | |
| Present | 131 (23.4) |
| Absent | 429 (76.6) |
| AJCC 8th edition stage, n (%) | |
| I | 96 (17.1) |
| II | 56 (10.0) |
| III | 408 (72.9) |
Abbreviations: AAPR, albumin‐to‐alkaline phosphatase ratio; AJCC, American Joint Committee on Cancer; ALP, alkaline phosphatase; CA19‐9, carbohydrate antigen 19‐9; IG, intraductal growth; IQR, interquartile range; MF, mass‐forming; PI, periductal infiltrating; TBS, tumour burden score.
Preoperative levels of CA19‐9, albumin and alkaline phosphatase were 71.9 U/mL (IQR: 19.1–813.7), 42.8 g/dL (IQR: 39.4–45.0) and 108 U/L (IQR: 85–157), respectively. The maximum lesion size was 5.7 cm (IQR: 4.2–7.9), and the median lesion number was 1 (IQR: 1–2). The TBS and AAPR had median values of 5.88 (IQR: 4.41–7.96) and 0.387 (IQR: 0.273–0.514), respectively. According to the AJCC 8th edition staging, 96 patients (17.1%) were classified as stage I, 56 (10.0%) as Stage II, and 408 (72.9%) as Stage III. Tumour invasion indicators included liver capsule invasion (367 cases, 65.5%), perineural invasion (86 cases, 15.4%), major vascular invasion (146 cases, 26.1%), microvascular invasion (65 cases, 11.6%) and lymph node invasion (131 cases, 23.4%).
3.2. Association between the index and clinicopathological feature
As summarized in Table 2, 124 patients (22.1%) were in the low TBS and high AAPR group, 266 patients (47.5%) were in the low TBS and low AAPR/high TBS and high AAPR group, and 170 patients (30.4%) were in the high TBS and low AAPR group. The highest CA19‐9 levels were observed in the high TBS and low AAPR group (177.2, IQR: 24.9–1000.0), while the levels in the other groups were 34.2 (low TBS and high AAPR, IQR: 13.4–755.4) and 80.6 (low TBS and low AAPR/high TBS and high AAPR, IQR: 21.5–805.3), respectively, though this was not statistically significant. The high TBS and low AAPR group had the largest median maximum lesion size (7.9, IQR: 6.0–9.6). The low TBS and low AAPR / high TBS and high AAPR group had the highest proportion of single lesions (187, 70.3%), while the high TBS and low AAPR group had the highest proportion of multiple lesions (60%, 35.3%).
TABLE 2.
Characteristics stratified by TBS and AAPR grade.
| Variable | Low TBS and high AAPR | Low TBS and low AAPR/high TBS and high AAPR | High TBS and low AAPR | p‐value |
|---|---|---|---|---|
| Cases, n (%) | 124 (22.1) | 266 (47.5) | 170 (30.4) | |
| Gender, n (%) | 0.885 | |||
| Male | 65 (52.4) | 133 (50.0) | 88 (51.8) | |
| Female | 59 (47.6) | 133 (50.0) | 82 (48.2) | |
| Age, year, median (IQR) | 60 (52–68) | 58 (49–71) | 59 (51–68) | 0.082 |
| HBsAg, n (%) | 0.085 | |||
| Positive | 40 (32.3) | 85 (32.0) | 38 (22.4) | |
| Negative | 84 (67.7) | 181 (68.0) | 132 (77.6) | |
| Hepatolithiasis, n (%) | 0.189 | |||
| Present | 28 (22.6) | 41 (15.4) | 27 (15.9) | |
| Absent | 96 (77.4) | 225 (84.6) | 143 (84.1) | |
| Cirrhosis, n (%) | 0.085 | |||
| Present | 38 (30.6) | 66 (24.8) | 33 (19.4) | |
| Absent | 86 (69.4) | 200 (75.2) | 137 (80.6) | |
| Morphologic type | 0.921 | |||
| MF, IG | 98 (79.0) | 213 (80.1) | 134 (78.9) | |
| PI, MF + PI | 25 (20.2) | 44 (16.5) | 31 (18.2) | |
| Unknown | 1 (0.8) | 9 (3.4) | 5 (2.9) | |
| CA19‐9, U/mL, median (IQR) | 34.2 (13.4–755.4) | 80.6 (21.5–805.3) | 177.2 (24.9–1000.0) | 0.139 |
| Size of largest lesion, cm, median (IQR) | 3.5 (2.6–4.2) | 6.0 (5.0–7.3) | 7.9 (6.0–9.6) | <0.001 |
| Tumour number, n (%) | <0.001 | |||
| Solitary | 108 (87.1) | 187 (70.3) | 110 (64.7) | |
| Multiple | 16 (12.9) | 79 (29.7) | 60 (35.3) | |
| Number of lesions, median (IQR) | 1 (1–2) | |||
| TBS, median (IQR) | 3.64 (2.79–4.14) | 6.08 (5.09–7.47) | 7.96 (6.08–9.82) | <0.001 |
| Albumin, g/dL, median (IQR) | 43.2 (41.0–45.6) | 43.7 (40.7–45.9) | 41.1 (37.9–43.9) | 0.155 |
| ALP, U/L, median (IQR) | 85 (71–97) | 99 (82–122) | 166 (136–222) | <0.001 |
| AAPR, median (IQR) | 0.523 (0.435–0.626) | 0.436 (0.359–0.538) | 0.252 (0.182–0.304) | <0.001 |
| Differentiation, n (%) | 0.869 | |||
| Well | 2 (1.6) | 8 (3.0) | 5 (2.9) | |
| Moderate to poor | 122 (98.4) | 258 (97.0) | 165 (97.1) | |
| Liver capsule invasion, n (%) | <0.001 | |||
| Present | 63 (50.8) | 194 (72.9) | 110 (64.7) | |
| Absent | 61 (49.2) | 72 (27.1) | 60 (35.3) | |
| Perineural invasion, n (%) | 0.999 | |||
| Present | 19 (15.3) | 41 (15.4) | 26 (15.3) | |
| Absent | 105 (84.7) | 225 (84.6) | 144 (84.7) | |
| Major vascular invasion, n (%) | <0.001 | |||
| Present | 15 (12.1) | 71 (26.7) | 60 (35.3) | |
| Absent | 109 (87.9) | 195 (73.3) | 110 (64.7) | |
| Microvascular invasion, n (%) | 0.177 | |||
| Present | 11 (8.9) | 28 (10.5) | 26 (15.3) | |
| Absent | 113 (91.1) | 238 (89.5) | 144 (84) | |
| Lymph node invasion, n (%) | <0.001 | |||
| Present | 15 (12.1) | 60 (22.6) | 56 (32.9) | |
| Absent | 109 (87.9) | 206 (77.4) | 114 (67.1) | |
| AJCC 8th edition stage, n (%) | <0.001 | |||
| I | 47 (37.9) | 31 (11.7) | 18 (10.6) | |
| II | 8 (6.5) | 25 (9.4) | 23 (13.5) | |
| III | 69 (55.6) | 210 (78.9) | 129 (75.9) |
Abbreviations: AAPR, albumin‐to‐alkaline phosphatase ratio; ALP, alkaline phosphatase; AJCC, American Joint Committee on Cancer; CA19‐9, carbohydrate antigen 19‐9; IG, intraductal growth; IQR, interquartile range; MF, mass forming; PI, periductal infiltrating; TBS, tumour burden score.
In addition, patients in the high TBS and low AAPR group were more frequently associated with liver capsule invasion, major vascular invasion, lymph node invasion, and advanced TNM stages (all p < 0.001).
3.3. Impact of the index on prognosis
Kaplan–Meier curves indicated that the index was a strong predictor of long‐term outcomes in ICC patients. Patients with low TBS and high AAPR had the best OS and RFS, while those with high TBS and low AAPR had the worst OS and RFS (Figure 1).
FIGURE 1.
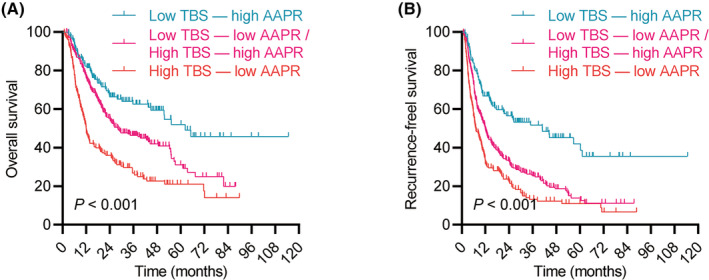
Kaplan–Meier curves demonstrating differences in overall survival (OS) (A) and recurrence‐free survival (RFS) (B) among patients stratified by tumour burden score (TBS) and albumin‐to‐alkaline phosphatase ratio (AAPR). Groups include low TBS/high AAPR, low TBS/low AAPR, high TBS/high AAPR and high TBS/low AAPR.
Cox regression analyses identified several factors affecting postoperative OS and RFS in ICC patients (Table 3). Hepatolithiasis, CA19‐9 level, tumour size, tumour number, tumour differentiation, major vascular invasion, MVI, TNM stage and the combined TBS and AAPR index were potential factors influencing OS. Multivariate analysis confirmed that elevated CA19‐9 level, multiple tumours, presence of MVI, lymph node invasion and the combined TBS and AAPR groups (low TBS and low AAPR/high TBS and high AAPR, high TBS and low AAPR) were independent risk factors for poor OS. For RFS, similar factors were identified, including elevated CA19‐9 level, multiple tumours, presence of MVI, major vascular invasion, lymph node invasion and the combined TBS and AAPR groups.
TABLE 3.
Identification of prognostic factors for overall survival and recurrence‐free survival.
| Variables | Overall survival | Recurrence‐free survival | ||||||
|---|---|---|---|---|---|---|---|---|
| Univariate | Multivariate | Univariate | Multivariate | |||||
| HR (95% CI) | p‐value | HR (95% CI) | p‐value | HR (95% CI) | p‐value | HR (95% CI) | p‐value | |
| Gender (F/M) | 0.871 (0.701–1.084) | 0.216 | 0.957 (0.790–1.159) | 0.655 | ||||
| Age | 0.996 (0.986–1.007) | 0.465 | 0.969 (0.916–1.026) | 0.286 | ||||
| HBsAg | 1.183 (0.934–1.499) | 0.164 | 1.193 (0.968–1.470) | 0.098 | ||||
| Hepatolithiasis | 1.444 (1.103–1.889) | 0.008 | 1.286 (0.969–1.706) | 0.081 | 1.001 (0.774–1.294) | 0.996 | ||
| Cirrhosis | 1.175 (0.915–1.510) | 0.206 | 1.091 (0.872–1.365) | 0.447 | ||||
| Morphologic type (PI, MF + PI/MF, IG) | 1.151 (0.914–1.449) | 0.233 | 1.077 (0.878–1.321) | 0.475 | ||||
| CA19‐9 (≥37/≤37) | 1.926 (1.639–2.264) | <0.001 | 1.618 (1.366–1.916) | <0.001 | 1.536 (1.335–1.767) | <0.001 | 1.423 (1.234–1.641) | <0.001 |
| Tumour size (≥5/<5) | 1.317 (1.053–1.647) | 0.016 | 0.883 (0.665–1.171) | 0.387 | 1.499 (1.229–1.829) | 0.001 | 0.952 (0.741–1.223) | 0.701 |
| Tumour number (multiple/solitary) | 1.678 (1.334–2.113) | <0.001 | 1.465 (1.151–1.866) | 0.002 | 1.711 (1.393–2.103) | <0.001 | 1.508 (1.218–1.868) | <0.001 |
| Differentiation (moderate to poor/well) | 1.862 (1.448–2.394) | <0.001 | 1.238 (0.897–1.710) | 0.195 | 1.703 (1.373–2.113) | <0.001 | 0.981 (0.780–1.233) | 0.868 |
| Liver capsule invasion | 1.096 (0.869–1.382) | 0.439 | 1.229 (0.992–1.512) | 0.051 | ||||
| Perineural invasion | 1.222 (0.958–1.558) | 0.106 | 1.389 (1.073–1.799) | 0.013 | 1.097 (0.828–1.454) | 0.517 | ||
| Major vascular invasion | 1.762 (1.329–2.335) | 0.001 | 0.927 (0.717–1.198) | 0.562 | 1.335 (1.074–1.658) | 0.009 | 1.543 (1.235–1.928) | <0.001 |
| MVI | 1.668 (1.227–2.269) | 0.001 | 1.823 (1.402–2.371) | <0.001 | 1.946 (1.477–2.562) | <0.001 | 1.671 (1.248–2.236) | <0.001 |
| Lymph node invasion | 2.374 (1.875–3.004) | <0.001 | 1.627 (1.249–2.121) | <0.001 | 1.914 (1.544–2.373) | <0.001 | 1.484 (1.167–1.886) | 0.001 |
| AJCC 8th edition stage (III/I–II) | 1.300 (1.114–1.518) | 0.001 | 1.035 (0.871–1.231) | 0.694 | 1.329 (1.160–1.524) | <0.001 | 1.104 (0.951–1.282) | 0.194 |
| Combined TBS and AAPR | ||||||||
| Low TBS and high AAPR | Ref. | Ref. | Ref. | |||||
| Low TBS and low AAPR/high TBS and high AAPR | 1.615 (1.168–2.233) | <0.001 | 1.404 (1.004–1.963) | 0.047 | 1.971 (1.487–2.614) | <0.001 | 1.691 (1.211–2.361) | 0.002 |
| High TBS and low AAPR | 2.917 (2.095–4.062) | <0.001 | 2.151 (1.518–3.051) | <0.001 | 2.806 (2.084–3.779) | <0.001 | 2.180 (1.511–3.145) | <0.001 |
Abbreviations: AAPR, albumin‐to‐alkaline phosphatase ratio; CA19‐9, carbohydrate antigen 19‐9; CI, confidence interval; F, female; HR, hazard ratio; IG, intraductal growth; M, male; MF, mass‐forming; MVI, microvascular invasion; PI, periductal infiltrating; Ref., reference; TBS, tumour burden score.
ROC curves compared the discriminatory power of these independent risk factors in predicting prognosis (Figure 2). The combined TBS and AAPR index demonstrated superior predictive accuracy for OS and RFS compared to other factors, with AUC values of 0.653 for OS and 0.658 for RFS. These results suggest that the combined TBS and AAPR index is a promising predictive indicator compared with conventional markers.
FIGURE 2.
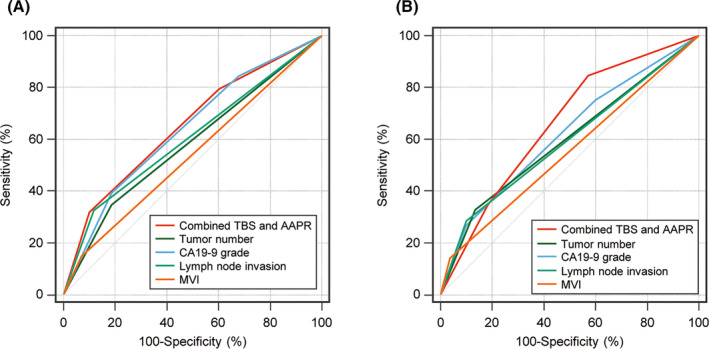
Comparison of AUC values for combined TBS and AAPR, tumour number, CA19‐9, lymph node invasion and microvascular invasion in predicting OS (A) and RFS (B). AUC, area under the receiver operating characteristic curve; AAPR, albumin‐to‐alkaline phosphatase ratio; CA19‐9, carbohydrate antigen 19‐9; MVI, microvascular invasion; TBS, tumour burden score.
4. DISCUSSION
Patients with ICC are usually asymptomatic, leading to a delay in disease diagnosis and worse patient prognosis. 13 The diagnosis of ICC is always adequate by using blood workup, imaging and tissue biopsy. Patients with ICC are often associated with abnormal liver function, such as elevated gamma‐glutamyl transpeptidase and alkaline phosphatase levels. 14 CA19‐9 and carcinoembryonic antigen are the most commonly used tumour markers for ICC. For imaging, computed tomography (CT) and contrast‐enhanced magnetic resonance imaging (MRI) scan have relatively specific performance and show comparable capability in detecting primary and satellite lesions. 15 Apart from bloodwork, and imaging findings, pathologic confirmation is usually necessary before initiating systemic therapy as well as after undergoing curative resection. Liquid biopsy is not the routine test for the diagnosis of ICC, but the detection of circulating tumour deoxyribonucleic acid (ctDNA) and whole‐exome sequencing of peripheral blood are helpful in assessment of therapeutic effect. 16
Over the past few decades, the incidence of ICC has steadily increased, with typically low 5‐year survival rates following surgery. However, significant differences in long‐term prognosis exist. 17 , 18 Therefore, stratifying and analysing patients' prognoses can help make appropriate medical decisions and improve long‐term outcomes. Both TBS and AAPR, common indicators in cancer patients, have predictive effects on the prognosis of ICC patients. 7 , 19 Our study combines TBS and AAPR to predict ICC patients' prognosis, exploring their combined role in predicting long‐term outcomes after curative surgery. This is the first study to investigate the role of TBS combined with AAPR in the postoperative prognosis of ICC patients, holding important clinical implications.
TBS is a comprehensive morphometric measurement based on tumour size and number, showing good predictive effects in HCC, lung cancer and colorectal cancer. 20 , 21 , 22 , 23 For instance, Zorays Moazzam et al. indicated that TBS is independently associated with a higher risk of recurrence, and the tumour burden score calculated using hazard ratios and multivariate analysis more accurately predicts recurrence risk, time and pattern of HCC than traditional clinicopathological factors. Moreover, the risk of recurrence varies according to the TBS of HCC patients; those with low TBS are more prone to intrahepatic recurrence, while those with high TBS are more likely to experience extrahepatic recurrence. 24 Our study also found that increasing TBS levels correlate with worse postoperative long‐term outcomes in ICC patients. Additionally, previous research has shown a strong nonlinear association between TBS after curative resection of ICC and survival rates, suggesting TBS as a prognostic factor. 25 The impact of surgical margin status on overall survival is influenced by tumour status, with increased margin width associated with improved 5‐year OS in patients with low or moderate TBS. 26
AAPR, a blood biomarker, has been widely studied in oncology, especially in prognostic analysis of HCC. 27 Studies have found that preoperative AAPR levels are associated with HCC prognosis after curative resection. 28 AAPR can be used for routine preoperative testing, crucial for early detection of high‐risk patients and personalized adjuvant therapy. Our study found that decreased AAPR levels are associated with worse postoperative prognosis in ICC patients. Furthermore, in liver transplant recipients with hepatocellular carcinoma, decreased AAPR levels are associated with poorer prognosis, highlighting the value of AAPR as a prognostic indicator. 29 A meta‐analysis summarized that low AAPR predicts poorer OS and RFS in HCC patients, consistent with our results. 30 Our previous study demonstrated that AAPR was more accurate in evaluating OS of ICC patients compared to Child–Pugh score and ALBI grade (C index: 0.6000 vs. 0.559 vs. 0.528). 8 Our study shows that combining TBS and AAPR performs better in postoperative prediction for ICC patients (OS accuracy: 0.653, 95% CI: 0.611–0.692; RFS accuracy: 0.658, 95% CI: 0.617–0.698).
The combination of TBS and AAPR as predictive factors to assess postoperative OS and RFS of ICC patients is relatively underexplored but holds significant value. TBS is a scoring system for tumour morphology and combining it with blood biomarkers may yield higher accuracy. 31 Previous studies have combined TBS with CA19‐9 to evaluate long‐term outcomes after curative resection in ICC patients, suggesting that low TBS/low CA19‐9 patients have the best OS and RFS, while high TBS/high CA19‐9 patients have the worst outcomes. 7 Additionally, Zorays Moazzam et al. also conducted related research on TBS combined with CA19‐9. They found that despite differences in prediction between TBS and CA19‐9, using TBS combined with CA19‐9 is still an independent factor for predicting OS in ICC patients. Furthermore, they suggested that the interaction between tumour morphology and biology determines the long‐term prognosis after hepatic resection for intrahepatic cholangiocarcinoma. Prognostic models combining TBS with CA19‐9 can provide information for prognosis discussions and help identify which ICC patients may benefit more from adjuvant chemotherapy rather than upfront surgery. 32 Therefore, our study suggests that combining TBS with AAPR for postoperative outcome estimation has significant clinical implications, showing clear prognostic differences between stratified groups and providing personalized treatment recommendations.
Despite limitations such as a relatively small sample size and the need for further validation, our research holds significant clinical value. Compared to studies solely using TBS, our analysis includes blood biomarker indicators, providing a more comprehensive postoperative evaluation and reference for personalized treatment decisions. As a multicentre study, our research benefits from high data quality and diverse patient samples. This study is the first to evaluate ICC patients' prognosis using TBS combined with AAPR, highlighting its importance for survival analysis and prognosis assessment. Future studies should further compare the predictive effects of TBS combined with AAPR against other factors, such as TBS combined with ALBI or CA19‐9.
5. CONCLUSIONS
The combination of TBS and AAPR demonstrates significant predictive efficacy in assessing ICC prognosis, especially for predicting postoperative recurrence. We suggest that surgeons, oncologists and pathologists consider using TBS combined with AAPR to provide more efficient and rational clinical recommendations for ICC patients undergoing curative surgery.
AUTHOR CONTRIBUTIONS
Sheng Wang: Data curation (equal); formal analysis (equal); methodology (equal); software (equal); writing – original draft (equal). Maoyun Liu: Data curation (equal); writing – original draft (equal). Lei Xiang: Data curation (equal); formal analysis (equal); software (equal); writing – original draft (equal). Haizhou Qiu: Data curation (equal); formal analysis (equal); methodology (equal); writing – original draft (equal). Luo Cheng: Formal analysis (equal); methodology (equal); software (equal). Zuotian Huang: Formal analysis (equal); methodology (equal). Tao Wen: Formal analysis (equal). Wenyuan Xie: Software (equal). Sipeng Li: Methodology (equal). Cheng Zhang: Methodology (equal); software (equal). Genshu Wang: Supervision (equal); writing – original draft (equal). Hui Li: Conceptualization (lead); data curation (equal); formal analysis (equal); funding acquisition (equal); supervision (equal); writing – original draft (equal); writing – review and editing (equal). Dewei Li: Conceptualization (equal); funding acquisition (equal); supervision (equal); writing – original draft (equal); writing – review and editing (equal).
FUNDING INFORMATION
This work was supported by grants from the Natural Science Foundation of China (82203823), the China Postdoctoral Science Foundation (2023 M730436, 2022TQ0393), the Chongqing Postdoctoral Science Foundation (2022CQBSHTB2029), Chongqing medical scientific research project (Joint project of Chongqing Health Commission and Science and Technology Bureau) (2023MSXM104, 2024ZDXM008) and the Natural Science Foundation of Chongqing (CSTB2022NSCQ‐MSX0477, CSTB2022NSCQ‐MSX1174).
CONFLICT OF INTEREST STATEMENT
The authors declare no potential conflicts of interest.
Supporting information
Table S1: Comparison of predictive value in OS and RFS.
Wang S, Liu M, Xiang L, et al. Tumour burden score combined with albumin‐to‐alkaline phosphatase ratio predicts prognosis in patients with intrahepatic cholangiocarcinoma. J Cell Mol Med. 2024;00:e18530. doi: 10.1111/jcmm.18530
Sheng Wang, Maoyun Liu, and Lei Xiang contributed equally to this work.
Contributor Information
Genshu Wang, Email: wgsh168@163.com.
Hui Li, Email: 445613487@qq.com.
Dewei Li, Email: lidewei406@sina.com.
DATA AVAILABILITY STATEMENT
All data included in this study are available upon request by contact with the corresponding author.
REFERENCES
- 1. Hemming AW. Biliary tract and primary liver tumors: who, what, and why? Surg Oncol Clin N Am. 2019;28:519‐538. [DOI] [PubMed] [Google Scholar]
- 2. Altaee MY, Johnson PJ, Farrant JM, Williams R. Etiologic and clinical characteristics of peripheral and hilar cholangiocarcinoma. Cancer. 1991;68:2051‐2055. [DOI] [PubMed] [Google Scholar]
- 3. Bridgewater J, Galle PR, Khan SA, et al. Guidelines for the diagnosis and management of intrahepatic cholangiocarcinoma. J Hepatol. 2014;60:1268‐1289. [DOI] [PubMed] [Google Scholar]
- 4. Peery AF, Crockett SD, Murphy CC, et al. Burden and cost of gastrointestinal, liver, and pancreatic diseases in the United States: update 2021. Gastroenterology. 2022;162:621‐644. [DOI] [PMC free article] [PubMed] [Google Scholar]
- 5. Massarweh NN, El‐Serag HB. Epidemiology of hepatocellular carcinoma and intrahepatic cholangiocarcinoma. Cancer Control. 2017;24:1073274817729245. [DOI] [PMC free article] [PubMed] [Google Scholar]
- 6. Sasaki K, Morioka D, Conci S, et al. The tumor burden score: a new "metro‐ticket" prognostic tool for colorectal liver metastases based on tumor size and number of tumors. Ann Surg. 2018;267:132‐141. [DOI] [PubMed] [Google Scholar]
- 7. Li H, Liu R, Qiu H, et al. Tumor burden score stratifies prognosis of patients with intrahepatic cholangiocarcinoma after hepatic resection: a retrospective, multi‐institutional study. Front Oncol. 2022;12:829407. [DOI] [PMC free article] [PubMed] [Google Scholar]
- 8. Li H, Li J, Wang J, et al. Assessment of liver function for evaluation of long‐term outcomes of intrahepatic cholangiocarcinoma: a multi‐institutional analysis of 620 patients. Front Oncol. 2020;10:525. [DOI] [PMC free article] [PubMed] [Google Scholar]
- 9. Santol J, Kim S, Gregory LA, et al. An APRI + ALBI based multivariable model as preoperative predictor for posthepatectomy liver failure. Ann Surg. 2023;6127. Online ahead of print. [DOI] [PMC free article] [PubMed] [Google Scholar]
- 10. Carlson RV, Boyd KM, Webb DJ. The revision of the declaration of Helsinki: past, present and future. Br J Clin Pharmacol. 2004;57:695‐713. [DOI] [PMC free article] [PubMed] [Google Scholar]
- 11. Amin MB, Greene FL, Edge SB, et al. The 8th edition AJCC cancer staging manual: continuing to build a bridge from a population‐based to a more "personalized" approach to cancer staging. CA Cancer J Clin. 2017;67:93‐99. [DOI] [PubMed] [Google Scholar]
- 12. Tian G, Li G, Guan L, Yang Y, Li N. Pretreatment albumin‐to‐alkaline phosphatase ratio as a prognostic indicator in solid cancers: a meta‐analysis with trial sequential analysis. Int J Surg. 2020;81:66‐73. [DOI] [PubMed] [Google Scholar]
- 13. Moris D, Palta M, Kim C, Allen PJ, Morse MA, Lidsky ME. Advances in the treatment of intrahepatic cholangiocarcinoma: an overview of the current and future therapeutic landscape for clinicians. CA Cancer J Clin. 2023;73:198‐222. [DOI] [PubMed] [Google Scholar]
- 14. Nakeeb A, Pitt HA, Sohn TA, et al. Cholangiocarcinoma. A spectrum of intrahepatic, perihilar, and distal tumors. Ann Surg. 1996;224:463‐475. [DOI] [PMC free article] [PubMed] [Google Scholar]
- 15. Kovač JD, Janković A, Đikić‐Rom A, Grubor N, Antić A, Dugalić V. Imaging spectrum of intrahepatic mass‐forming cholangiocarcinoma and its mimickers: how to differentiate them using MRI. Curr Oncol. 2022;29:698‐723. [DOI] [PMC free article] [PubMed] [Google Scholar]
- 16. Scott AJ, Sharman R, Shroff RT. Precision medicine in biliary tract cancer. J Clin Oncol. 2022;40:2716‐2734. [DOI] [PubMed] [Google Scholar]
- 17. Wu L, Tsilimigras DI, Paredes AZ, et al. Trends in the incidence, treatment and outcomes of patients with intrahepatic cholangiocarcinoma in the USA: facility type is associated with margin status, use of lymphadenectomy and overall survival. World J Surg. 2019;43:1777‐1787. [DOI] [PubMed] [Google Scholar]
- 18. Valle JW, Kelley RK, Nervi B, Oh DY, Zhu AX. Biliary tract cancer. Lancet. 2021;397:428‐444. [DOI] [PubMed] [Google Scholar]
- 19. Li X, Sun Z, Li X, et al. Biomarkers for predicting the prognosis of intrahepatic cholangiocarcinoma: a retrospective single‐center study. Medicine (Baltimore). 2023;102:e33314. [DOI] [PMC free article] [PubMed] [Google Scholar]
- 20. Lin J, Li J, Kong Y, et al. Construction of a prognostic model for hepatocellular carcinoma patients receiving transarterial chemoembolization treatment based on the tumor burden score. BMC Cancer. 2024;24:306. [DOI] [PMC free article] [PubMed] [Google Scholar]
- 21. Ho SY, Liu PH, Hsu CY, et al. Tumor burden score as a new prognostic marker for patients with hepatocellular carcinoma undergoing transarterial chemoembolization. J Gastroenterol Hepatol. 2021;36:3196‐3203. [DOI] [PubMed] [Google Scholar]
- 22. Li Y, Chen Z, Tao W, Sun N, He J. Tumor mutation score is more powerful than tumor mutation burden in predicting response to immunotherapy in non‐small cell lung cancer. Cancer Immunol Immunother. 2021;70:2367‐2378. [DOI] [PMC free article] [PubMed] [Google Scholar]
- 23. Yonekawa Y, Uehara K, Mizuno T, et al. The survival benefit of neoadjuvant chemotherapy for resectable colorectal liver metastases with high tumor burden score. Int J Clin Oncol. 2021;26:126‐134. [DOI] [PubMed] [Google Scholar]
- 24. Moazzam Z, Lima HA, Alaimo L, et al. Impact of tumor burden score on timing and patterns of recurrence after curative‐intent resection of hepatocellular carcinoma. Surgery. 2022;172:1448‐1455. [DOI] [PubMed] [Google Scholar]
- 25. Bagante F, Spolverato G, Merath K, et al. Intrahepatic cholangiocarcinoma tumor burden: a classification and regression tree model to define prognostic groups after resection. Surgery. 2019;166:983‐990. [DOI] [PubMed] [Google Scholar]
- 26. Endo Y, Sasaki K, Moazzam Z, et al. Higher tumor burden status dictates the impact of surgical margin status on overall survival in patients undergoing resection of intrahepatic cholangiocarcinoma. Ann Surg Oncol. 2023;30:2023‐2032. [DOI] [PubMed] [Google Scholar]
- 27. Chan AW, Chan SL, Mo FK, et al. Albumin‐to‐alkaline phosphatase ratio: a novel prognostic index for hepatocellular carcinoma. Dis Markers. 2015;2015:564057. [DOI] [PMC free article] [PubMed] [Google Scholar]
- 28. Huang W, Wei S, Dong X, et al. Preoperative albumin‐alkaline phosphatase ratio affects the prognosis of patients undergoing hepatocellular carcinoma surgery. Cancer Biomark. 2024;39:15‐26. [DOI] [PMC free article] [PubMed] [Google Scholar]
- 29. Li H, Wang L, Chen L, et al. Prognostic value of albumin‐to‐alkaline phosphatase ratio in hepatocellular carcinoma patients treated with liver transplantation. J Cancer. 2020;11:2171‐2180. [DOI] [PMC free article] [PubMed] [Google Scholar]
- 30. Zhang X, Xin Y, Chen Y, Zhou X. Prognostic effect of albumin‐to‐alkaline phosphatase ratio on patients with hepatocellular carcinoma: a systematic review and meta‐analysis. Sci Rep. 2023;13:1808. [DOI] [PMC free article] [PubMed] [Google Scholar]
- 31. Qiu ZC, Li C, Zhang Y, et al. Tumor burden score‐AFP‐albumin‐bilirubin grade score predicts the survival of patients with hepatocellular carcinoma after liver resection. Langenbeck's Arch Surg. 2023;408:250. [DOI] [PubMed] [Google Scholar]
- 32. Moazzam Z, Alaimo L, Endo Y, et al. Combined tumor burden score and carbohydrate antigen 19‐9 grading system to predict outcomes among patients with intrahepatic cholangiocarcinoma. J Am Coll Surg. 2023;236:804‐813. [DOI] [PubMed] [Google Scholar]
Associated Data
This section collects any data citations, data availability statements, or supplementary materials included in this article.
Supplementary Materials
Table S1: Comparison of predictive value in OS and RFS.
Data Availability Statement
All data included in this study are available upon request by contact with the corresponding author.