Abstract
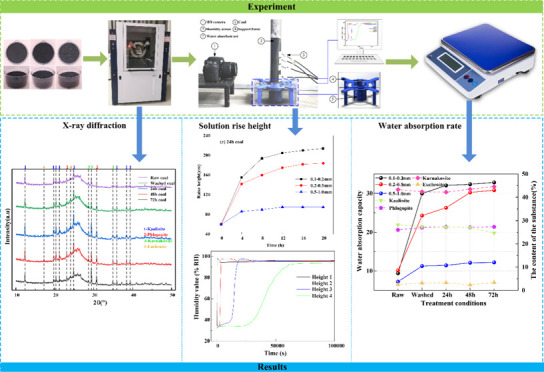
Reducing pollution caused by coal dust has always been a hot issue in the coal mining industry, and the water absorption of coal particles plays an important role in dust reduction. To study the relationship between different immersion time and the water absorption of coal particles, the substance content of coal particles after immersion was analyzed and water absorption characterization of coal particles was carried out by X-ray diffraction (XRD), water absorption calculations, and water absorption measurements. The results indicate that immersion can alter the material content of coal particles, leading to a decrease in the content of soluble mineral kaolinite, thereby affecting the wettability of coal particles. Notably, the longer the immersion time, the higher the water absorption rate of the particles, indicating a more significant water absorption effect. Furthermore, there is a negative correlation between particle sizes and water absorption of coal particles. The research results provide a theoretical reference for reducing coal dust pollution and improving the efficiency of dust suppression through spray.
1. Introduction
The increasing global energy consumption has drawn continuous attention to fossil fuels.1 As one of the most important and indispensable energy sources globally, coal serves as a vital pillar for global economic development.2,3 However, the extraction of coal resources often results in significant coal dust emissions.4 These coal dust emissions can trigger pneumoconiosis, affecting the health of miners.5−7 Additionally, they can lead to explosion accidents in enclosed spaces.8 Coal dust has become a prominent issue affecting the occupational health of miners and constraining the safe and efficient extraction of coal mines.9
To address this issue, extensive spraying operations are employed during the mining, transportation, and utilization processes to control dust. However, repeated spraying of coal particles can alter their physical and chemical properties, particularly affecting their water absorption.10 Water absorption is one of the key indicators affecting the effect of dust suppression, which is of great significance for dust suppression.11,12 Therefore, it is of guiding significance for coal dust suppression to study the changes in the properties of coal particles after immersion in water, especially the changes in water absorption.
Currently, many scholars, both domestically and internationally, research measuring the water absorption of particles, primarily using methods such as the contact sponge method,13 penetration method,14 immersion method,15 Karsten tube method,16 infrared thermography,17 capillary water absorption,18 partial immersion method,19 electrical resistivity method,20 nuclear magnetic resonance method,21 and others. The measurement methods are as shown in Table 1.
Table 1. References for Water Absorption Measurement Methods.
| no. | time | author | method | research contents |
|---|---|---|---|---|
| 1 | 200813 | Delphine Vandevoorde | contact sponge method | the contact sponge method was proposed to measure the water absorption of materials treated with hydrophobic products to assess the efficiency of the hydrophobic barrier. |
| 2 | 201114 | Buckton G | penetration method | the technique of liquid penetration into the powder bed was used to assess the water absorption of the powder. |
| 3 | 202015 | K. Chellamuthu | immersion method | samples were fully immersed in three liquids, deionized water, normal water, and brine, and their weight gain was recorded. |
| 4 | 202016 | R. Duarte | karsten tube method | absorption and surface moisture of in-service wall coating systems were evaluated using Karst tubes and moisture meters. |
| 5 | 202117 | Marynowicz Andrzej | iInfrared thermography | a novel and relatively simple method was proposed for determining the water absorption of polycapillary-porous materials by using a thermal imaging camera to record the surface temperature of the specimen. |
| 6 | 202118 | Zhiyong Liu | capillary water absorption | the water absorption in unsaturated concrete was investigated using capillary water absorption experiments. |
| 7 | 202319 | Bing Li | partial immersion method | Study of salt migration and water absorption in cement mortars partially immersed in salt solutions with different water-cement ratios. |
| 8 | 202320 | Aragoncillo Ariel Miguel | electrical resistivity method | the water absorption properties of recycled concrete were investigated and resistivity was used as an indicator to predict the water absorption properties. |
| 9 | 202421 | Zhenyu Long | nuclear magnetic resonance method | a technique for measuring the capillary absorption coefficient of porous building materials using single-sided nuclear magnetic resonance (NMR) was proposed to evaluate the water absorption properties of the materials. |
Through the above research, it was found that the process of water absorption measurement is complex and costly. This paper, based on the fundamental theory of coal particle wettability, conducted experiments on the water absorption measurement of coal particles with different immersion time using a self-designed experimental apparatus. The water absorption of coal particles is characterized by substance analysis, water absorption rate, solution rise height, humidity values at different heights, and ascent rate. At the same time, the effect of immersion time on the water absorption characteristics of coal particles is revealed, and the conclusions of the study provided theoretical references for spray dust reduction.
2. Theory
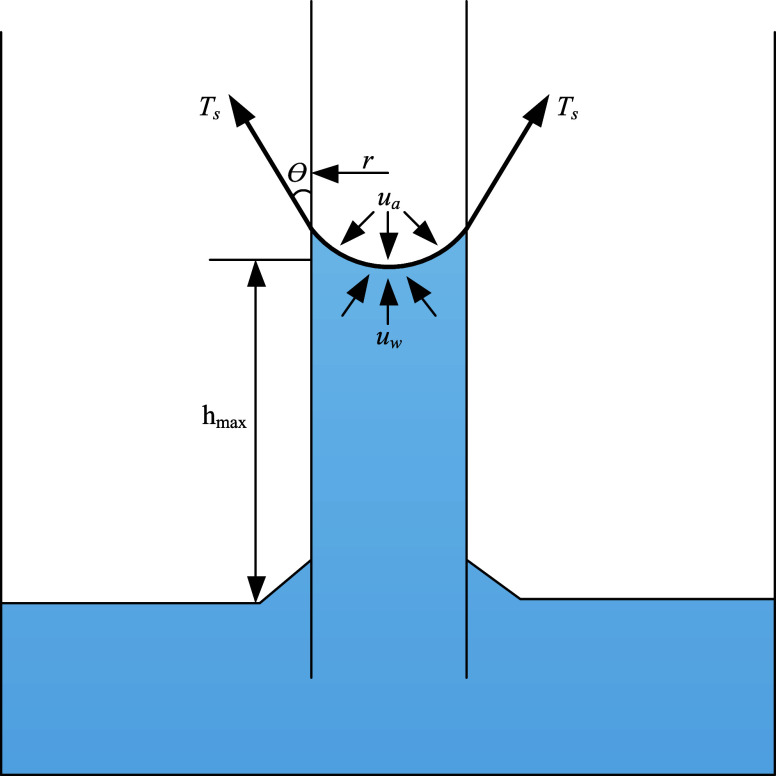
Under the condition of maintaining the general physical properties of the coal body, the pores between coal particles are considered as capillaries with small diameters. The ascent of the solution within the capillaries has a significant impact on the internal wettability of coal particles.22 The ascent of the solution is affected by two forces:23 The matric suction generated by the combined action of capillarity and short-range adsorption and the osmotic suction generated by solute dissolution are involved. According to the Kelvin equation,24 as shown in eq 1, the capillary rise of the internal solution within the particles is mainly influenced by matric suction pc. When the mechanical equilibrium is reached at the gas–liquid interface within the capillary between particles, the solution between particles ceases to rise.
| 1 |
where r is the radius of the capillary, θ is the contact angle between coal particles and the solution, ua is the pore gas pressure, uw is the pore liquid pressure, Ts is the surface tension of the liquid phase, and ua – uw is the matric suction.
For coal particles that are not wetted, when there is sufficient liquid, under the action of capillary forces, the liquid inside the capillary will be transported upward to a certain height. When the ascent of the solution stops, which is the maximum ascent height hmax, the surface tension at the gas–liquid interface between particle pores balances with the gravitational force acting on the solution, as shown in Figure 1. This mechanical equilibrium is represented by eq 2.
| 2 |
Therefore, the maximum capillary rise height is given by eq 3 below.
| 3 |
where g is the acceleration of gravity, typically taken as 9.8 m·s–2, ρw is the density of the solution. According to eq 3, it can be inferred that the smaller the pores between coal particles, the greater the surface tension, leading to a higher rise height of the solution and more pronounced the water absorption of the particles.
Figure 1.
Capillary gas–liquid equilibrium.
According to the Lucas-Washburn equation,25,26 it is known that under the action of capillary forces, liquid passes through a capillary tube with a radius of r. During the ascent process, there will be a pressure difference between the coal particles. The relationship between the square of the pressure difference Δ(P)2 and the time t is shown in eq 4.
| 4 |
where γ is the surface tension of the liquid, η is the viscosity of the liquid, θ is the contact angle between the liquid and the capillary. And Δ(P)2 is linearly related to t.
The capillary rise phenomenon is a significant occurrence that takes place between any nonwetting particles. The theory explains above addresses the factors influencing the height of liquid ascent in capillaries. Therefore, based on this theory, the present study conducts experiments to measure the water absorption of coal particles with different immersion time.
3. Experimental Section
3.1. Coal Sample Preparation
In this paper, the anthracite coal from Shangzhuang, Gongyi, Henan Province, China, was selected as the research object. The experimental coal samples were first crushed and then placed in a beaker, added with deionized water, and immersed for 1 min, 24, 48, and 72 h, respectively, to simulate the effect of washed and immersion of coal samples. Second, the wet coal particles were removed and put into a drying oven at 50 °C for 48 h to maximize the evaporation of moisture between the particles of the coal samples. To facilitate the determination of the water absorption of the particles in the tubes, the coal particles in the range of 0.1–0.2, 0.2–0.5, and 0.5–1.0 mm were sieved using a standard sieve. To avoid the influence of air humidity on the coal particles, the dried coal particles were stored in a constant temperature chamber at 25 °C for later use. All coal samples were strictly prepared according to the same procedure mentioned above to ensure the rigor of the experiment. The proximate and elemental analyses of the coal samples are shown in Table 2.
Table 2. Proximate and Elemental Analysis of Coal Samples.
| proximate
analysis w/% |
element
analysis w/% |
|||||
|---|---|---|---|---|---|---|
| Mad | Aad | Vad | FCad | C | O | S |
| 2.24 | 7.13 | 6.34 | 84.29 | 97.94 | 1.03 | 1.02 |
3.2. Experimental Equipment
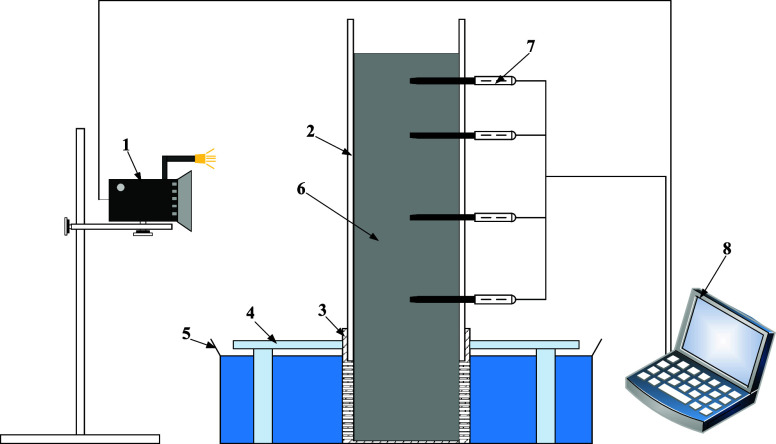
This study describes a set of apparatus for measuring the water absorption of coal particles. The water absorption measurement apparatus mainly consists of a water absorption device, a support frame, a water container, and other components, as shown in Figure 2. The main water absorption device for measurement is composed of acrylic tubes and a water-absorbing net. The acrylic tube has an inner diameter of 50 mm, a thickness of 3 mm, and a height of 500 mm. The water-absorbing net is located below the acrylic tube and has the same inner diameter as the acrylic tube. Around the water-absorbing net, many square holes measuring 1.2 mm × 1.2 mm are opened to ensure contact between the solution and the coal particles. To measure the wetting conditions of particles at different heights inside the tube, measurement points are set at heights of 100, 150, 190, and 210 mm on one side of the pipe to place humidity sensors. When not in use, the measurement points are sealed with tape.
Figure 2.
Water absorption measurement apparatus 1- HD camera;2- acrylic tube;3- water-absorbent net;4- support frame;5- water container;6- Coal;7- humidity sensor;8- calculator.
3.3. Experimental Methods
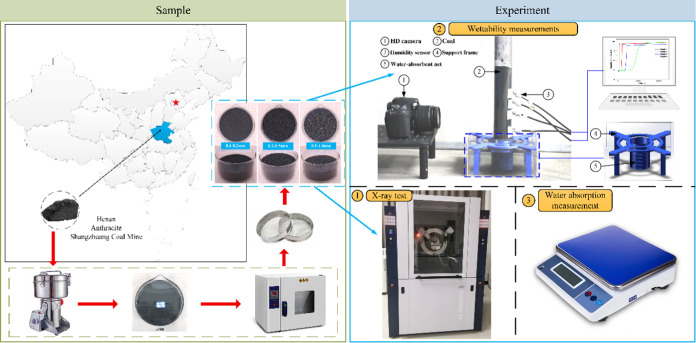
Based on the particle size composition of coal particles, this study conducted water absorption measurement experiments on coal particles, divided into three groups: experimental group A, experimental group B, and experimental group C, as shown in Table 3. The coal sample preparation and experimental steps are shown in Figure 3, mainly including coal sample preparation, XRD measurement, water absorption measurement, and water absorption rate experiment.
Table 3. Experimental Program.
| groups | particle size (mm) | immersion time (h) | number |
|---|---|---|---|
| A | 0.1–0.2 | raw | A-1 |
| Washed | A-2 | ||
| 24 | A-3 | ||
| 48 | A-4 | ||
| 72 | A-5 | ||
| B | 0.2–0.5 | raw | B-1 |
| washed | B-2 | ||
| 24 | B-3 | ||
| 48 | B-4 | ||
| 72 | B-5 | ||
| C | 0.5–1.0 | raw | C-1 |
| washed | C-2 | ||
| 24 | C-3 | ||
| 48 | C-4 | ||
| 72 | C-5 |
Figure 3.
Coal sample preparation and experimental steps.
3.3.1. XRD Measurement
The X-ray Diffraction experiment employed the D8 Advance X-ray powder diffractometer from Bruker, Germany. A copper target with Ka radiation was used, with tube voltage set at 40 kV and tube current at 40 mA. The 2θ scanning range for coal samples was varied from 10 to 50°, with a step interval of 0.02° and a step counter time of 0.3 s. Subsequently, the experimental data were processed using Jade 6 software for XRD pattern analysis. Three XRD measurements were taken for each of the five coal particles and averaged.
3.3.2. Water Absorption Measurement
Slowly and evenly fill 400 g of coal particles into the water absorption device, vibrating during filling to reduce the voids between particles. Next, insert the humidity sensors (RS485) into the measuring points, respectively. Then, move the water absorption device into the water container, secure it with a support frame, and pour deionized water of fixed mass into the container, ensuring that the liquid level is above the water absorption net. After solid–liquid contact, the humidity sensors start working to measure the water absorption inside the tube. Meanwhile, set up a HD camera (Canon EOS) externally to record the water absorption height every 2 h. To ensure comprehensive water absorption of the particles inside the tube, each experimental measurement lasts for 96 h. During the experiment, the temperature is controlled at around 20 °C room temperature.
3.3.3. Water Absorption Rate Experiment
Measure the weight of the water absorption device and the dry coal particles, and denote this total weight as m1. After the water absorption measurement experiment is completed, open the valve of the water container and let it stand until there is no more water flowing out of the device. Remove the water absorption device and weigh it using an electronic scale, and denote this total mass as m2. The water absorption mass of the coal particles is obtained by subtracting the initially recorded dry mass from the total mass measured after immersion in water. The water absorption rate is calculated as a percentage, with a calculation error of 0.1%. The expression for the moisture absorption rate (wt %) of the coal sample27 is as follows
| 5 |
where W is the water absorption rate of coal dust (wt %), m1 is the mass of dried coal particles, m2 is the mass after water immersion (g).
4. Results
4.1. XRD Measurement Results
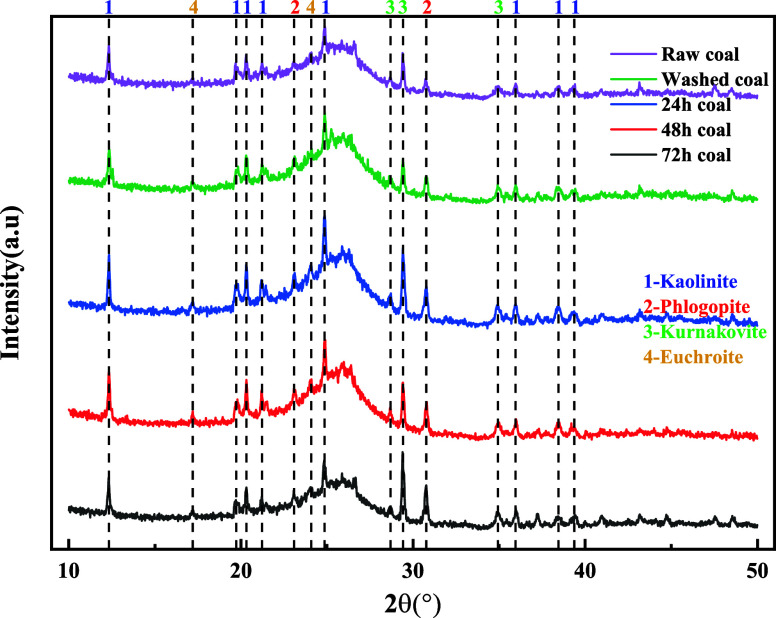
The microstructure of coal particles is an important factor affecting the water absorption of coal.28 To determine the effect of different immersion time on the water absorption of coal particles, experiments utilized an X-ray diffractometer to measure the mineral diffraction patterns of coal particles.29 The X-ray diffraction patterns of raw coal, washed coal, and coal particles immersed for 24, 48, and 72 h are shown in Figure 4. From Figure 4, it can be observed that immersion affects the elements of coal to a certain extent, and changes also occur within the coal particles with varying immersion time. Among them, the main characteristic peaks are located at 12, 20, 24, 26, 29, and 30°, with major mineral components being kaolinite, phlogopite, kurnakovite, and euchroite.
Figure 4.
X-ray diffraction patterns of coal samples with different immersion time.
The substance content of different coal particles is shown in Table 4. After being subjected to immersion for 24, 48, and 72 h, the kaolinite content in coal particles decreased by 0.5, 0.7, and 3%, respectively, compared to the raw coal particles. As the immersion time increases, the kaolinite content gradually decreases, while the content of the other three minerals remains relatively stable. This is determined by the physical properties of kaolinite, which is a clay mineral with excellent hydrophilicity. This explains why immersion results in a reduction in its phase abundance.30
Table 4. Substance Content of Coal Samples with Different Immersion Time.
| substance
content (%) |
||||
|---|---|---|---|---|
| immersion time (h) | kaolinite (%) | phlogopite (%) | kurnakovite (%) | euchroite (%) |
| raw coal | 28.2 | 26.0 | 43.3 | 2.5 |
| washed coal | 27.4 | 27.0 | 42.4 | 3.2 |
| 24 h coal | 27.2 | 27.3 | 42.2 | 3.3 |
| 48 h coal | 27.0 | 27.1 | 43.5 | 2.4 |
| 72 h coal | 24.7 | 27.3 | 44.6 | 3.4 |
In summary, immersion causes certain minerals in coal particles to undergo decomposition and soluble minerals to dissolve in water, thereby influencing the specific surface area and pore structure of coal particles to some extent. This leads to the formation of more capillary voids between coal particles, ultimately resulting in changes in the water absorption of the particles.31
4.2. Changes in Water Absorption
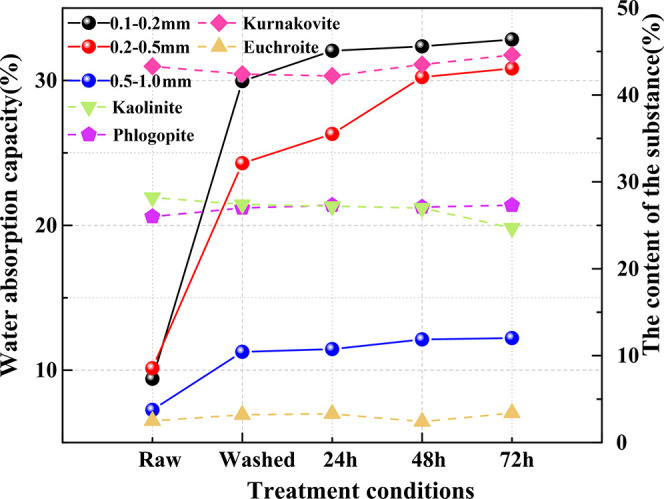
Figure 5 depicts the water absorption rate of coal particles. It can be observed from the graph that coal particles exhibit a certain degree of water absorption. However, the water absorption rate of coal particles subjected to immersion treatment significantly increases, with the increase in water absorption rate being directly proportional to the immersion time.32
Figure 5.
Water absorption of coal particles.
For coal particles sized 0.1–0.2 mm, the raw coal particle’s water absorption rate is 9.4%, which rapidly increases to 29.96% for washed coal particles. Compared to the raw coal particles, after 24 h of immersion, the water absorption rate of coal particles generally increases by 22.65%; when the immersion time is extended to 72 h, the absorption rate typically increases by approximately 23.43%. With the increase in immersion time, the absorption rate of this particle size increases by about 2.87%.
For coal particles sized 0.2–0.5 mm, the raw coal particle’s water absorption rate is roughly 10.13%, which increases to 14.16% for washed coal particles. Compared to the raw coal particles, after 24 h of immersion, the water absorption rate of coal particles generally increases by about 16.17%; when the immersion time is extended to 72 h, the absorption rate typically increases to 20.7%. With the increase in immersion time, the absorption rate of this particle size increases by 4.52%.
For coal particles sized 0.5–1.0 mm, the raw coal particle’s water absorption rate is approximately 7.25%. The water absorption rate rapidly increases to 4.02% for washed coal particles. After 24 h of immersion, the water absorption of coal particles typically increases by about 4.20%. When the immersion time is extended to 72 h, the absorption typically increases to 12.22%.
In summary, the water absorption rates of the three types of raw coal particles are below 10% without any treatment, indicating weak water absorption. For the coal particles of the three different particle sizes, the maximum increase in water absorption through immersion is 23.43%. Among them, for coal particles sized 0.1–0.2 mm, the change in water absorption rate is most significant with increasing immersion time, with an increase of 4.52%; while for coal particles sized 0.5–1.0 mm, the change in water absorption rate is relatively small, increasing by only 0.76%. Under the same treatment conditions, smaller coal particle sizes result in greater water absorption, while larger particle sizes result in less water absorption, indicating stronger water absorption for smaller particle sizes.
It can also be seen from Figure 5 that there is a relationship between the water absorption of coal particles and kaolinite content. While the other three mineral contents are relatively stable in the experiment and have less influence on the water absorption. The higher the kaolinite content, the less water the particles absorb. With increasing immersion time, the kaolinite content gradually decreases, leading to an increase in particle water absorption. When the kaolinite content reaches its lowest point of 24.7%, the water absorption of the three particle sizes increases to 32.83, 30.82, and 12.22%, respectively. This also explains how the dissolution of soluble minerals affects the water absorption of particles, which aligns with the aforementioned research findings.
Therefore, immersion can significantly improve the water absorption of coal particles, with the effect becoming more pronounced with a longer immersion time. Within a certain immersion time, with the increase of immersion time, the more soluble mineral kaolinite is dissolved, more capillary pores are generated inside the particles, so that a large amount of solution enters the capillary pores, and the water absorption effect is obvious. In addition, the amount of water absorption is affected by the particle size, and the coal particles with smaller particle size absorb more water. The results of the study further validate that water immersion improves the water absorption of coal particles from the qualitative aspect.
4.3. Solution Rise Height
The water absorption of coal particles can be reflected by their internal solution rise height.31 For coal particles with different particle sizes, the wetting height (solution rise height) of coal particles was compared under the same solution and treatment conditions, and the larger the value of solution rise height, the stronger the water absorption of coal particles and the easier they are to be wetted.33
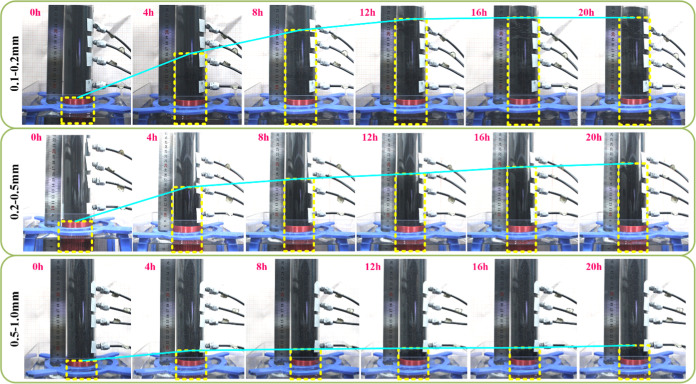
From Figure 6, it is found that the absorbed coal particles in the tube appear black in color and the unabsorbed particles appear gray-black and the demarcation line between the two parts is obvious, so the height of absorption of the coal particles can be recorded by external photographs.
Figure 6.
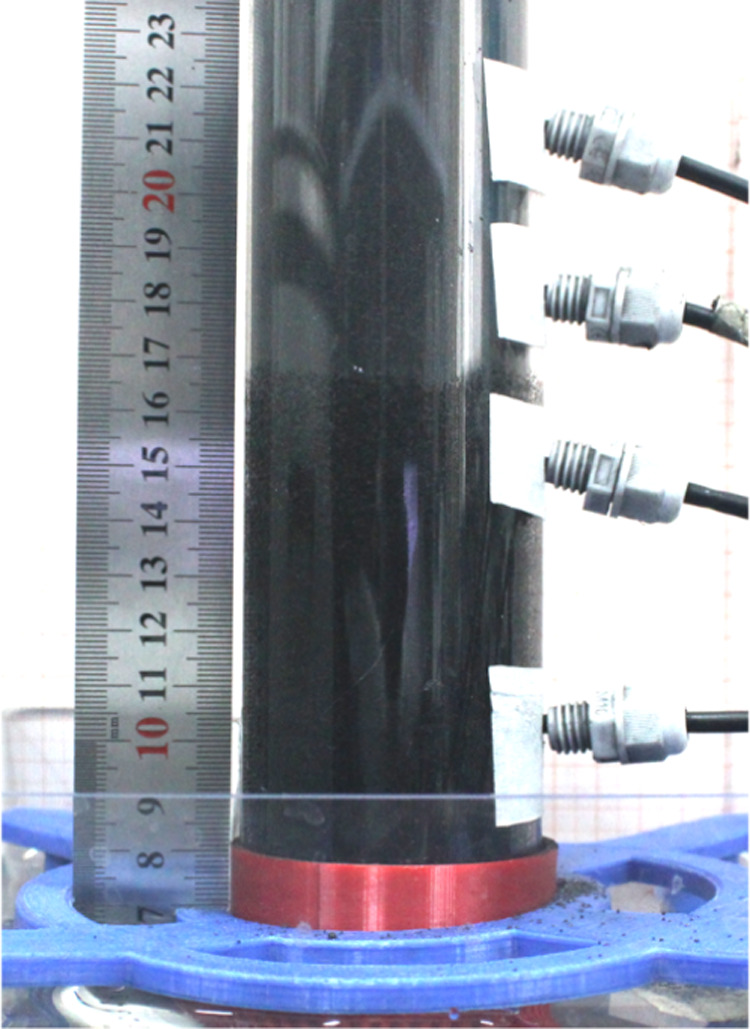
Water absorption height of coal particles in the tube.
The relationship between the solution rise height and time is shown in Figure 7: the solution in the coal particles with the increase of the time of water immersion, the three particle sizes of the change is basically the same, and the water absorption height is gradually rising, until rising to the equilibrium height. For the raw coal particles, the solution barely rises within the coal particles of the three particle sizes, and the water absorption height is only about 65 cm, which is the least satisfactory wetting effect. Compared with the raw coal particles, the water absorption phenomenon of the coal particles immersed in water for 72 h is the most significant, and the maximum rise height increases by 167 cm, as shown in Figure 8. It can also be seen from Figure 7 that the solution rise height is significantly affected by the particle size of coal particles, and the smaller the particle size, the higher the solution rise height. After 72 h of water immersion treatment, the water absorption effect of 0.1–0.2 mm is the most obvious, the solution rise height is 233 cm, and the water absorption height increases by 173 cm. The particle size of 0.5–0.9 mm is the least obvious water absorption effect, and the wetting height is only up to 100 mm, with a growth rate of about 17 mm. For the coal particles of 0.25–0.5 mm, the water absorption height and the growth amplitude are between the two particle sizes of 0.1–0.2, and 0.5–0.9 mm, which are 198, and 118 mm, respectively.
Figure 7.
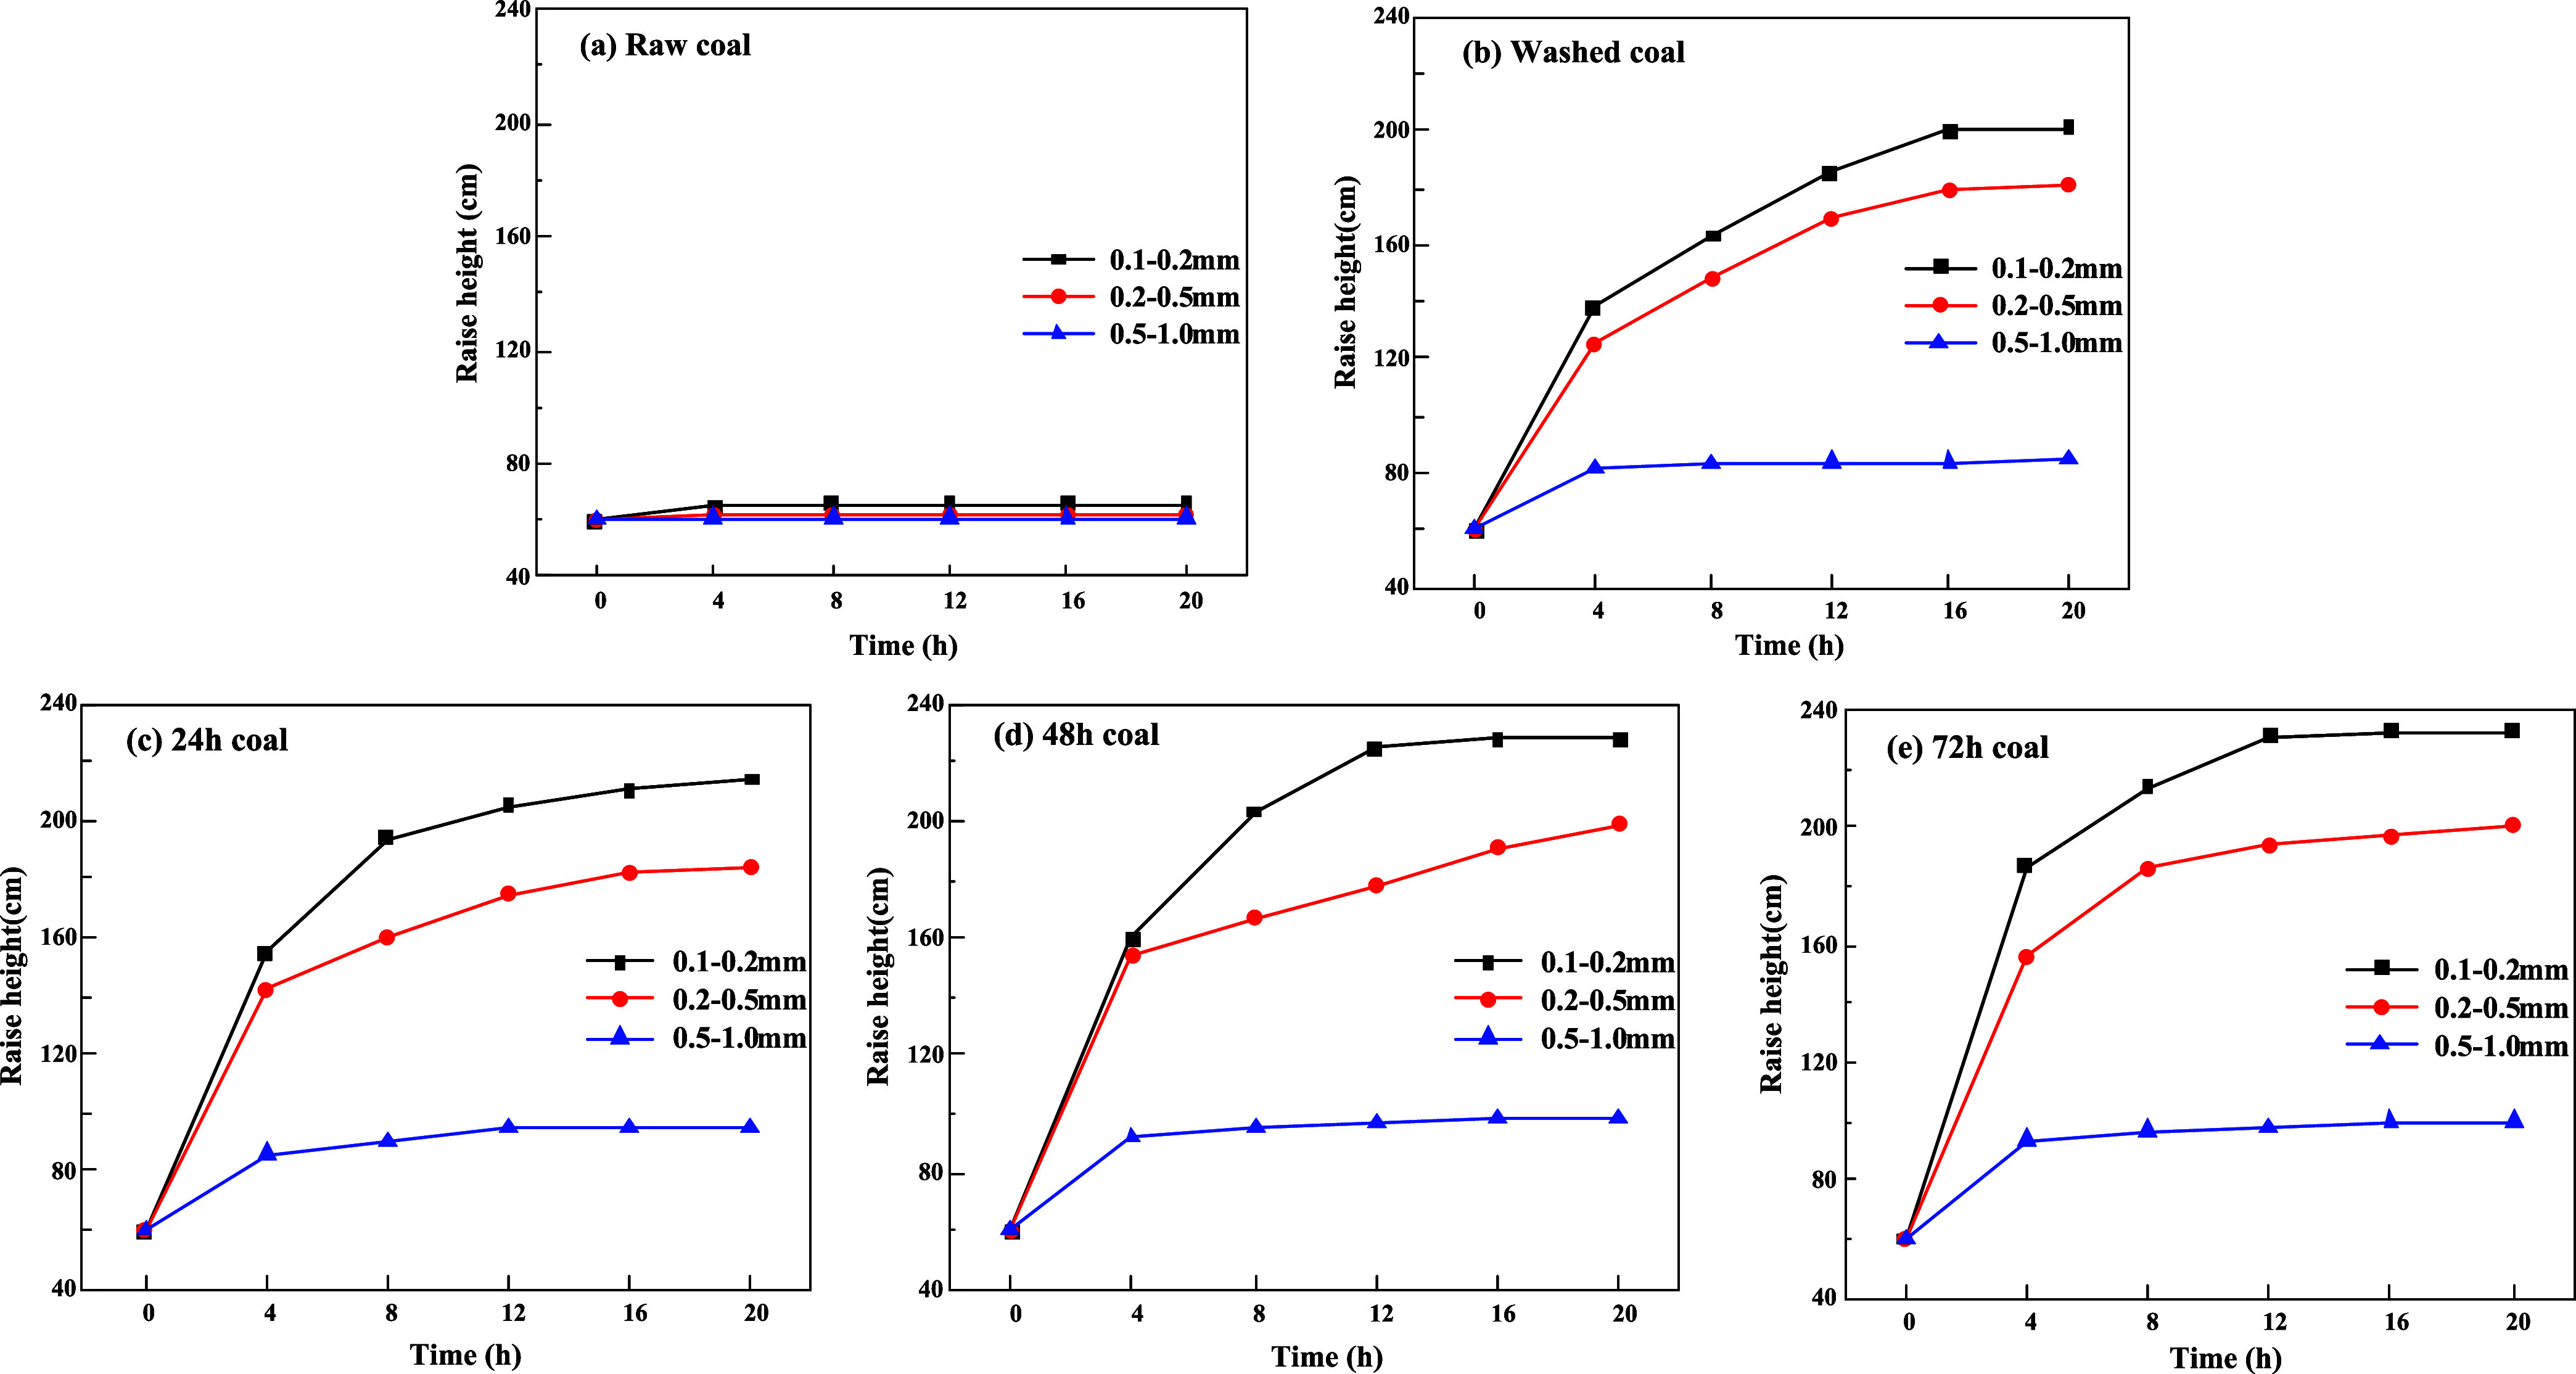
Relationship between the solution rise height and time.
Figure 8.
Height of solution rise for 72 h.
From the aspect of external camera, comparing the change rule of water absorption height with time for coal of three particle sizes, it is found that within a certain immersion time, the longer the immersion time is, the more water enters into the capillary pore space inside the particles. When the water inside the capillary pore space reaches saturation, the water will continue to diffuse upward into the interstices between the particles, which makes the water absorption height higher. These findings indicate that immersion time can indeed influence the water absorption characteristics of coal particles, yielding different wetting effects for different immersion durations. Furthermore, the variance in particle size affects the size of interstitial pores between particles, subsequently influencing capillary forces and ultimately impacting water absorption efficiency.
5. Discussion
5.1. Variation of Humidity Values at Different Heights
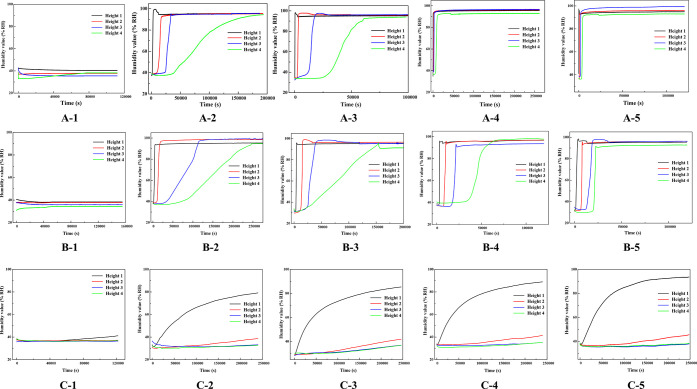
To investigate the changing trend of water absorption inside acrylic tubes, numerical measurements of water absorption were conducted on coal particles subjected to different immersion treatments within the tubes. Four height sensors, labeled Height 1, Height 2, Height 3, and Height 4 from bottom to top, were utilized to record the humidity values at the central position of the acrylic tubes over approximately 96 h. The relationship between humidity values at different heights within the tubes and time for the three particle sizes is illustrated in Figure 9. It can be observed that, apart from the untreated raw coal particles, the humidity values of coal particles treated with immersion have undergone corresponding changes, with humidity gradually increasing over time within the tubes and eventually stabilizing. In contrast, the humidity values of untreated coal particles remain unchanged, maintaining the indoor humidity level.
Figure 9.
Relationship between different height humidity values and time.
As the immersion time extends, the slope of the humidity values measured by the sensors gradually increases, indicating that the water absorption rate of particles within the same time frame accelerates. This is attributed to the alteration of coal substance content induced by immersion, resulting in the loss of soluble minerals and the generation of more microfissures within the particles. Consequently, this enhances the rate at which the solution wets the particles, thereby improving the water absorption characteristics of the particles.
Additionally, when comparing the humidity of different particle sizes, it was observed that the changes in humidity values are different for varying particle sizes. When the particle size of coal particles is less than 0.5 mm, the humidity values from all four sensors exceeded 90%RH in approximately 96 h, and the relationship between humidity values at different heights and time exhibited an “S” shape. However, the higher the height, the smaller the slope of the humidity values over time. This is because, as the solution ascends to greater heights, the capillary forces need to overcome higher gravitational potential, resulting in a slower water absorption rate.
When the particle size ranges from 0.5 to 1 mm, only the sensor at Height 1 exhibited significant changes, with a rapid initial increase followed by a slower ascent in humidity values. The humidity reached a maximum of 90%RH, indicating complete wetting at this height. However, there was a slight increasing trend in humidity values at Height 2, but they did not exceed 40%.
In summary, after a certain time of immersion, the longer the immersion time, the faster the rate at which each height reaches complete wetting. Smaller particle sizes result in less variation in humidity values among different heights after capillary water ascent, indicating that smaller particle sizes correspond to stronger capillary water absorption capabilities in coal particles.34
5.2. Particles Complete Wetting Height as a Function of Time
The ascent height of the solution within the coal particles, influenced by capillary forces, increases with time until the mechanical equilibrium is reached, and the ascent height stabilizes. In this study, the sensor recorded complete wetting of the particles when the humidity reached 90% RH. For the coal particles in experimental group C, as well as experimental groups A-1 and B-1, the humidity values at height 1 did not reach 90%, indicating that height 1 did not undergo complete wetting. Therefore, this study does not present graphs or calculate rates for particles of this size. The relationship between the complete wetting height of coal particles and time is shown in Figure 10. The coal particles within the treated tubes have completely wetted the heights of all four stages, but the time required for this wetting varies among them.
Figure 10.
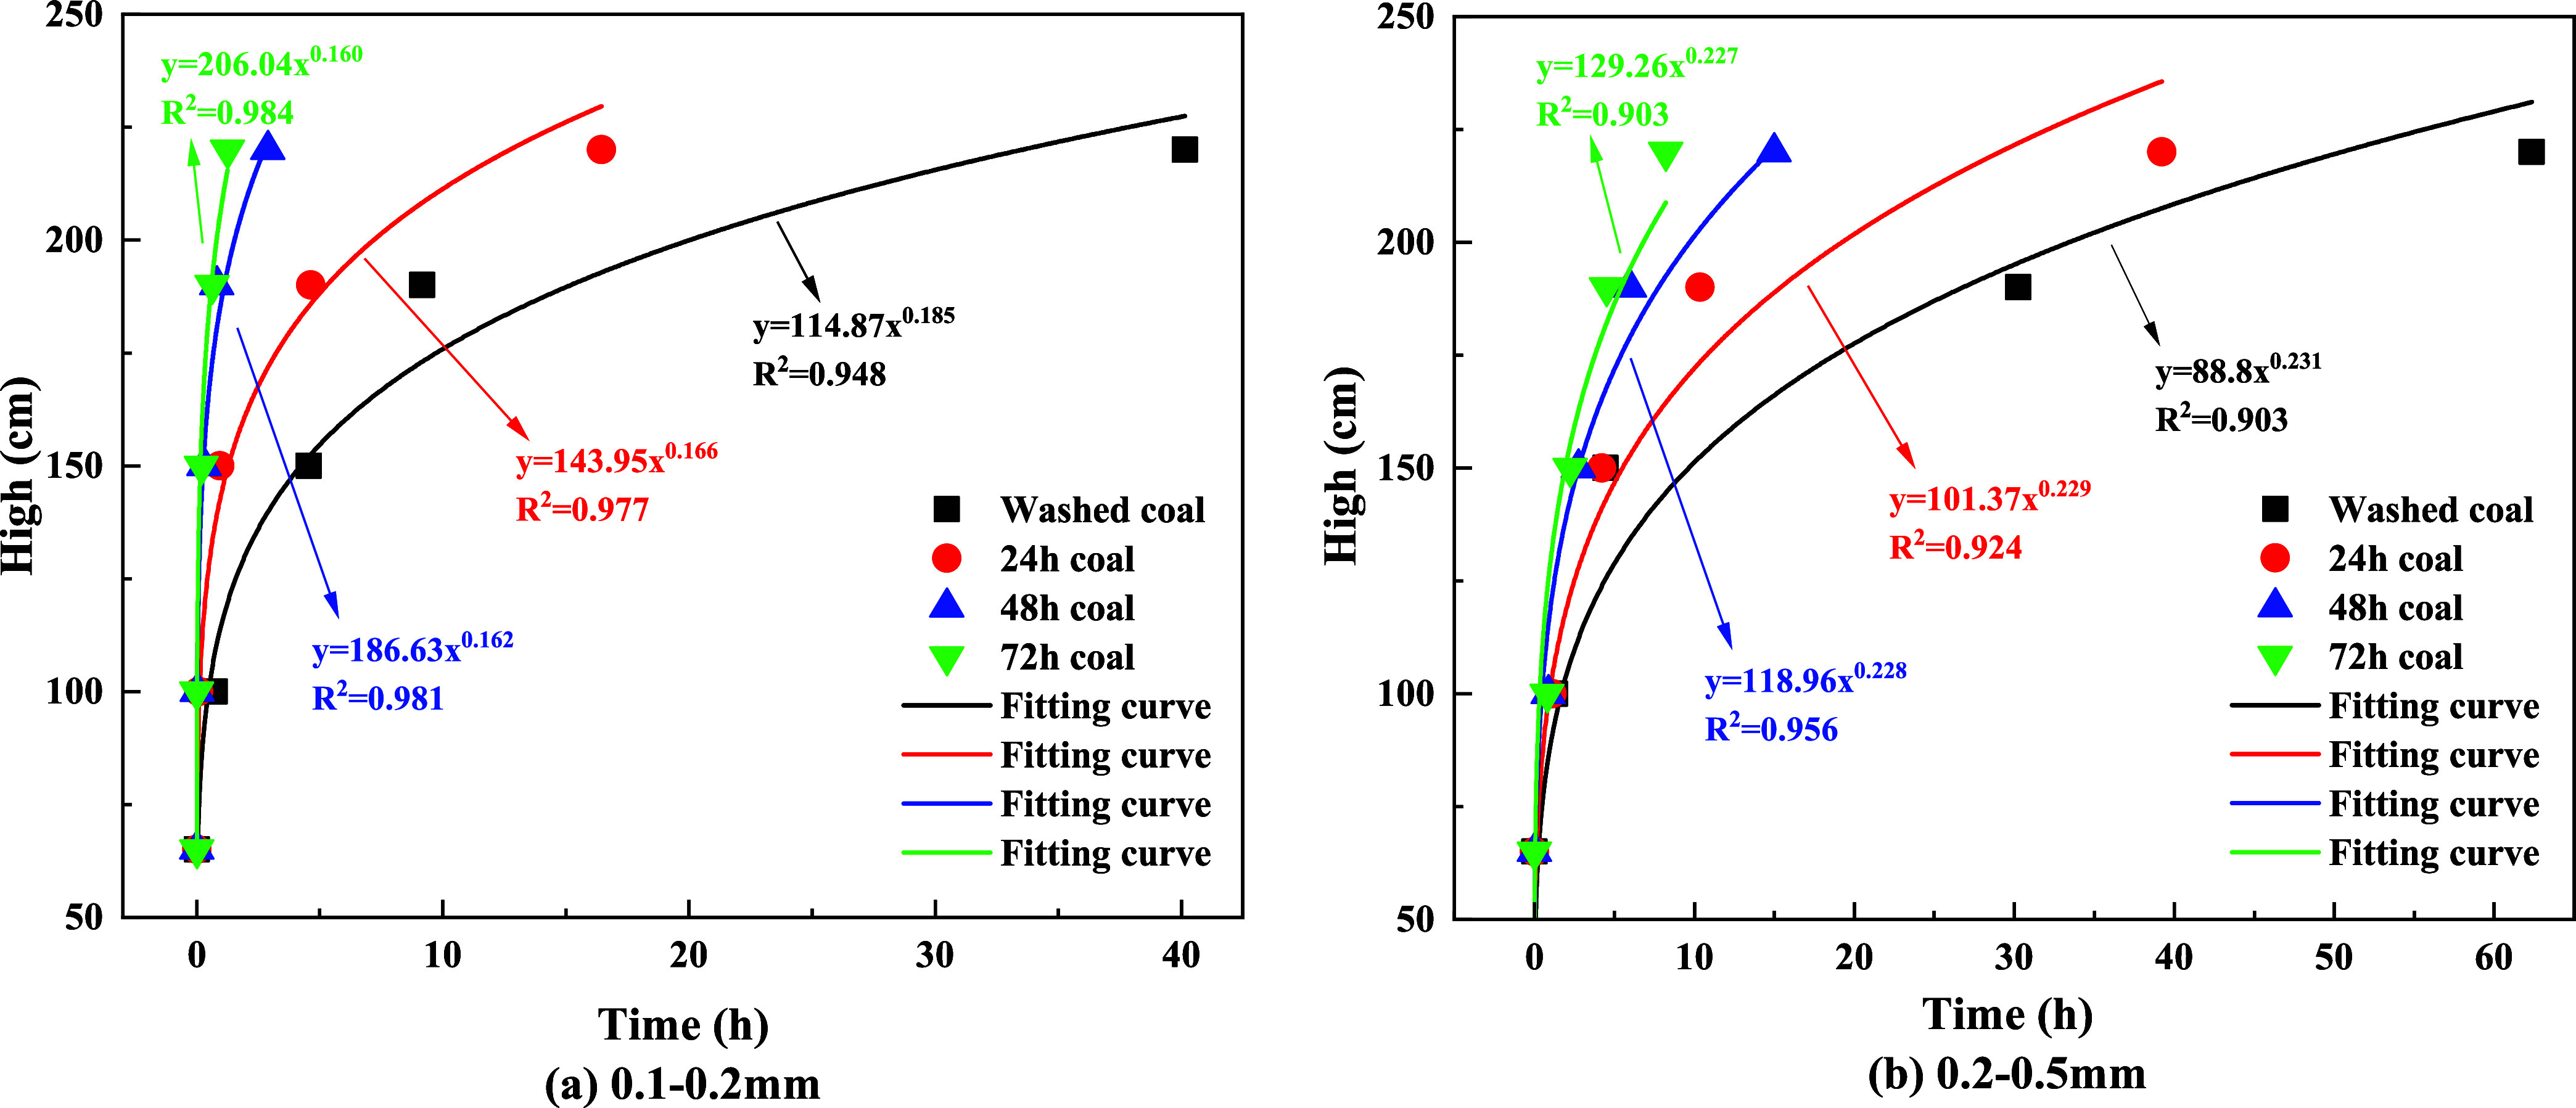
Relationship between complete wetting height and time.
From Figure 10a, it can be observed that for particles with a diameter of 0.1–0.2 mm, the time required for complete wetting of coal particles at heights of 100, 150, 190, and 220 mm after 72 h of immersion is shorter compared to the other three particle sizes, indicating the fastest wetting rate. The time required for coal particles immersed for 72 h to completely wet at Height 4 is shorter by 38.91, 14.75, and 1.65 h compared to those washed with water, immersed for 24 and 48 h, respectively. Furthermore, after 72 h of immersion, the solution of particles completely wets at Height 1 in just 1 min, whereas particles washed with water require 1.29 h, particles immersed for 24 h require 1.12 h, and particles immersed for 48 h require 0.87 h.
From Figure 10b, it can be observed that the water absorption rate of coal particles with a diameter of 0.25–0.5 mm exhibits a similar trend to that of particles with a diameter of 0.1–0.2 mm. Among these, coal particles immersed for 72 h demonstrate the fastest wetting rate. The time required for the solution to completely wet at Height 1 for particles washed with water and immersed for 24, 48, and 72 h is 1.29, 1.12, 0.87, and 0.83 h, respectively. However, the wetting rate of particles washed with water is the slowest. The time required for complete wetting at Height 4 is 54.13 h longer than that of particles immersed for 72 h, representing an 86.8% increase in time.
The curves depicting the changes in the time required for the complete wetting of coal particles in the solutions of experimental groups A and B were fitted separately. The fitting equations and corresponding coefficients are presented in Table 5. It can be observed from Table 5 that the relationship between the complete wetting height and time for different immersion durations conforms to an exponential function: y = axb, and the regression is significant. The fitting equation is represented as eq 5.
| 6 |
where H is the complete wetting height of the solution, t is the corresponding time, and a, b is the coefficient.
Table 5. Fitted Equations.
| coefficients |
|||||
|---|---|---|---|---|---|
| groups | immersion time | a | b | fitted equations | R2 |
| A | washed | 114.87 | 0.185 |  |
0.948 |
| 24 | 143.95 | 0.166 |  |
0.977 | |
| 48 | 186.63 | 0.162 |  |
0.981 | |
| 72 | 206.04 | 0.160 |  |
0.984 | |
| B | washed | 88.80 | 0.231 |  |
0.903 |
| 24 | 101.37 | 0.229 |  |
0.924 | |
| 48 | 118.96 | 0.228 |  |
0.956 | |
| 72 | 129.26 | 0.227 |  |
0.903 | |
Based on the coefficients a and b in the fitting equation for the wetting height of the solution inside the tube obtained from Table 5, their variations with immersion time are illustrated in Figure 11. It can be observed from Figure 11 that the value of the coefficient a increases with increasing immersion time. As the immersion time increases, the value of coefficient b gradually decreases. Combining the trends of the complete wetting height with time as shown in Figures 10 and 11, it can be inferred that the fitting equation with a larger value of coefficient a corresponds to the experimental group where the solution can completely wet to a higher height in a very short time after the start of the experiment.
Figure 11.
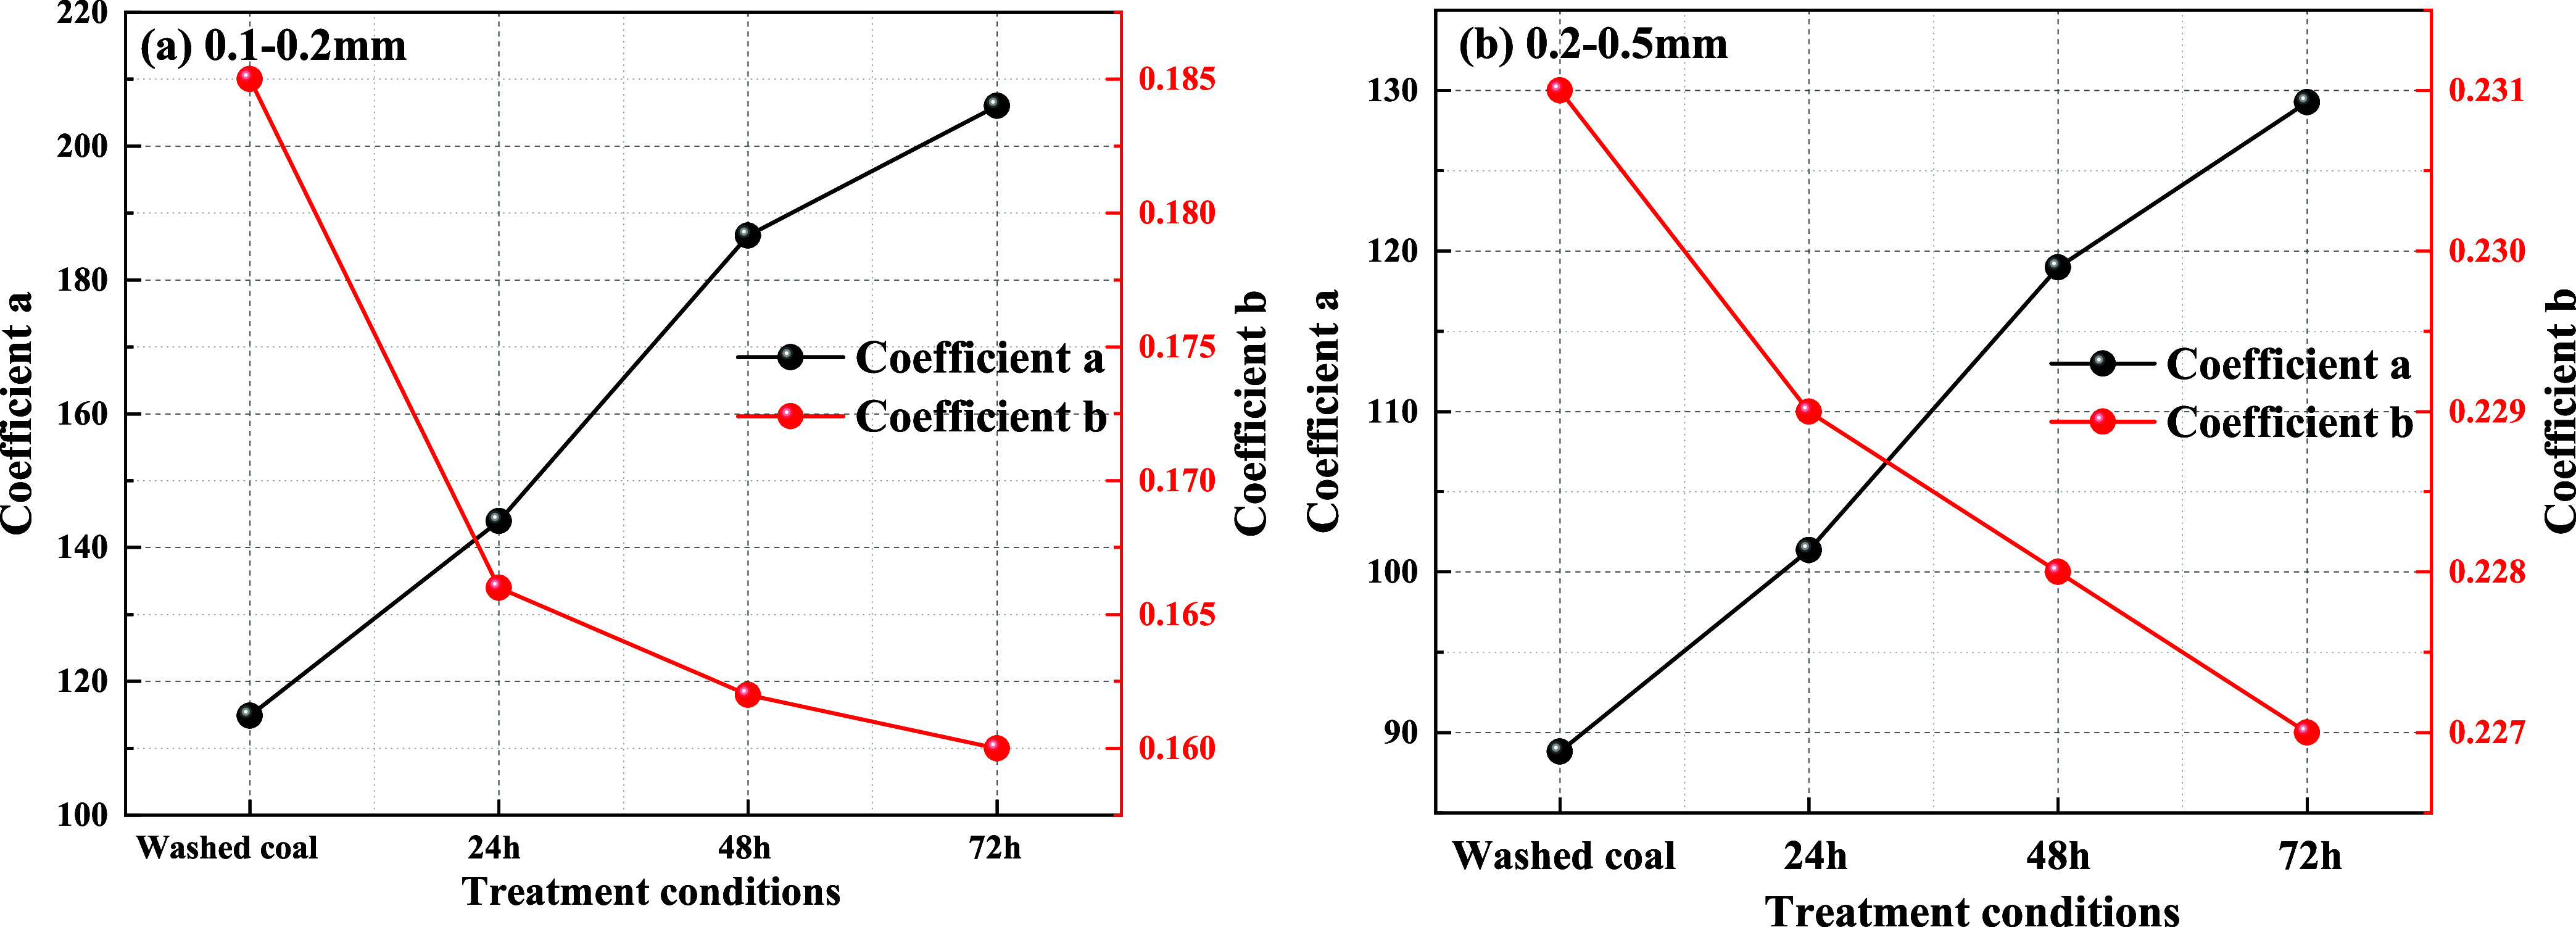
Relationship between coefficients a, b, and immersion time.
In summary, immersion significantly improves the rate of complete wetting of particles by the solution, leading to changes in the water absorption of coal particles. This aligns with the water absorption pattern of coal particles: under the same processing conditions, particles with longer immersion time tend to have more pores and fissures, facilitating faster diffusion and flow of the solution along the larger and more numerous pores and fissures, resulting in a faster water absorption rate.2 Conversely, particles with shorter immersion time typically have relatively fewer internal pores and fissures, leading to a slower rate of reaching the complete wetting height.
6. Conclusions
This study conducts water absorption measurement experiments on coal particles treated with different immersion time. The water absorption properties of coal particles are characterized using XRD analysis, water absorption, solution rise height, and humidity values at different heights, revealing the influence of immersion on particle water absorption. The research conclusions are as follows:
-
(1)
According to XRD analysis, the mineral content of coal particles treated with different immersion time varies compared to raw coal. Specifically, the content of soluble mineral kaolinite decreased from 27.7% in raw coal to 27.4, 27.2, 27.0, and 24.7% after being washed and immersed for 24, 48, and 72 h. The dissolution of soluble minerals leads to the formation of more pores in coal particles, thereby enhancing the water absorption of coal.
-
(2)
Based on the water absorption of coal particles, it is evident that the water absorption of particles significantly increases after immersion. The raw coal has a water absorption of only 10.13%, while the coal immersed for 72 h has a maximum increase in water absorption of 23.43%, with a corresponding decrease in kaolinite content. Therefore, a certain time of immersion treatment can increase the water absorption of coal. The smaller the particle size, the greater the water absorption of coal particles.
-
(3)
The height of the solution rise can reflect the water absorption of coal. Under the same treatment conditions, the longer the immersion time, the higher the solution rise height, indicating stronger water absorption. There is a negative correlation between the solution rise height and particle size; that is, the smaller the particle size and the smaller the pores, the greater the solution rise height.
-
(4)
The humidity values at different heights inside the tube are constantly changing. Within a certain immersion time, the longer the particles are immersed in water, the shorter the time for different heights to reach a fully wetted state, and the slope of the sensor rise gradually increases. Smaller particle sizes result in smaller differences in humidity value slopes at different heights, indicating stronger water absorption.
-
(5)
For coal particles treated with different immersion time, the change rule of complete wetting height with time satisfies the exponential function, and the coefficients in the function can effectively respond to the water absorption effect of coal particles.
Acknowledgments
The paper is funded by the National Natural Science Foundation of China (52075230), the Natural Science Foundation of Jiangsu Province (BK20221394), and Postgraduate Research & Practice Innovation Program of Jiangsu Province (2024XKT0637).
The authors declare no competing financial interest.
References
- Zou Q.; Zhang T.; Ma T. Effect of water-based SiO2 nanofluid on surface wettability of raw coal. Energy 2022, 254, 124228 10.1016/J.ENERGY.2022.124228. [DOI] [Google Scholar]
- Wang H.; He J.; Yang J.; Wang H.; Zhang Y.; Cheng S.; Nie Z. Cracking and improved wettability of coal through liquid CO2 cyclic cold soaking for dust prevention. Process Saf. Environ. Prot. 2023, 171, 751–762. 10.1016/j.psep.2023.01.048. [DOI] [Google Scholar]
- Zou Q.; Huo Z.; Zhang T.; Jiang C.; Liang J. Surface deposition characteristics of water-based SiO2 nanofluids on coal. Fuel 2023, 340, 127489 10.1016/J.FUEL.2023.127489. [DOI] [Google Scholar]
- Zhao J.; Tian S.; Zou Q.; Xie H.; Ran Q.; Ma T.; Zhang X. Effect of SiO2-H2O nanofluids on wettability of pulverized coal and the modification mechanism. Fuel 2024, 359, 130396 10.1016/J.FUEL.2023.130396. [DOI] [Google Scholar]
- Zhao Z.; Chang P.; Ghosh A.; Xu G.; Liu Y.; Morla R. The influence of surfactants’ ionicity on the performance of coal dust suppression. Adv. Powder Technol. 2024, 35 (1), 104295 10.1016/j.apt.2023.104295. [DOI] [Google Scholar]
- Zhao Y.; Li H.; Lei J.; Xie J.; Li L.; Gan Y.; Deng J.; Qi R.; Liu Y. Study on the surface wetting mechanism of bituminous coal based on the microscopic molecular structure. RSC Adv. 2023, 13 (9), 5933–5945. 10.1039/D2RA07908A. [DOI] [PMC free article] [PubMed] [Google Scholar]
- Niu W.; Nie W.; Bao Q.; Tian Q.; Li R.; Zhang X.; Yan X.; Lian J. Study on the effects of surfactants on the interface characteristics and wettability of lignite. Powder Technol. 2023, 423, 118482 10.1016/j.powtec.2023.118482. [DOI] [Google Scholar]
- Bao Q.; Nie W.; Niu W.; Mwabaima I. F.; Tian Q.; Li R. Molecular simulation and wetting study on the mechanism and capability of hydrophilic surfactants used as spray dust suppressants for dust reduction in coal mines. Sustainable Chem. Pharm. 2023, 36, 101253 10.1016/j.scp.2023.101253. [DOI] [Google Scholar]
- Xu C.; Lin Z.; Zhou G.; Hu X.; Wang H.; Chen X. Effect of welan gum and carbomer on foam and wetting properties of sodium alpha-olefin sulfonate for coal dust control. J. Mol. Liq. 2023, 388, 122692 10.1016/j.molliq.2023.122692. [DOI] [Google Scholar]
- Ji H.; Peng X.; Yao J.; Mao Y.; Hou Y.; Sheng Z. Insight into the influence of small organic molecules on the wettability of coal. Fuel 2021, 294, 120537 10.1016/j.fuel.2021.120537. [DOI] [Google Scholar]
- Chen X.; Lv J.; Fan C.; Ge S.; Deng C.; Gao J. The effect of functional ionic liquids on the microstructure and wettability of coals with different metamorphic degrees. Fuel 2023, 352, 129047 10.1016/j.fuel.2023.129047. [DOI] [Google Scholar]
- Wang Y.; Wang C.; Li B. Wetting dynamics of a droplet impact on target-like chemically heterogeneous substrates: The determinations of contact angle. Colloid Interface Sci. Commun. 2023, 55, 100720 10.1016/j.colcom.2023.100720. [DOI] [Google Scholar]
- Vandevoorde D.; Pamplona M.; Schalm O.; Vanhellemont Y.; Cnudde V.; Verhaeven E. Contact sponge method: Performance of a promising tool for measuring the initial water absorption. J. Cult. Heritage 2009, 10, 41–47. 10.1016/j.culher.2008.10.002. [DOI] [Google Scholar]
- Buckton G.; Newton J. M. Assessment of the wettability and surface energy of a pharmaceutical powder by liquid penetration. J. Pharm. Pharmacol. 2011, 37 (9), 605–609. 10.1111/j.2042-7158.1985.tb05094.x. [DOI] [PubMed] [Google Scholar]
- Chellamuthu K.; Vasanthanathan A. Experimental analysis of GFRP with PET for tensile load and water absorption. Mater. Today: Proc. 2020, 21 (Pt1), 658–662. 10.1016/j.matpr.2019.06.734. [DOI] [Google Scholar]
- Duarte R.; Flores-Colen I.; Brito J.; Hawreen A. Variability of in-situ testing in wall coating systems - Karsten tube and moisture meter techniques. J. Build. Eng. 2020, 27, 100998 10.1016/j.jobe.2019.100998. [DOI] [Google Scholar]
- Andrzej M.; Andrzej K. Determination of the water absorption and water diffusion coefficients by means of infrared thermography measurements. Measurement 2021, 185, 110054 10.1016/J.MEASUREMENT.2021.110054. [DOI] [Google Scholar]
- Liu Z.; Gao S.; Wang J.; Wang Y.; Liu C.; Zhang Y.; Jiang J. Experimental and Simulation Study of Water Absorption in Unsaturated Concrete. J. Mater. Civ. Eng. 2021, 33 (12), 04021332 10.1061/(ASCE)MT.1943-5533.0003959. [DOI] [Google Scholar]
- Li B.; Meng Q.; Jean-Marc T.; Roberto G.; Li C.; Zhao J.; Ren P. Salt migration and capillary absorption characteristics of cement mortar partially immersed in NaCl solution. J. Build. Eng. 2023, 64, 105605 10.1016/J.JOBE.2022.105605. [DOI] [Google Scholar]
- Miguel A. A.; Douglas C.; Umashanger T.; Gilson L. Water sorptivity prediction model for concrete with all coarse recycled concrete aggregates. Constr. Build. Mater. 2023, 394, 132128 10.1016/J.CONBUILDMAT.2023.132128. [DOI] [Google Scholar]
- Long Z.; Zhang Z.; Zhang H. Nondestructive measurement of the capillary water absorption coefficient and water transport behaviors of porous building materials by using single-sided NMR. Constr. Build. Mater. 2024, 414, 134819 10.1016/j.conbuildmat.2023.134819. [DOI] [Google Scholar]
- Hamraoui A.; Tommy N. Analytical Approach for the Lucas–Washburn Equation. J. Colloid Interface Sci. 2002, 250 (2), 415–421. 10.1006/jcis.2002.8288. [DOI] [PubMed] [Google Scholar]
- Liu Z.; Xiong Y.; Lin W. Capillary rise method for the measurement of the contact angle of soils. Acta Geotech. 2016, 11 (1), 21–35. 10.1007/s11440-014-0352-x. [DOI] [Google Scholar]
- Wang Y.; Shardt N.; Lu C.; Li H.; Janet A. W. E.; Jin Z. Validity of the Kelvin equation and the equation-of-state-with-capillary-pressure model for the phase behavior of a pure component under nanoconfinement. Chem. Eng. Sci. 2020, 226, 115839 10.1016/j.ces.2020.115839. [DOI] [Google Scholar]
- Zhang H.; Wang F. Analysis of Surface Wettability of Synthetic Magnetite. J. Wuhan Univ. Technol., Mater. Sci. Ed. 2014, 29 (04), 679–683. 10.1007/s11595-014-0979-3. [DOI] [Google Scholar]
- Lucija H.; Ladislav K.; Ivan A. Capillary absorption in concrete and the Lucas–Washburn equation. Cem. Concr. Compos. 2009, 32 (1), 84–91. 10.1016/j.cemconcomp.2009.10.005. [DOI] [Google Scholar]
- Evgenii M. S.; Sergey A. S.; Alexey N. B.; Levon R. M.; Besarion M.; Diana E.; Andrei C.; Alexander L. M.; Oxana A. Eco-Friendly Sustainable Concrete and Mortar Using Coal Dust Waste. Materials 2023, 16 (19), 6604 10.3390/MA16196604. [DOI] [PMC free article] [PubMed] [Google Scholar]
- Zhang L.; Wen C.; Li S.; Yang M. Evolution and oxidation properties of the functional groups of coals after water immersion and air drying. Energy 2024, 288, 129709 10.1016/j.energy.2023.129709. [DOI] [Google Scholar]
- Guo S.; Yang W.; Yuan S.; Zhuo Y.; Geng W. Experimental investigation of erosion effect on microstructure and oxidation characteristics of long-flame coal. Energy 2022, 259, 124959 10.1016/J.ENERGY.2022.124959. [DOI] [Google Scholar]
- Liu H.; Li Z.; Zheng C.; Wang Y.; Song F.; Meng X. Wettability Characteristics of Low-Rank Coals Under the Coupling Effect of High Mineralization and Surfactants. ACS Omega 2023, 8 (8), 39004–39013. 10.1021/ACSOMEGA.3C03583. [DOI] [PMC free article] [PubMed] [Google Scholar]
- Liu S.; Wang J.; Wu J.; Tang Y. Modification and enhancement of permeability of coal seam using mined CO 2 foam fracturing fluid. J. Nat. Gas Sci. Eng. 2018, 60, 32–39. 10.1016/j.jngse.2018.09.028. [DOI] [Google Scholar]
- Ji H.; Guan X.; Wang Y.; Zhang P.; Long H. Discussion on the water absorption depth of gangue-based concrete and its relationship with the damage layer thickness. J. Build. Eng. 2023, 79, 107735 10.1016/j.jobe.2023.107735. [DOI] [Google Scholar]
- YIN S.-h.; Wang L.; Chen X.; Wu A. Effect of ore size and heap porosity on capillary process inside leaching heap. Trans. Nonferrous Met. Soc. China 2016, 26 (3), 835–841. 10.1016/S1003-6326(16)64174-2. [DOI] [Google Scholar]
- Liu D.; Lu C.; Lian M.; Gu Q.; Jing Y. Experimental Study on Capillary Water Migration Characteristics of Tailings with Different Particle Sizes. Geofluids 2022, 2022, 5187800 10.1155/2022/5187800. [DOI] [Google Scholar]


