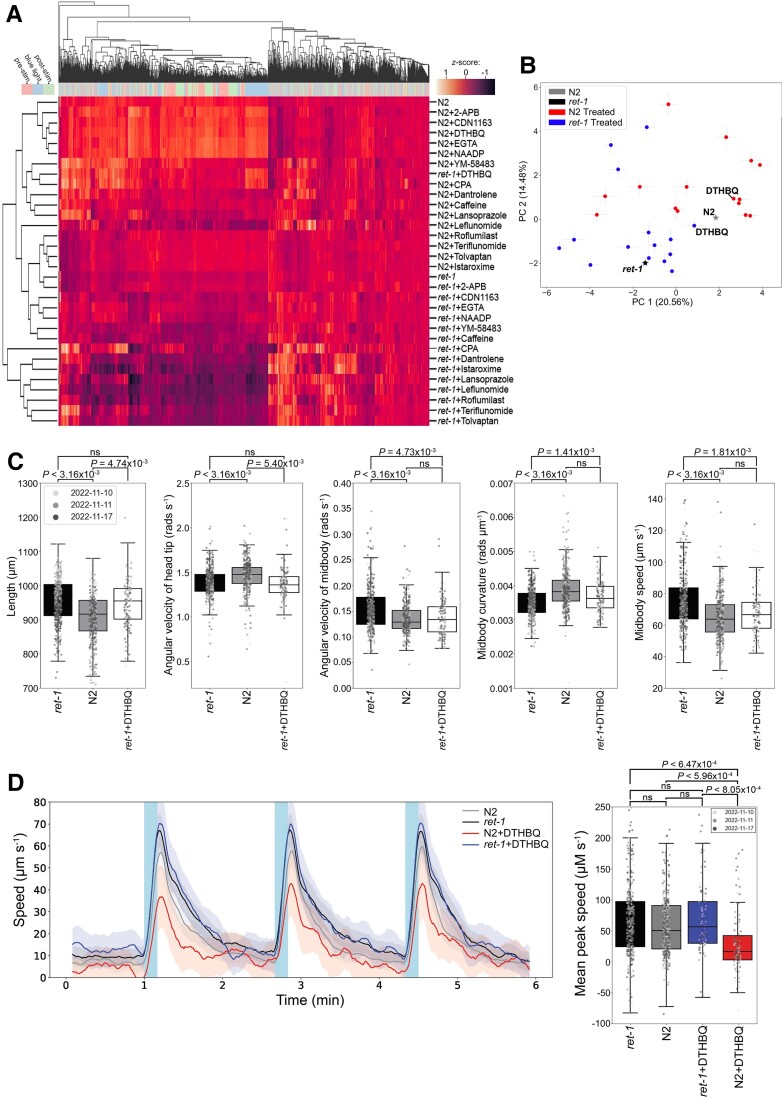
Figure 3.
Loss-of-function ret-1 (RTN2 homologue) Caenorhabditis elegans phenotyping and drug screen data. (A) Hierarchical clustering of behavioural fingerprints of untreated wild-type (N2) and C. elegans RTN2 orthologue, ret-1, loss-of-function (LoF) strains, alongside treatment with the panel of 15 bioactive compounds. The heatmap shows the entire set of 8289 behavioural features extracted by Tierpsy for untreated worms and worms exposed to 100 μM of each compound for 4 h. The top dendrogram shows the relationship of the individual extracted features within the entire feature set, with the tracking period bar denoting when during image acquisition the feature was extracted: pre-stimulation (pink), during stimulation with blue light (blue) and post-stimulation (green). The left dendrogram shows the phenotypic similarity of the worms and the colour map (top left) represents the normalized z-score of the features. Despite the strains generally clustering separately from each other, treatment of ret-1 LoF mutant with 2,5-di-tert-butylhydroquinone (DTHBQ) caused this strain to cluster alongside N2, suggesting phenotypic rescue of the mutant. (B) Position of N2 and ret-1 LoF worms in phenospace with respect to the top principal components in the behavioural feature set upon drug treatment. Untreated worms are denoted by stars and treated N2 or treated ret-1(syb4955). Error bars represent the standard error of the mean. Treatment of the ret-1 LoF strain with DTHBQ moved the mutant towards the untreated wild-type in phenomic space. (C) Key morphological, postural and locomotive features were significantly different between the untreated ret-1 LoF mutant (black boxes) and untreated N2 (grey boxes). From left to right: ret-1 mutants are longer; have decreased angular velocity of the head; increased angular velocity of the midbody; decreased midbody curvature; and increased midbody speed. White boxes show ret-1(syb4955) exposed to 100 μM DTHBQ for 4 h, rescuing of 3/5 of the key behavioural features. (D) Overall speed of ret-1 LoF mutant and N2 worms after 4 h exposure to DTHBQ. Treatment of N2 with DTHBQ resulted in an attenuation of the photophobic escape response (increased speed) following stimulation of the worms with three 10 s bursts of high-intensity blue light 100 s apart (denoted by blue shaded regions on the line plot), whereas the ret-1 LoF mutant showed resistance to the effects of DTHBQ. The mean peak speed (box plot, right) was calculated as an average of the maximum detected speed across the three independent pulses of blue light. Individual points marked on all box plots are average values from multiple worms (n = 3) in a single well. The different point colours indicate data from independent experimental days. P-vales were calculated using block permutation t-tests (n = 10 000 permutations). Permutations were shuffled randomly within, but not between, the independent days of image acquisition in order to control for day-to-day variation in the experiments and corrected for multiple comparisons using the Benjamini-Hochberg procedure to control the false discovery rate at 5%. P > 0.05 was considered not statistically significant (ns).

