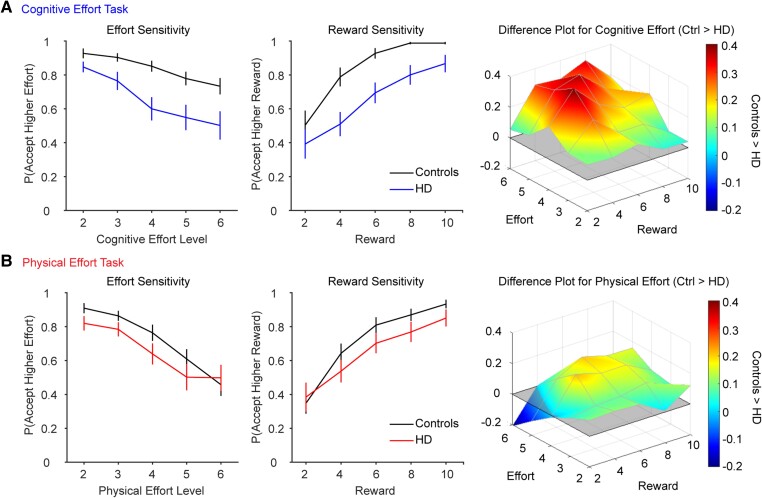
Figure 3.
Choices in the (A) cognitive and (B) physical effort tasks (mean ± 1 SEM). Acceptance rates for the higher-effort/higher-reward offer are plotted as a function of effort (left column) and reward (middle column). Difference plots illustrate choice differences between the Huntington’s disease (HD) and control groups across the two-dimensional effort-reward space (right column). Red indicates greater motivation in controls than the HD group. (A) For cognitive effort-based choices, the HD group were less willing than controls to accept the higher-effort/higher-reward offers. (B) For the physical effort-based choices, group differences were less pronounced. SEM = standard error of the mean.

