Abstract
Safety pharmacology examines the potential for new drugs to have unusual, rare side effects such as torsade de pointes (TdP). Recently, as a part of the Comprehensive in vitro Proarrhythmia Assay (CiPA) project, techniques for predicting the development of drug-induced TdP through computer simulations have been proposed and verified. However, CiPA assessment generally does not consider the effect of cardiac cell inter-individual variability, especially related to metabolic status. The study aimed to explore whether rare proarrhythmic effects may be linked to the inter-individual variability of cardiac cells and whether incorporating this variability into computational models could alter the prediction of drugs’ TdP risks. This study evaluated the contribution of two biological characteristics to the proarrhythmic effects. The first was spermine concentration, which varies with metabolic status; the second was L-type calcium permeability that could occur due to mutations. Twenty-eight drugs were examined throughout this study, and qNet was analyzed as an essential feature. Even though there were some discrepancies of TdP risk predictions from the baseline model, we found that considering the inter-individual variability might change the TdP risk of drugs. Several drugs in the high-risk drugs group were predicted to affect as intermediate and low-risk drugs in some individuals and vice versa. Also, most intermediate-risk drugs were expected to act as low-risk drugs. When compared, the effects of inter-individual variability of L-type calcium were more significant than spermine in altering the TdP risk of compounds. These results emphasize the importance of considering inter-individual variability to assess drugs.
Keywords: Torsades de Pointes, In silico Simulation, Drug Toxicity, Inter-Individual Biological Variation
INTRODUCTION
A well-known heart disorder that can lead to sudden cardiac death is torsade de pointes (TdP). One of the leading causes of TdP is drug-induced TdP, which enforces the withdrawal of several medicines from the market. Therefore, it has been an important concern for the drug industry and worldwide regulatory authorities [1]. As discussed by Sager et al. [2], the present drug safety approach has some significant limitations, such as repolarization that is not sufficiently predicted by criteria for blocking IKr alone, the prolongation of QTc being rather sensitive but not specific for predicting ventricular proarrhythmic risk, and some drugs having no proarrhythmic risk being able to block IKr. To address the limitations of the current drug safety approach, researchers have proposed a new safety paradigm entitled Comprehensive In vitro Proarrhythmia Assay (CiPA) that incorporates the in-silico assessment of TdP risk of drugs into drug assessment procedure.
Several studies on drug assessment have incorporated CiPA approach to predict and classify TdP risk of drugs. Early research by Mirams et al. [3], proposed the model of drug effect by using Hill’s equation [4] on multiple ion channels (hERG, sodium [Na], and L-type calcium [CaL]). The authors found that incorporating the drugs’ effect (inhibition effect) on multiple ion channels could improve the in-silico classification of TdP risk of drugs compared to using drug’s effect on hERG channel only. Furthermore, several studies proposed the model of drug effects on more ion channels, including hERG, Ks, K1, to, Na, NaL, and CaL channels [5,6,7]. Other research incorporated repolarization abnormality (RA) and electromechanical window (EMw) to assess the TdP risk of drugs [8,9]. The authors found that RA alone might achieve an accuracy of about 89%, while the combination of RA and EMw could gain 90% accuracy with a much lower concentration of drugs used in the simulation.
Typically, the in-silico assessment of drugs incorporates the variation of drugs’ inhibition effects characterized by IC50s and Hill’s coefficients into the simulation. Another possible approach for incorporating “variations” is imposing the inter-individual variability of the population on cell models that might occur due to mutations and changes in metabolic status. Among the early studies on applying the inter-individual variability to computational cardiac cells was a study by Sobie [10]. The author utilized the log-normal distribution to vary the ion channels’ conductance for parameter sensitivity analysis of cardiac cell models. Furthermore, some studies utilized the inter-individual variability of ion channels’ conductance on the control population during drug assessment [8,9]. The authors found that the optimized control population using healthy action potential criteria helps improve the overall drug assessment by increasing TdP prediction accuracy and reducing computational cost (by lowering the number of models in the population).
Another important aspect of in-silico TdP assessment that many still need to be considered is the metabolic status. Some studies reported that there was a positive correlation between cumulative metabolic problems and atrial fibrillation [11,12]. The corresponding metabolic burden included glucose intolerance, low level of high-density lipoprotein cholesterol, high level of triglyceride, obesity, and hypertension [13,14]. In addition, a study by Remme CA [15] reported several disorders in metabolic status, such as mitochondrial dysfunction, oxidative stress, and intracellular ionic dysregulation as well as the alteration in ion channel function in patients with diabetes and obesity could affect the increased risk for arrhythmias and sudden cardiac death. Moreover, the single nucleotide polymorphism in gene coding like KCNQ1 was found to be the basis for mild dysfunction of slow rectifier current IKs as reported by Kubota et al. [16]. However, a sensitivity analysis reported by Parikh et al. [17] showed that the IKs did not contribute significantly to altering the qNet as the TdP metric score.
Another parameter of metabolic status that is well-known to affect cardiac cell performance is spermine. Spermine was found to regulate the IK1 current, which plays a vital role during the repolarization process [18,19]. Moreover, a study from [20] incorporated the variation of the conductance of L-type calcium and the spermine concentration within the in-silico drug assessment utilizing the cell model proposed by Fink et al. [21]. The authors found that the inter-individual variability of calcium channel and spermine concentration could help induce the EAD when cells were given drugs that yield 90% inhibition on IKr current. Also, the EADs were found in cardiac cells under spermine variation and drugs such as dofetilide, thioridazine, quinidine, and verapamil. However, the authors mainly considered the drug effects on particular drug concentrations and a limited number of drugs tested during the simulation. Since the CiPA paradigm has gradually evolved, drug effects on virtual populations with inter-individual variability on ion channels and metabolic status could be considered during in-silico assessment.
In this study, the effects of inter-individual variability of ion channel and a parameter of metabolic status were further elaborated. We conducted the CiPA-based in-silico assessment of TdP risk of drugs by considering the variation of L-type calcium channel and spermine concentration. The qNet is utilized as TdP metric for assessing the risk of drugs in three categories: low-, intermediate-, and high-risk.
METHODS
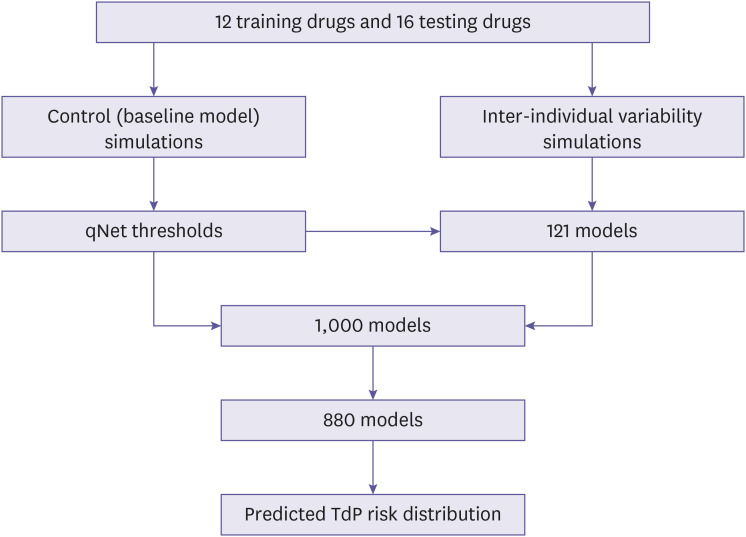
This section reviewed the cell model utilized in the simulation, the implementation of inter-individual variability of spermine and permeability of calcium channels as well as the drug's inhibition effects on the cardiac cell model was also described. Finally, this section also described biomarker features and simulation protocol for assessing the drug effects on the models as show in the Fig. 1.
Figure 1.
The overall procedure for obtaining the predictions of TdP risk distribution under the effect of inter-individual variability. First, the simulations of drugs’ effects on the baseline models were utilized to generate the qNet thresholds. Second, the inter-individual variability simulations on 11×11 variations of spermine and L-type calcium permeability revealed the qNet map showing the distribution of TdP risk of drugs. Then the qNet thresholds would be used to separate three TdP regions on each qNet map. Furthermore, the 1,000 models were generated by varying the spermine and L-type calcium channels’ permeability using the log-normal distribution. The 1,000 models were filtered to fit the region of qNet map to obtain 880 models. From the 880 models, the corresponding qNet values were interpolated from the qNet map and the predicted distribution of TdP risk under inter-individual variability could be obtained as shown in Fig. 7.
TdP, torsade de pointes.
Model of cardiac cell and drug’s effects
The common cardiac cell model used for CiPA-based drug toxicity assessment, known as the CiPAORdv1.0 model, was proposed by Dutta et al. [6] and Li et al. [7]. However, this model does not account for the effects of spermine on cardiac cells and is therefore excluded from the analysis. Instead, the cell model utilized in this study is based on the human ventricular cell model proposed by ten Tusscher et al. [22,23], which was later modified by Fink et al. [21] to incorporate the effects of spermine. The general formula of the cell model is as follows:
where the Vm denotes the membrane potential, Cm was the membrane capacitance, Istim denotes the stimulus current, and Iion denotes the summation of ionic transmembrane currents. The ionic currents incorporated in the model were the fast sodium current (INa), L-type calcium current (ICaL), transient outward current (Ito), slow delayed rectifier current (IKs), rapid delayed rectifier current (IKr), inward rectifier current (IK1), sodium-calcium exchanger current (INaCa), sodium-potassium pump current (INaK), plateau currents (IpCa & IpK), and background currents (IbNa & IbCa). Furthermore, Fink et al. [21] modified the IK1 by incorporating the effects of spermine. The authors also changed the formulation of IKr to include the effects of magnesium on the model. The complete formula for IK1 and IKr is available in the Supplementary Data 1 and in [21].
The drug’s effect was modeled as conductance inhibition based on the Hill equation [4] as proposed by Mirams et al. [3]:
where gi denotes the conductance of ion channel i under drug’s effect, gcontrol,i was the maximum value of conductance of ion channel i, [D] was the drug concentration, and [IC50] was the drug concentration resulting in a 50% blocking effect. This study assumed that several ion channels (Na, Kr, Ks, K1, to, and CaL) would be affected by the drug and the Hill’s coefficient equal to one (h=1) for all drugs and all ion channels affected by drugs [3].
Virtual population of models
Two calculation steps were taken to estimate the actual distribution of spermine and L-type calcium channels’ permeability when implementing inter-individual variability variations. The first step was generating the grid by applying 11 variation values for both spermine and calcium permeability. The inter-individual variability of spermine was implemented by varying its value from 1×10⁻³ mM to 5×10⁻³ mM (including the control value of spermine of 1.4×10⁻³ mM) as shown in [20]. Moreover, the permeability of calcium channels was also altered, ranging from -30% to +30% from its control value of 2.0×10⁻⁵ L/(F.ms) as studied by Romero et al. [24], resulting in the range of calcium permeability from 1.4×10⁻⁵ L/(F.ms) to 2.5×10⁻⁵ L/(F.ms). The 121 models generated from the variation of spermine and calcium channel’s permeability were the basis for predicting the region of TdP risk of drugs based on each individual's biomarker (qNet) value. A detailed description of the qNet calculations is provided in the next subsection.
Furthermore, the second step was generating the virtual population of models following the proposed method by Sobie [10] using log-normal distribution. The log-normal variable is expressed as follows:
| X=eZ |
where X is the log-normal variable with mean and standard deviation of μX and σX, and Z is the standard normal variable with mean and standard deviation of μ and σ. The relation between the mean and standard deviation of log-normal and standard-normal variables can be expressed as follows:
The coefficient of variance σv=σX/μX was set to 0.2 and the μX was set to 1. To generate variations of spermine and calcium permeability, the resulting log-normal distribution (X) was multiplied by the desired mean of variables. For spermine variations, the target mean value was 3×10⁻³ mM following the report from [20]. Moreover, the target mean value of calcium permeability was 2.0××10-5 L/(F.ms) (the default value from [21]).
At first, 1,000 individuals were generated by varying the spermine and L-type calcium channel’s permeability. Then the individuals were selected only within the region of interest, following the region generated by 11×11 spermine and calcium permeability variations, resulting in 880 models of individuals as shown in Supplementary Data 1.
Biomarkers and simulation protocol
qNet was used as a TdP metric to evaluate the effects of inter-individual variability on drug assessment. qNet was the total charge accumulated during an AP by several ion channels (ICaL, IKr, IKs, IK1, and Ito), similar to the one proposed by Dutta et al. [6] except no late sodium current was included as it was not considered in the cardiac cell model proposed by Fink et al. [21]. To obtain the qNet, a selection procedure was applied to obtain the most drug-affected AP, as proposed by Chang et al. [5]. At the first 1,000 beats, the cell was simulated without drug effects to obtain the steady condition of AP. After that, the drug effects were induced during the successive 1,000 beats. The cycle length of the AP was set to 2,000 ms. Within the last 250 beats under drug effects, the AP with the highest value of membrane potential gradient during repolarization () was selected. The maximum calculation started when AP repolarized between 30% and 90% for the completely repolarized AP. If the repolarization could reach 30% but not 90%, the maximum could be searched from 30% repolarization to the end of one cycle. If the AP could not repolarize by 30%, the maximum was calculated from the peak of AP to the end of one cycle.
Furthermore, to incorporate the drug effects into the cell model, 28 drugs were selected as recently studied by Li et al. [25]. The drug dataset was obtained from dose-response experimental data of 28 drugs. Table 1 shows the maximum drug concentration in blood (cmax) values and TdP risk labels of 28 drugs employed in this study. The values of IC50 of drugs for multiple channels were obtained from non-linear fitting (optimal sample) of dose-response data and sampled by using the Markov chain Monte Carlo (MCMC) method to obtain 2,000 samples for each drug as proposed by Chang et al. [5]. The drug dose-response data and code for generating optimum and 2,000 pairs of IC50 and Hill’s coefficient is available at https://github.com/FDA/CiPA/.
Table 1. The 28 drugs and its torsade de pointes risk label and cmax value.
| Proarrhythmic risk level | Training drugs | Testing drugs | ||
|---|---|---|---|---|
| Drug name | Cmax (nM) | Drug name | Cmax (nM) | |
| High-risk | Quinidine | 3,237 | Disopyramide | 742 |
| Sotalol | 14,690 | Ibutilide | 100 | |
| Dofetilide | 2 | Vandetanib | 255 | |
| Bepridil | 33 | Azimilide | 70 | |
| Intermediate-risk | Cisapride | 2.6 | Clarithromycin | 1,206 |
| Terfenadine | 4 | Clozapine | 71 | |
| Chlorpromazine | 38 | Pimozide | 0.43 | |
| Ondansetron | 139 | Astemizole | 0.26 | |
| Domperidone | 19 | |||
| Droperidol | 6.3 | |||
| Risperidone | 1.81 | |||
| Low-risk | Verapamil | 81 | Metoprolol | 1,800 |
| Ranolazine | 1,948.20 | Nifedipine | 7.7 | |
| Diltiazem | 122 | Loratadine | 0.45 | |
| Mexiletine | 4,129 | Nitrendipine | 3.02 | |
| Tamoxifen | 21 | |||
In this study, as depicted in Fig. 1, there were several steps of simulation to examine the effects of inter-individual variability of spermine and L-type calcium channel permeability under drug influence. The first step was to obtain qNet thresholds and their prior accuracy. The 2,000 drug samples from each of the 12 training drugs (in Table 1) were simulated to cardiac cells without inter-individual variability (baseline model), and the qNet was calculated for each drug sample. Each drug sample was simulated with drug concentrations of 1, 2, 3, and 4×cmax, the same as those reported by Chang et al. [5] that drug concentrations of 1 to 4×cmax had the lowest prediction error in classifying TdP risk of drugs. The cmax values for 12 drugs can be seen in training drugs in Table 1. The qNet values were then averaged across the four concentrations. The analysis was limited to 1 to 4×cmax mainly due to lack of drug inhibition experimental data for higher concentration than 4× cmax [5]. The ordinal logistic regression was applied to obtain qNet threshold values to classify the drugs based on their TdP label. The qNet threshold1 classified low-risk and high/intermediate-risk drugs, whereas threshold2 identified high-risk and intermediate/low-risk drugs [25]. To illustrate the predictive capability of threshold1 and threshold2, we assessed their accuracy in classifying drugs for the control population (without inter-individual variability) by using 10,000 iterations of testing as proposed by Jeong et al. [26]. The results are available in the Supplementary Data 1.
Once the qNet thresholds were calculated from the control population, the effects of inter-individual variability of spermine and calcium permeability on the TdP risk assessment were simulated. Initially, the 121 pairs of spermine and calcium permeability variations were applied to the cell model and 1,000 beats of drug-free conditions were simulated. Then, the successive 1,000 beats were calculated under drug effects for multiple concentrations of 1, 2, 3, and 4×cmax. The drugs used for this simulation were 28 drugs, as shown in training and testing drugs in Table 1. After that, the averaged qNet values were obtained and classified based on the qNet threshold1 and threshold2 previously obtained in the control simulation. Finally, the averaged qNet values of 880 individuals to estimate the actual distribution of TdP risk of drugs for the populations were obtained by interpolating the qNet values from 121 spermine and calcium channels’ permeability variations.
RESULTS
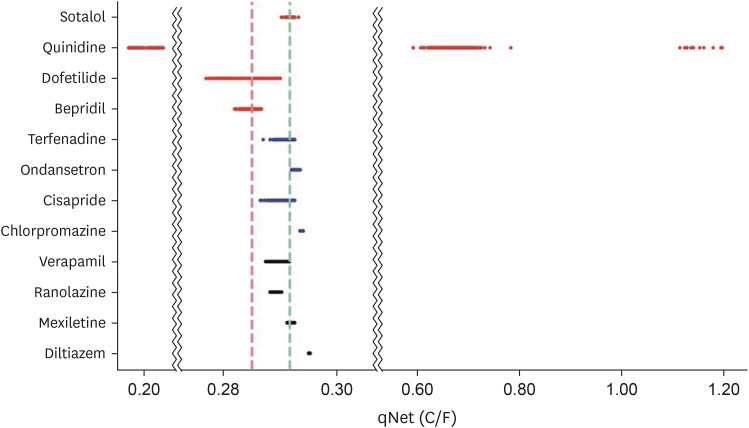
The values of qNet thresholds are shown in Table 2, whereas the distribution of the averaged qNet values for 12 drugs could be seen in Fig. 2. In Fig. 2, some drugs have qNet values that did not always comply with predetermined thresholds. For example, although dofetilide and bepridil were high-risk drugs, some samples were classified into the intermediate-risk drug group. Also, some samples of quinidine were classified into high-risk, and others were low-risk drug group. Sotalol in the high-risk drug group was classified into intermediate-risk and low-risk drug groups. For the intermediate-risk drug group, most terfenadine and ondansetron drug samples were classified as intermediate-risk, but some were classified as low-risk drugs. In contrast, ondansetron and chlorpromazine were categorized as low-risk drugs. Only diltiazem had all samples categorized as low-risk drugs in the low-risk drug group. All samples of ranolazine and most samples of verapamil were classified as intermediate-risk. Finally, some samples of mexiletine were categorized as intermediate-risk drugs.
Table 2. Thresholds for classifying torsade de pointes risk of drugs.
| Feature | Threshold 1 | Threshold 2 |
|---|---|---|
| qNet (C/F) | 0.291759 | 0.285049 |
Figure 2.
Distribution of qNet values for drugs of training drugs. The red horizontal line represents qNet value distribution of high-risk drug group, the blue horizontal line represents qNet value distribution of intermediate-risk drug group, and the black horizontal line represents qNet value distribution of low-risk drug group. The cyan vertical line shows threshold1, and the red vertical line shows threshold2.
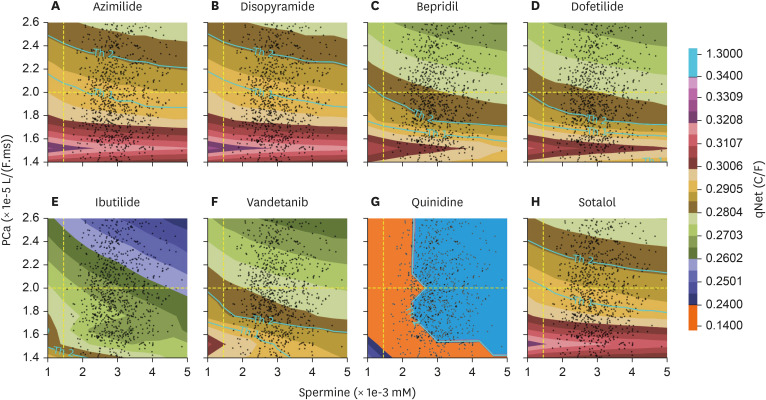
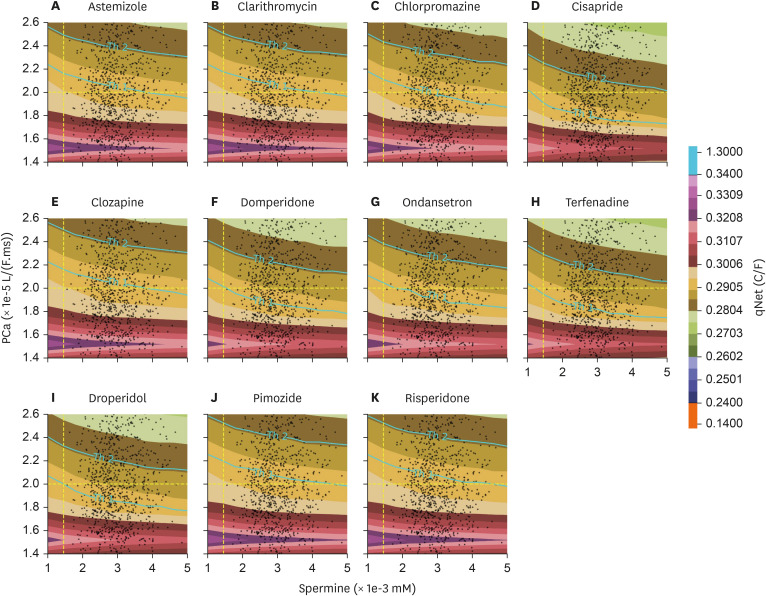
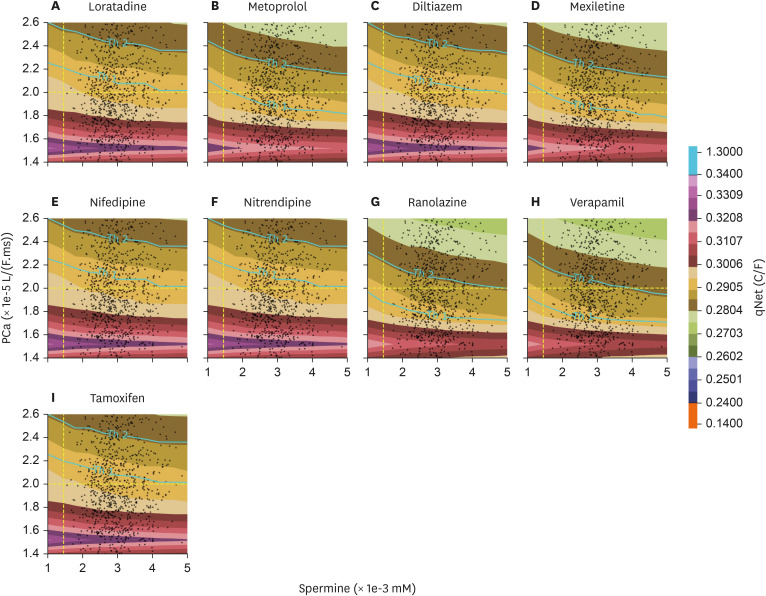
The distribution of qNet for all drugs under inter-individual variation of spermine and permeability of L-type calcium channel was shown in qNet maps. qNet maps for high-risk, intermediate-risk, and low-risk drugs were shown in Figs. 3, 4, and 5, respectively. Overall, the line Th1-line and Th2-line were primarily horizontal, indicating that the variation of calcium permeability has a stronger effect than spermine in determining the qNet values that affect the TdP risk of drugs. Individuals with low calcium permeability of around 1.52 L/(F.ms) consider most drugs low-risk. However, the quinidine in the high-risk drugs group of Fig. 3 showed a quite distinct map where Th1-line and Th2-lines were very close, and there were vertical lines that separate a relatively huge gap in qNet values (between 0.14 C/F and 1.35 C/F). In addition, the map for ibutilide showed that the TdP risk for almost all individuals was high.
Figure 3.
qNet map with the inter-individual variability applied for high-risk drugs group; y-axis represents the variation of permeability of L-type calcium ion channel, and x-axis shows the variation of spermine concentration in the individuals. The yellow-dashed line on x- and y-axis represent the default value of spermine concentration and calcium permeability from [21]. The colour represents the qNet value. The Th1-line shows the threshold1 value, and the Th2-line shows the threshold2 value.
Figure 4.
qNet distribution with the inter-individual variability applied for intermediate-risk drugs group.
Figure 5.
qNet distribution with the inter-individual variability applied for the low-risk drugs group.
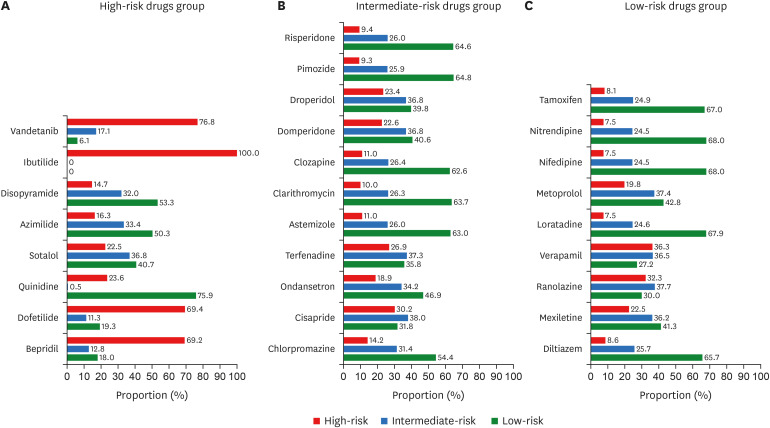
The distribution of the predicted effects for high-risk, intermediate-risk, and low-risk drug groups was shown in Fig. 6. As depicted in panel A of Fig. 6, for some individuals quinidine (75.9%), disopyramide (53.3%), sotalol (40.7%), and azimilide (50.3%) were considered low-risk. In contrast, other drugs such as bepridil, dofetilide, ibutilide, and vandetanib were mainly considered as high-risk drugs (for more than 50% of simulated individuals). In addition, quinidine became the only drug individuals recognized as either low-risk or high-risk (only 0.5% of the population recognize quinidine as an intermediate-risk drug). Furthermore, the distribution for intermediate-risk drugs in panel B of Fig. 6 showed that less than 38% of individuals considered all drugs intermediate-risk. Some drugs were mostly regarded as low-risk drugs by individuals (indicated by a percentage equal to or more than 50%), such as astemizole, chlorpromazine, clarithromycin, clozapine, pimozide, and risperidone. Individuals recognized other drugs such as cisapride, domperidone, droperidol, ondansetron, and terfenadine as high-risk drugs (30% or higher). Moreover, the distribution of low-risk drugs in panel C of Fig. 6 showed that some of the drugs were considered low-risk drugs on individuals (50% or more), such as diltiazem, loratadine, nifedipine, nitrendipine, and tamoxifen. Other drugs, such as metoprolol and mexiletine, affected as low-risk drugs for around 40% of individuals. On the contrary, slightly more individuals recognized ranolazine and verapamil as high-risk drugs than low-risk drugs.
Figure 6.
Distribution of TdP risk prediction among individuals under high-risk drugs group (panel A), intermediate-risk group (panel B), and low-risk group (panel C). The colour represents the predicted TdP risk, i.e. red for high-risk, blue for intermediate risk, and green for low-risk.
TdP, torsade de pointes.
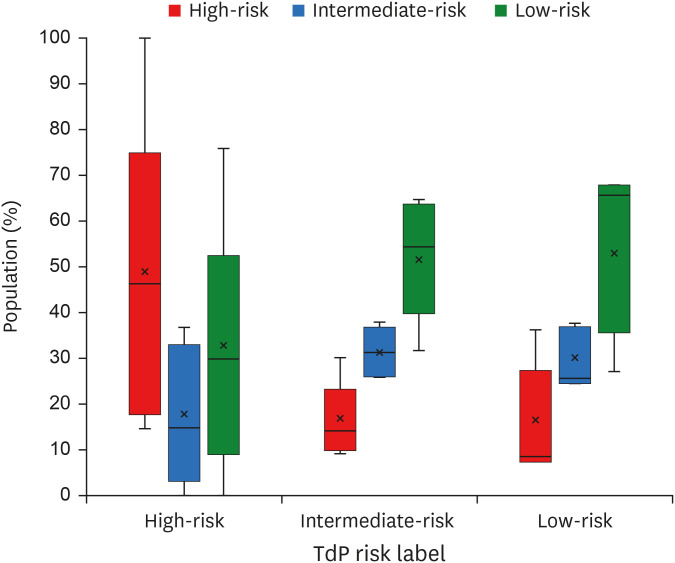
The overall results of inter-individual variability on the TdP risk of drugs were shown in Fig. 7. Within all TdP groups, the intermediate and low-risk groups show quite similar distribution where drugs affecting as high and intermediate-risk shared a similar portion of the individuals. In contrast, the drugs affecting as high-risk within the high-risk group showed a considerably more significant portion of population compared to their intermediate and low-risk counterparts. Within the high-risk group, the average percentage that a drug was affecting as high, intermediate, and low-risk drug was 54%, 15%, and 31%, respectively; the average percentage for the intermediate-risk group was 27%, 26%, and 47%; the low-risk group also had a similar average percentage of 27%, 24%, and 49% for a drug to affect as high, intermediate, and low-risk, respectively.
Figure 7.
Summary of TdP risk prediction with the inter-individual variability. The y-axis represents the share of the population (in percentage) on the particular predicted TdP class, the x-axis represents the initial TdP label of the drug, and the colour represents the predicted TdP class (red for high risk, blue for intermediate risk, and green for low risk). In a single-box plot, the lower, middle, and upper lines of the box represent the first quartile, median, and third quartile, respectively; the cross-line represents the average value; the circles represent outliers; the lower and upper lines outside the box represent the minimum and maximum values excluding the outliers. Note that the share of the population within predicted TdP risk is obtained by considering all drugs (28 drugs) from the same initial TdP label.
TdP, torsade de pointes.
DISCUSSION
In this study, we demonstrated the effects of inter-individual variability of spermine and permeability of L-type calcium channel in altering TdP risk of drugs. The averaged qNet over 1, 2, 3, and 4×cmax was used to classify the compounds’ TdP risk. The qNet distribution for the control population (without inter-individual variability) shown in Fig. 2 illustrated that some samples of drugs yielded qNet values within the incorrectly classified region. The misclassified values in qNet distribution might lead to an inaccurate prediction of TdP risk of drugs by the qNet thresholds. For example, in Supplementary Table 1, the accuracy of the qNet thresholds (from Table 2) under the 10,000 testing method was around 0.68, smaller than the one obtained by Jeong et al. [26] at around 0.7. In addition, the TdP risk prediction using baseline model (calcium permeability of 2.0×10⁻⁵ L/(F.ms) and spermine concentration of 1.4×10⁻³ mM), as shown in Table 3, depicts that some discrepancies of TdP risk labels for drugs are also occurred. We argue that these differences, including some incorrectly classified qNet values from drug samples, might rise because the different cardiac cell models utilized in the simulation, i.e. [26] used a ToR-ORD model of cardiac cell [27] whereas the model from [21] was utilized in this study. However, despite the differences in classification performance and TdP risk predictions, data on the variation of metabolites such as spermine were not available in the ToR-ORD model or other well-known models for drug evaluations, such as those from references [6,7,28]. This absence makes it challenging to evaluate the effect of metabolite status on TdP risk. Nevertheless, our findings, as shown in Fig. 3 to Fig. 7, reveal that the TdP risk associated with drugs can clearly differ among individuals with varying spermine concentrations and calcium channel permeabilities.
Table 3. Predicted risk of drugs applied to base-line model of cardiac cell.
| Risk label | Drug name | Predicted risk |
|---|---|---|
| High | Azimilide | Low |
| Disopyramide | Low | |
| Bepridil | High | |
| Dofetilide | High | |
| Ibutilide | High | |
| Vandetanib | High | |
| Quinidine | High | |
| Sotalol | Low | |
| Intermediate | Astemizole | Low |
| Clarithromycin | Low | |
| Chlorpromazine | Low | |
| Cisapride | Intermediate | |
| Clozapine | Low | |
| Domperidone | Low | |
| Ondansetron | Intermediate | |
| Terfenadine | Intermediate | |
| Droperidol | Intermediate | |
| Pimozide | Low | |
| Risperidone | Low | |
| Low | Loratadine | Low |
| Metoprolol | Low | |
| Diltiazem | Low | |
| Mexiletine | Low | |
| Nifedipine | Low | |
| Nitrendipine | Low | |
| Ranolazine | Intermediate | |
| Verapamil | Intermediate | |
| Tamoxifen | Low |
Furthermore, in contrast to Fig. 2, which showed the distribution of qNet values under various drug samples applied to the baseline model of cardiac cells, Figs. 3, 4, and 5 showed that spermine and L-type calcium channel permeability could affect drug’s TdP risk. For example, TdP risk for bepridil was high under the baseline model. However, when spermine and CaL permeability vary, as demonstrated in Figs. 3 and 6 (panel A), bepridil’s TdP risk might be low (18%), intermediate (12.8%), or high (69.2%). Table 3 showed the baseline model’s predicted TdP risk for every drug. Furthermore, as reported in a study by Le Guennec et al. [20], the high values of calcium permeability and spermine concentration in the cardiac cell may produce EAD (Fig. 6 of Le Guennec et al. paper [20]). EAD might also be connected to TdP risk [8], and the lower value of qNet may also be highly associated with high TdP risk [5,6,7,25]. Therefore, the findings from [20] were comparable with ours in the sense that the lower value of qNet (greater TdP risk) was indicated when calcium permeability and spermine concentration were relatively high, as seen in Figs. 3, 4, and 5.
Most individuals with low L-type calcium channel permeability value considered drugs as low risk, as shown in, Figs. 4 and 5. Our finding was consistent with a study from [17] that L-type calcium affected the qNet and the drug classification performance, especially for low-intermediate risk drugs. Furthermore, the spermine’s effect on cardiac cells was strongly associated with the alteration of IK1 current [18,19] that showed a less significant effect compared to L-type calcium channel when regulating the qNet [17]. Results from Figs. 3, 4, and 5 showed that most contour lines were horizontal, indicating a consistent result compared to previous studies that the variation of L-type calcium channel influences more than the disparity of spermine to qNet (thus the TdP risk of drugs). In addition, results from the linear regression analysis, as shown in Supplementary Figs. 2-5 in the Supplementary Data 1, support a similar conclusion: variations in L-type calcium channels significantly affect changes in qNet more than spermine does. Moreover, variations in calcium permeability generally reveal a clearer separation between risks, as illustrated in panel A of Supplementary Figs. 6-33, which aligns with the results shown in Figs. 3, 4, and 5 where the threshold lines are almost horizontal. Our findings indicate that patients with mutations in the calcium channel, such as loss-of-function mutations [29,30,31], may require careful consideration when prescribed medications, as the TdP risk associated with drugs could be significantly altered.
Furthermore, the TdP risk predictions under varied spermine values show overlapping regions between three TdP risk classes (panel B of Supplementary Figs. 6-33). The overlapping regions could indicate that the variation in spermine concentrations from 1×10⁻³mM to 5×10⁻³mM may not clearly separate the TdP risk classes in a virtual population. A study from [32] reported possible ranges of spermine in a control population (individuals who exclude polyamine-rich food from their diet) of 6.7×10⁻³mM±3.2×10⁻³mM (range=3.4×10⁻³mM-12.8×10⁻³mM), suggesting potential changes in TdP risk distribution. However, the statistical tests in Supplementary Fig. 2 of the Supplementary Data 1, along with the nearly horizontal threshold lines in Figs. 3, 4, and 5, indicate that increases in spermine concentrations may not significantly affect the TdP risk distribution. Therefore, the limited ranges of spermine concentration presented in this study remain relevant.
Although some promising findings are shown in this study, some limitations might require further analysis. First, the variations in the permeability of the calcium channel deployed in the simulations were not derived from clinical data such as variations in spermine concentrations. Therefore, experimental validations could be required. Since there is no consensus on the exact variation of L-type calcium channels, one may incorporate other inter-individual variability mechanisms [8,9,10] to more realistically depict the L-type calcium channel variation within the population. Additionally, the cardiac cell model used in this study differs from the standard model commonly used for assessing TdP risk levels derived from the CiPA initiative, typically employing cell models from [27,28] which might alter the predictive performance of the whole simulation protocol. Considering the metabolic status in conjunction with the well-known cell model might be necessary for a more accurate drug toxicity evaluation and to enable a more realistic population analysis. Furthermore, changes of spermine ranges implemented in the virtual population could affect the TdP risk prediction of the baseline model when the baseline model is defined with different target of mean value of spermine concentrations using the data from [32], and combined with the calibrated baseline model, i. e., utilizing the mean value of spermine from virtual population instead of from original value from Fink et al. [21] model as the baseline parameters, could yield possible improvement of overall TdP risk prediction.
Footnotes
Funding: This research is partially supported by the Ministry of Food and Drug Safety (22213MFDS3922), the NRF (National Research Foundation of Korea) under the Basic Science Research Program (2022R1A2C2006326), and the MSIT (Ministry of Science and ICT), Korea, under the Grand Information Technology Research Center support program (IITP-2022-2020-0-01612) supervised by the IITP (Institute for Information & communications Technology Planning & Evaluation).
Reviewer: This article was reviewed by peer experts who are not TCP editors.
Conflict of Interest: - Authors: Author KL was employed by Meta Heart Co Ltd.
- Reviewers: Nothing to declare
- Editors: Nothing to declare
- Conceptualization: Qauli AI.
- Data curation: Danadibrata RZ.
- Formal analysis: Qauli AI, Danadibrata RZ.
- Investigation: Qauli AI.
- Methodology: Lim KM.
- Software: Marcellinus A.
- Supervision: Lim KM.
- Validation: Qauli AI.
- Visualization: Qauli AI.
- Writing - original draft: Qauli AI, Danadibrata RZ.
- Writing - review & editing: Qauli AI, Marcellinus A, Lim KM.
SUPPLEMENTARY MATERIAL
Supplementary Material.
References
- 1.Gintant GA. Preclinical torsades-de-pointes screens: advantages and limitations of surrogate and direct approaches in evaluating proarrhythmic risk. Pharmacol Ther. 2008;119:199–209. doi: 10.1016/j.pharmthera.2008.04.010. [DOI] [PubMed] [Google Scholar]
- 2.Sager PT, Gintant G, Turner JR, Pettit S, Stockbridge N. Rechanneling the cardiac proarrhythmia safety paradigm: a meeting report from the Cardiac Safety Research Consortium. Am Heart J. 2014;167:292–300. doi: 10.1016/j.ahj.2013.11.004. [DOI] [PubMed] [Google Scholar]
- 3.Mirams GR, Cui Y, Sher A, Fink M, Cooper J, Heath BM, et al. Simulation of multiple ion channel block provides improved early prediction of compounds’ clinical torsadogenic risk. Cardiovasc Res. 2011;91:53–61. doi: 10.1093/cvr/cvr044. [DOI] [PMC free article] [PubMed] [Google Scholar]
- 4.Hill AV. The possible effects of the aggregation of the molecules of hæmoglobin on its dissociation curves. J Physiol. 1910;40:i–ivii. [Google Scholar]
- 5.Chang KC, Dutta S, Mirams GR, Beattie KA, Sheng J, Tran PN, et al. Uncertainty quantification reveals the importance of data variability and experimental design considerations for in silico proarrhythmia risk assessment. Front Physiol. 2017;8:917. doi: 10.3389/fphys.2017.00917. [DOI] [PMC free article] [PubMed] [Google Scholar]
- 6.Dutta S, Chang KC, Beattie KA, Sheng J, Tran PN, Wu WW, et al. Optimization of an in silico cardiac cell model for proarrhythmia risk assessment. Front Physiol. 2017;8:616. doi: 10.3389/fphys.2017.00616. [DOI] [PMC free article] [PubMed] [Google Scholar]
- 7.Li Z, Dutta S, Sheng J, Tran PN, Wu W, Chang K, et al. Improving the in silico assessment of proarrhythmia risk by combining hERG (Human Ether-à-go-go-Related Gene) channel-drug binding kinetics and multichannel pharmacology. Circ Arrhythm Electrophysiol. 2017;10:e004628. doi: 10.1161/CIRCEP.116.004628. [DOI] [PubMed] [Google Scholar]
- 8.Passini E, Britton OJ, Lu HR, Rohrbacher J, Hermans AN, Gallacher DJ, et al. Human in silico drug trials demonstrate higher accuracy than animal models in predicting clinical pro-arrhythmic cardiotoxicity. Front Physiol. 2017;8:668. doi: 10.3389/fphys.2017.00668. [DOI] [PMC free article] [PubMed] [Google Scholar]
- 9.Passini E, Trovato C, Morissette P, Sannajust F, Bueno-Orovio A, Rodriguez B. Drug-induced shortening of the electromechanical window is an effective biomarker for in silico prediction of clinical risk of arrhythmias. Br J Pharmacol. 2019;176:3819–3833. doi: 10.1111/bph.14786. [DOI] [PMC free article] [PubMed] [Google Scholar]
- 10.Sobie EA. Parameter sensitivity analysis in electrophysiological models using multivariable regression. Biophys J. 2009;96:1264–1274. doi: 10.1016/j.bpj.2008.10.056. [DOI] [PMC free article] [PubMed] [Google Scholar]
- 11.Ahn HJ, Han KD, Choi EK, Jung JH, Kwon S, Lee SR, et al. Cumulative burden of metabolic syndrome and its components on the risk of atrial fibrillation: a nationwide population-based study. Cardiovasc Diabetol. 2021;20:20. doi: 10.1186/s12933-021-01215-8. [DOI] [PMC free article] [PubMed] [Google Scholar]
- 12.Lee SY, Lee SR, Choi EK, Kwon S, Yang S, Park J, et al. Association between change in metabolic syndrome status and risk of incident atrial fibrillation: a nationwide population-based study. J Am Heart Assoc. 2021;10:e020901. doi: 10.1161/JAHA.121.020901. [DOI] [PMC free article] [PubMed] [Google Scholar]
- 13.Expert Panel on Detection, Evaluation, and Treatment of High Blood Cholesterol in Adults. Executive Summary of The Third Report of The National Cholesterol Education Program (NCEP) Expert Panel on Detection, Evaluation, And Treatment of High Blood Cholesterol In Adults (Adult Treatment Panel III) JAMA. 2001;285:2486–2497. doi: 10.1001/jama.285.19.2486. [DOI] [PubMed] [Google Scholar]
- 14.Grundy SM, Cleeman JI, Daniels SR, Donato KA, Eckel RH, Franklin BA, et al. Diagnosis and management of the metabolic syndrome: an American Heart Association/National Heart, Lung, and Blood Institute Scientific Statement. Circulation. 2005;112:2735–2752. doi: 10.1161/CIRCULATIONAHA.105.169404. [DOI] [PubMed] [Google Scholar]
- 15.Remme CA. Sudden cardiac death in diabetes and obesity: mechanisms and therapeutic strategies. Can J Cardiol. 2022;38:418–426. doi: 10.1016/j.cjca.2022.01.001. [DOI] [PubMed] [Google Scholar]
- 16.Kubota T, Horie M, Takano M, Yoshida H, Takenaka K, Watanabe E, et al. Evidence for a single nucleotide polymorphism in the KCNQ1 potassium channel that underlies susceptibility to life-threatening arrhythmias. J Cardiovasc Electrophysiol. 2001;12:1223–1229. doi: 10.1046/j.1540-8167.2001.01223.x. [DOI] [PubMed] [Google Scholar]
- 17.Parikh J, Di Achille P, Kozloski J, Gurev V. Global sensitivity analysis of ventricular myocyte model-derived metrics for proarrhythmic risk assessment. Front Pharmacol. 2019;10:1054. doi: 10.3389/fphar.2019.01054. [DOI] [PMC free article] [PubMed] [Google Scholar]
- 18.Ishihara K, Ehara T. Two modes of polyamine block regulating the cardiac inward rectifier K+ current IK1 as revealed by a study of the Kir2.1 channel expressed in a human cell line. J Physiol. 2004;556:61–78. doi: 10.1113/jphysiol.2003.055434. [DOI] [PMC free article] [PubMed] [Google Scholar]
- 19.Reilly L, Eckhardt LL. Cardiac potassium inward rectifier Kir2: review of structure, regulation, pharmacology, and arrhythmogenesis. Heart Rhythm. 2021;18:1423–1434. doi: 10.1016/j.hrthm.2021.04.008. [DOI] [PMC free article] [PubMed] [Google Scholar]
- 20.Le Guennec JY, Thireau J, Ouillé A, Roussel J, Roy J, Richard S, et al. Inter-individual variability and modeling of electrical activity: a possible new approach to explore cardiac safety? Sci Rep. 2016;6:37948. doi: 10.1038/srep37948. [DOI] [PMC free article] [PubMed] [Google Scholar]
- 21.Fink M, Noble D, Virag L, Varro A, Giles WR. Contributions of HERG K+ current to repolarization of the human ventricular action potential. Prog Biophys Mol Biol. 2008;96:357–376. doi: 10.1016/j.pbiomolbio.2007.07.011. [DOI] [PubMed] [Google Scholar]
- 22.ten Tusscher KH, Noble D, Noble PJ, Panfilov AV. A model for human ventricular tissue. Am J Physiol Heart Circ Physiol. 2004;286:H1573–H1589. doi: 10.1152/ajpheart.00794.2003. [DOI] [PubMed] [Google Scholar]
- 23.ten Tusscher KH, Panfilov AV. Alternans and spiral breakup in a human ventricular tissue model. Am J Physiol Heart Circ Physiol. 2006;291:H1088–H1100. doi: 10.1152/ajpheart.00109.2006. [DOI] [PubMed] [Google Scholar]
- 24.Romero L, Pueyo E, Fink M, Rodríguez B. Impact of ionic current variability on human ventricular cellular electrophysiology. Am J Physiol Heart Circ Physiol. 2009;297:H1436–H1445. doi: 10.1152/ajpheart.00263.2009. [DOI] [PubMed] [Google Scholar]
- 25.Li Z, Ridder BJ, Han X, Wu WW, Sheng J, Tran PN, et al. Assessment of an in silico mechanistic model for proarrhythmia risk prediction under the CiPA initiative. Clin Pharmacol Ther. 2019;105:466–475. doi: 10.1002/cpt.1184. [DOI] [PMC free article] [PubMed] [Google Scholar]
- 26.Jeong DU, Danadibrata RZ, Marcellinus A, Lim KM. Validation of in silico biomarkers for drug screening through ordinal logistic regression. Front Physiol. 2022;13:1009647. doi: 10.3389/fphys.2022.1009647. [DOI] [PMC free article] [PubMed] [Google Scholar]
- 27.Tomek J, Bueno-Orovio A, Passini E, Zhou X, Minchole A, Britton O, et al. Development, calibration, and validation of a novel human ventricular myocyte model in health, disease, and drug block. eLife. 2019;8:e48890. doi: 10.7554/eLife.48890. [DOI] [PMC free article] [PubMed] [Google Scholar]
- 28.O’Hara T, Virág L, Varró A, Rudy Y. Simulation of the undiseased human cardiac ventricular action potential: model formulation and experimental validation. PLOS Comput Biol. 2011;7:e1002061. doi: 10.1371/journal.pcbi.1002061. [DOI] [PMC free article] [PubMed] [Google Scholar]
- 29.Antzelevitch C, Pollevick GD, Cordeiro JM, Casis O, Sanguinetti MC, Aizawa Y, et al. Loss-of-function mutations in the cardiac calcium channel underlie a new clinical entity characterized by ST-segment elevation, short QT intervals, and sudden cardiac death. Circulation. 2007;115:442–449. doi: 10.1161/CIRCULATIONAHA.106.668392. [DOI] [PMC free article] [PubMed] [Google Scholar]
- 30.Burashnikov E, Pfeiffer R, Barajas-Martinez H, Delpón E, Hu D, Desai M, et al. Mutations in the cardiac L-type calcium channel associated with inherited J-wave syndromes and sudden cardiac death. Heart Rhythm. 2010;7:1872–1882. doi: 10.1016/j.hrthm.2010.08.026. [DOI] [PMC free article] [PubMed] [Google Scholar]
- 31.Zhang Q, Chen J, Qin Y, Wang J, Zhou L. Mutations in voltage-gated L-type calcium channel: implications in cardiac arrhythmia. Channels (Austin) 2018;12:201–218. doi: 10.1080/19336950.2018.1499368. [DOI] [PMC free article] [PubMed] [Google Scholar]
- 32.Soda K, Kano Y, Sakuragi M, Takao K, Lefor A, Konishi F, et al. Long-term oral polyamine intake increases blood polyamine concentrations. J Nutr Sci Vitaminol (Tokyo) 2009;55:361–366. doi: 10.3177/jnsv.55.361. [DOI] [PubMed] [Google Scholar]
Associated Data
This section collects any data citations, data availability statements, or supplementary materials included in this article.
Supplementary Materials
Supplementary Material.


