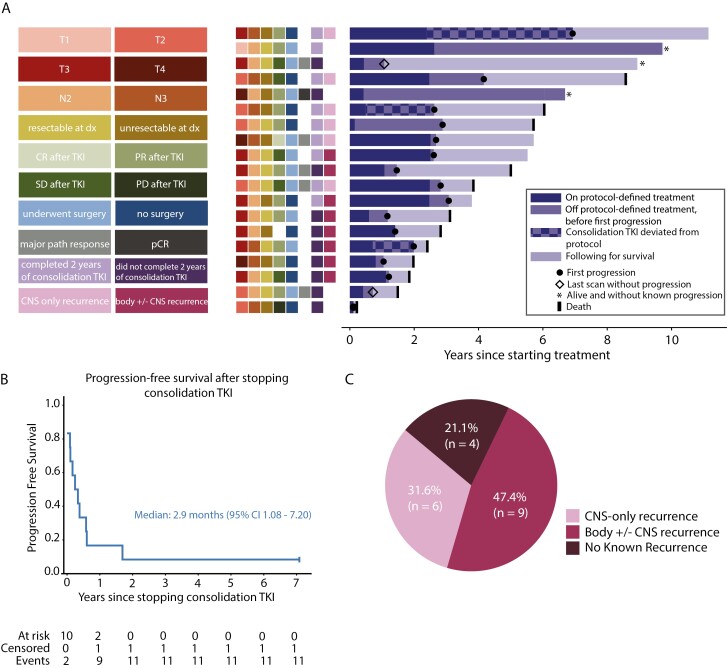
Figure 3.
Patterns of disease progression. (A) Right: the longitudinal course of all 19 patients is depicted by horizontal bars of varying length. Periods of deviation from protocol-defined therapy are noted with a checkered bar; these deviations included continuation of consolidation afatinib beyond the predefined 2-year period or off-protocol consolidation erlotinib. Left: colored boxes denote T-stage, N-stage, resectability at diagnosis, RECIST response category after induction afatinib, surgical disposition, pathologic response at time of surgery (major pathological response is <10% residual tumor cells, pCR is pathological complete response), completion of 2 years of consolidation afatinib, and recurrence isolated to the central nervous system (CNS). (B) Progression-free survival after stopping consolidation afatinib (n = 12, includes only those patients who received consolidation afatinib and no other consolidation TKI off-protocol). (C) Distribution of site of first recurrence (n = 19, ITT group).

