Abstract
Background:
This study utilized computed tomography (CT) to establish normative radiographic morphometric measurements of cervical disc space height (DSH) and interpedicular distance (IPD) and document the influence of patient sex, race, ethnicity, and anthropometric characteristics.
Methods:
Cervical CTs of 1000 patients between 18 and 35 years of age without known spinal pathology were reviewed. Statistical analyses included the assessment of associations between patient height, weight, sex, race, and ethnicity regarding DSH and IPD.
Results:
Irrespective of disc level, average DSH measurements were as follows: anterior height of 2.6 ± 1.0 mm, middle height of 4.1 ± 1.2 mm, and posterior height of 1.8 ± 1.0 mm. IPD was only measured between C3 and C7 vertebrae, and irrespective of disc level, the mean IPD measurement was 21.1 ± 1.5 mm. Significant differences for anterior, middle, posterior DSH, and IPD were observed in all disc levels. Significant differences in DSH and IPD were observed for all anthropometric factors of sex, race, and ethnicity relative to vertebral level. Males had significantly larger DSH and IPD measurements across all vertebral levels compared to females. Caucasians had larger DSH and IPD at select vertebral levels compared to African Americans and Hispanics.
Conclusion:
This study describes measurements of DSH and IPD between C2 and T1 levels in 1000 healthy 18–35-year-old subjects without known pathology. DSH and IPD measurements varied based on patient sex, race, ethnicity, and disc level.
Keywords: Cervical, Computed tomography, Disc space height, Ethnicity, Interpedicular distance

INTRODUCTION
Few studies have investigated measurements of disc space height (DSH) or interpedicular distance (IPD), with previous exploration of DSH focusing significantly on lumbar, rather than cervical, intervertebral disc space.[3] Both DSH and IPD have demonstrated significant usage in the indication of spinal pathology.[6] However, the literature has neither adequately explored the normative values of DSH and IPD nor investigated deviations from the norm as indicators of spinal pathology.
To address these needs, this study aims to build on the foundations laid by Razzouk et al. in determining normative measurements of spinal anatomy. This prior study sought to establish normative measurements of cervical neuroforaminal dimensions (CNFD).[10] Similarly, the purpose of this study was to use computed tomography (CT) of young patients free of spinal pathology to establish normative measurements of DSH and IPD and to investigate the influence of patient sex, race, ethnicity, and anthropometric characteristics.
MATERIALS AND METHODS
Patient selection
Following IRB approval (#5240124), we reviewed CT (GE Discovery 750 HD 64-slice CT scanner) of the cervical spine without contrast or soft neck tissue of 1000 patients between 18 and 35 years of age free of spinal pathology. All CT scans were performed between January 2014 and January 2023. Patient consent was not required due to the nature of this retrospective and radiographic study. Relevant spinal pathology was identified based on previous diagnoses in either the patient’s radiographic or electronic medical records. A total of 4762 subjects were screened, of which 3762 were excluded from the study. Table 1 reports all exclusion criteria and a description of the excluded cohort. Patient weight, height, body mass index (BMI), sex, race, and ethnicity were recorded at the time of imaging. Racial and ethnic data were obtained through the patient’s self-reported answers regarding their racial and ethnic heritage in the electronic medical record. Table 2 reports a description of the included cohort.
Table 1:
Exclusion criteria and excluded cohort.
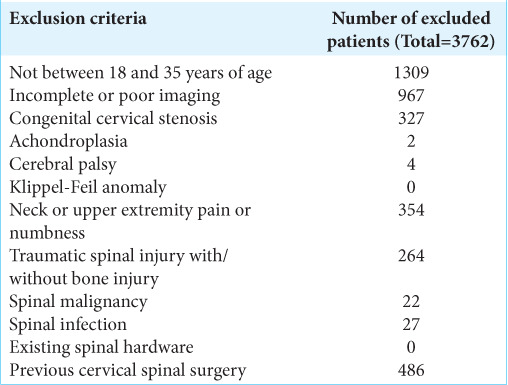
Table 2:
Description of included cohort.

Data collection
Images were reviewed and measured by eight medical students trained by a board-certified neuroradiologist (NW) using the IMPAX6 (Agfa-Gavaert, Mortsel, Belgium) picture archiving and communication system with window and level designations of 2000 Hounsfield Unit (HU) and 500 HU, respectively. DSH and IPD were calculated according to the borders of the vertebral outline using the IMPAX6 tracing freeform tool and were measured in the sagittal and axial views, respectively. Anterior, middle, and posterior DSH were defined as the distances between the respective anterior, middle, and posterior edges of neighboring endplates in millimeters (mm). IPD was defined as the maximum distance between the medial aspects of the pedicles at a given vertebral level. Figure 1 illustrates the measurement technique for disc space height. Figure 2 illustrates the measurement technique for IPD. Interobserver reliability was assessed through the intraclass correlation coefficient (ICC) two-way mixed model on absolute agreement, and the ICC was found to be excellent at 0.792 with a 95% confidence interval of 0.736 to 0.842.[2,5,11]
Figure 1:
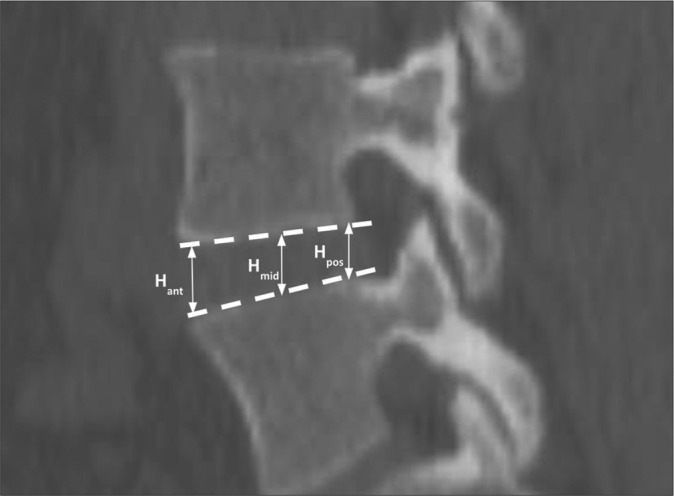
Measurement technique of cervical disc space height. H: Height.
Figure 2:
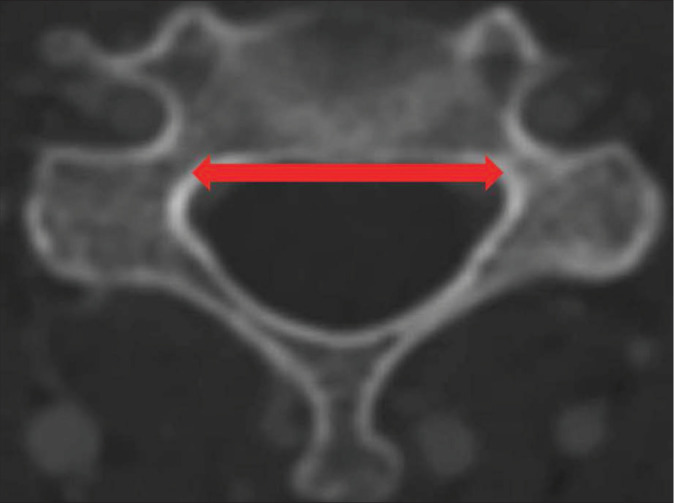
Measurement technique of cervical interpedicular distance. Arrow showcases measurement technique/taken of IPD.
Statistical and power analysis
Data collection and visualization were performed using Microsoft Excel version 16.58 (Microsoft Corporation, 2022, Redmond, WA, USA). SPSS version 28 (IBM Corporation, 2021, Armonk, NY, USA) was utilized for all subsequent statistical analyses with alpha defined as P < 0.05. Kolmogorov–Smirnov tests and Q-Q plots were used to assess data normality, and Levene’s homogeneity of variance test and regression residual plots were used to evaluate homoscedasticity.[8,12,13] Pearson correlation tests were performed to assess associations among radiographic, demographic, and anthropometric variables, with correlation coefficients categorized as weak, moderate, and strong, corresponding to value ranges of 0–0.4, 0.4–0.7, and 0.7–1, respectively.[9] Differences in DSH and IPD based on sex, race, and ethnicity were assessed using a two-way analysis of covariance with anthropometric covariates, estimated marginal means, and type III sum-of-square specification. Measurement differences among disc levels were analyzed using one-way analysis of variance (ANOVA) with post hoc Bonferroni and Tukey corrections.
Non-directional partial correlation power analysis was conducted with a sample size of 1000, specified parameters of 0.05 for an alpha, a null value of zero, a partial correlation parameter of 0.300, and an assumed number of four variables to be partially out. An achieved power of 100% was determined by power analysis. A one-way ANOVA power analysis was conducted with specified parameters of 0.05 for alpha, a standard deviation of 1.0, and sample groups of 357, 245, 144, and 83 (corresponding to the racial and ethnic subgroups of our study) with similar achieved power of 100%.
RESULTS
Disc space height and IPDs
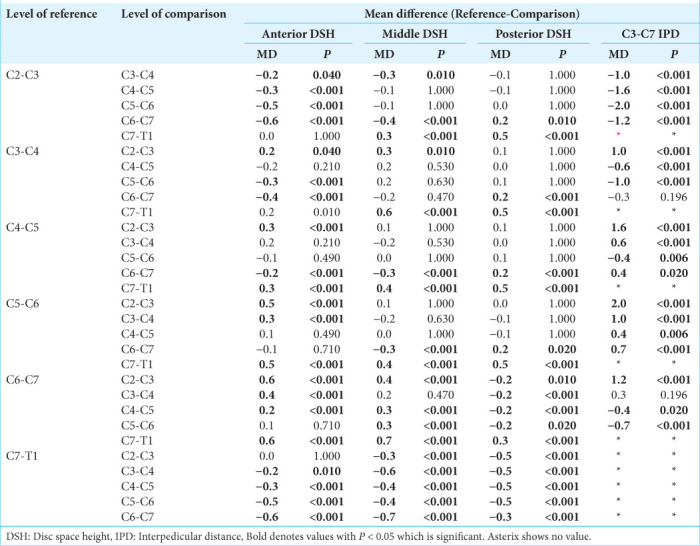
Irrespective of disc level, average DSH measurements were as follows: anterior height of 2.6 ± 1.0 mm, middle height of 4.1 ± 1.2 mm, and posterior height of 1.8 ± 1.0 mm. IPD was only measured between C3 and C7 vertebrae, and irrespective of disc level, the mean IPD measurement was 21.1 ± 1.5 mm. Table 3 displays both mean DSH and IPD measurements per disc level. Significant differences for anterior, middle, and posterior DSH, and IPD were observed in all disc levels. Table 4 reports disc-level dependent comparisons in DSH and IPD measurements.
Table 3:
Mean (SD) cervical DSH and IPD.

Table 4:
Differences in cervical DSH and IPD measurements based on disc level.
Influence of sex, race, and ethnicity
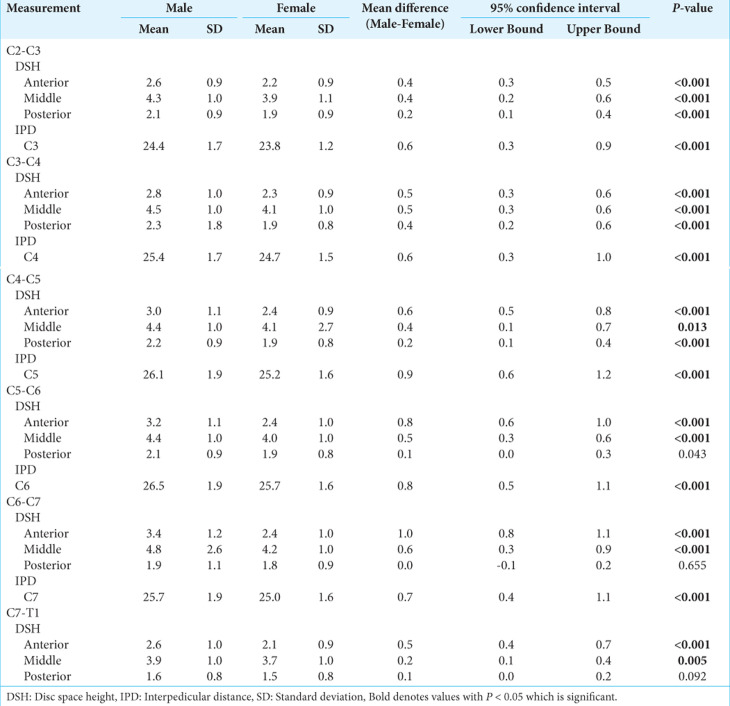
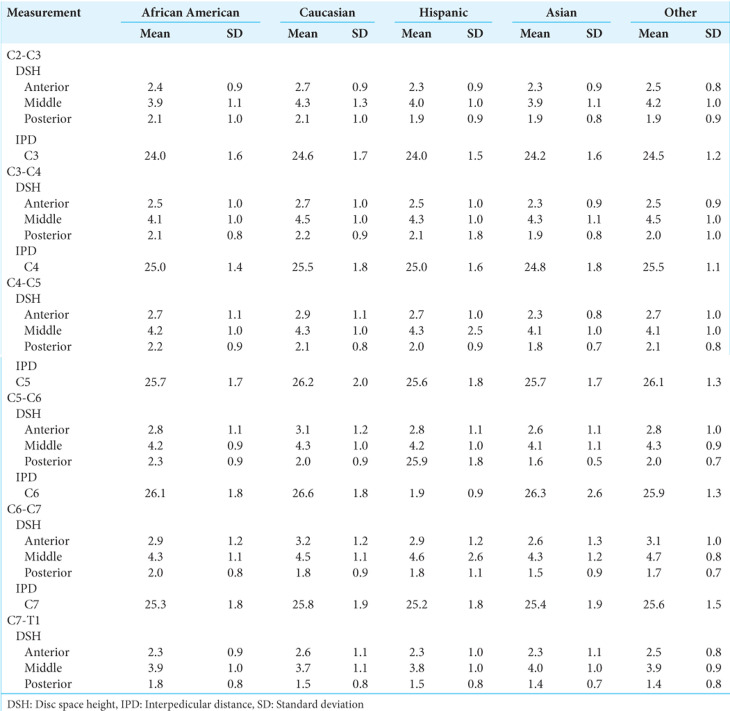
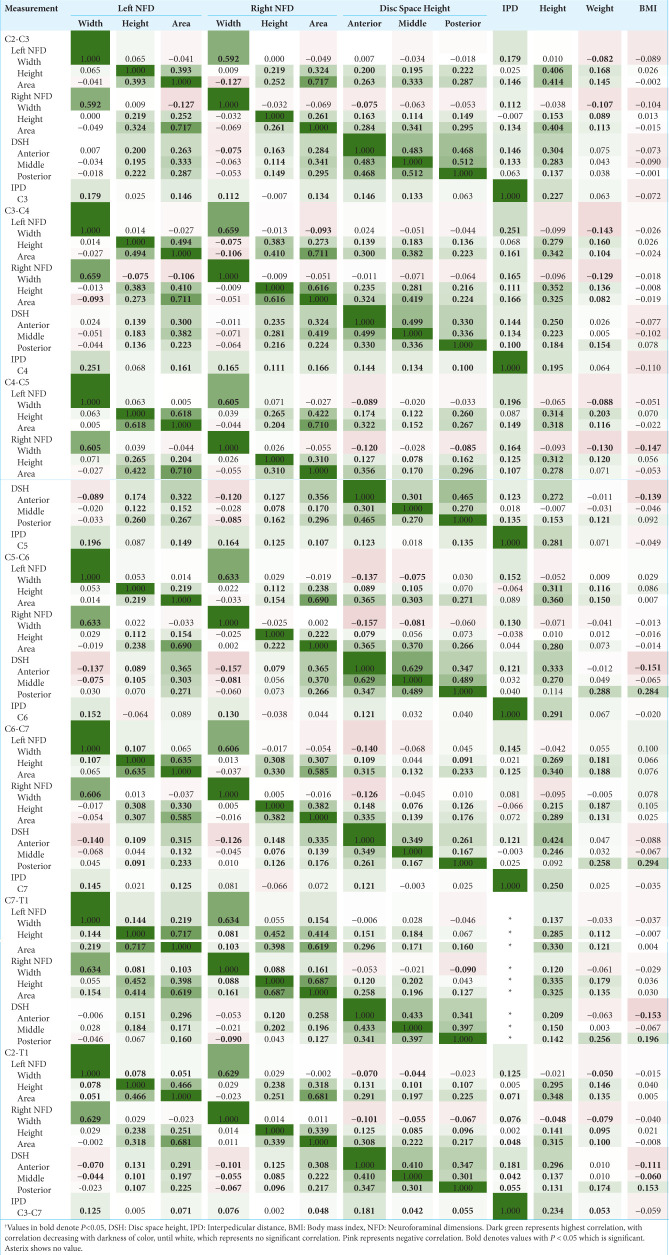
Significant differences in DSH and IPD were observed for all anthropometric factors. Male patients had significantly larger measurements in both DSH and IPD across all vertebral levels compared to female patients. Table 5 reports significant differences in DSH and IPD measurements based on patient sex. Race-based analyses demonstrated statistically significant differences relative to vertebral level. Table 6 reports mean measurements for DSH and IPD based on patient race and ethnicity, and Table 7 reports significant differences between different racial and ethnic groups with respect to DSH and IPD. Table 8 showcases a correlation matrix which failed to appreciate any significant relationships between height, weight, BMI, CNFD, DSH, and IPD.
Table 5:
Differences in DSH and IPD measurements based on patient sex.
Table 6:
Mean DSH and IPD measurements based on patient race and ethnicity.
Table 7:
Mean differences in cervical DSH and IPD measurements among African American, Caucasian, Hispanic, and Asian cohorts.
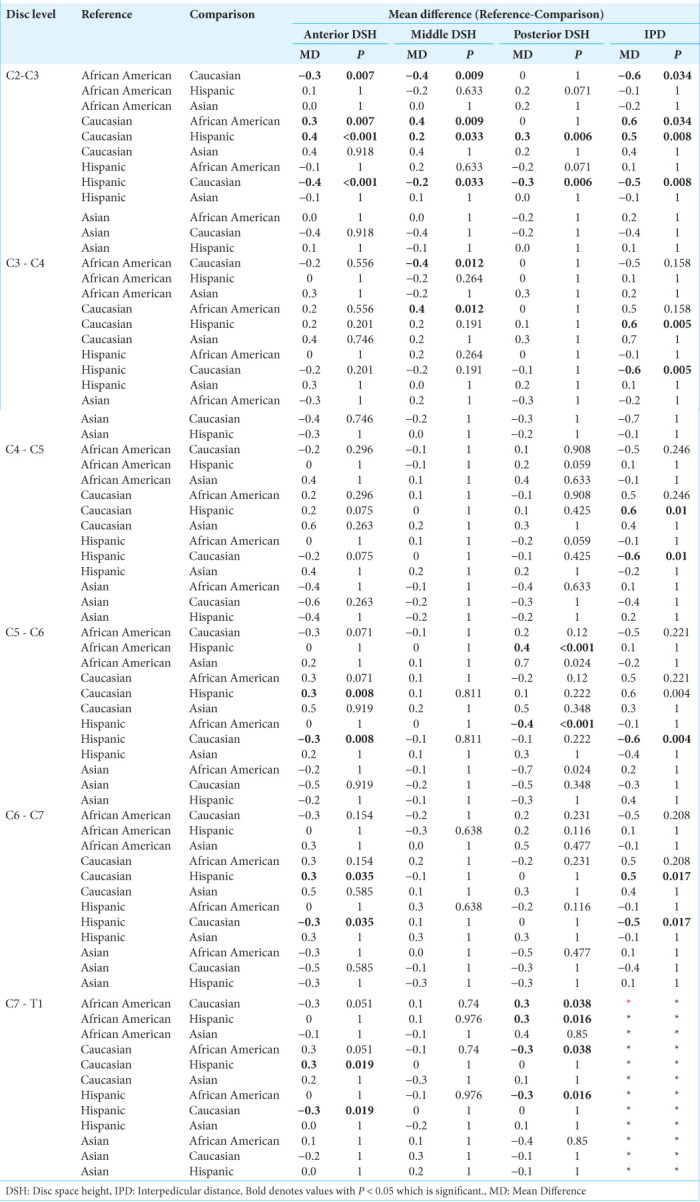
Table 8:
Correlation matrix among patient anthropometric factors and cervical NFD, DSH, and IP D†.
DISCUSSION
This study seeks to provide anatomic standards for understanding cervical DSH and IPD. In contrast to Frobin et al., who indicated an average DSH of 0.35, our study measures DSH in three different locations, yielding an average anterior DSH of 2.6 ± 1.0 mm, middle DSH of 4.1 ± 1.2 mm, posterior DSH of 1.8 ± 1.0 mm, thus increasing the precision of measurement. In addition, our study encapsulates 1000 subjects, greatly expanding on their initial 135-subject sample size.[3] In addition, Razzouk et al. found no sex-based differences in CFND measurements,[10] but we found that males had larger DSH and IPD across all vertebral levels. We also found that Caucasian subjects had larger DSH and IPD at select vertebral levels compared to their African American, Hispanic, and Asian counterparts.
Determining a healthy DSH and IPD is fundamental to defining what constitutes disease and recognizing how changes in postoperative DSH and IPD can impact clinical and radiological outcomes, as seen in patients experiencing nerve root injury or undergoing anterior cervical discectomy and fusion surgery.[1,4] Although Liu et al. sought to investigate ways in which DSH serves as a predictive index for spinal pathology,[7] the lack of normative values has barred the determination of how variability in these measurements relates to the development of disease. Thus, our study provides a baseline series of normative measurements against which future research can compare measurements in various disease processes.
CONCLUSION
This study describes measurements of DSH and IPD between C2 and T1 in 1000 healthy 18–35-year-old subjects. DSH and IPD measurements vary based on patient sex, race, ethnicity, and disc level.
Footnotes
How to cite this article: Shin D, Shin B, Brandt Z, Nguyen K, Battikha A, Carter D, et al. Morphometric analysis of cervical disc space height and interpedicular distance using computed tomography. Surg Neurol Int. 2024;15:196. doi: 10.25259/SNI_279_2024
Contributor Information
David Shin, Email: davidshin@students.llu.edu.
Brandon Shin, Email: brandonshin@students.llu.edu.
Zachary Brandt, Email: zbrandt@students.llu.edu.
Kai Nguyen, Email: kinguyen@students.llu.edu.
Adel Battikha, Email: abattikha@students.llu.edu.
Davis Carter, Email: dlcarter@students.llu.edu.
Mei Carter, Email: mychin@students.llu.edu.
Jacob Razzouk, Email: jacobrazzouk@gmail.com.
Nathaniel Wycliffe, Email: dwycliff@llu.edu.
Wayne Cheng, Email: md4spine@yahoo.com.
Olumide Danisa, Email: odanisa@yahoo.com.
Ethical approval
The research/study was approved by the Institutional Review Board at Loma Linda University, number 5240124, dated March 18, 2024.
Declaration of patient consent
The authors certify that they have obtained all appropriate patient consent.
Financial support and sponsorship
Nil.
Conflicts of interest
There are no conflicts of interest.
Use of artificial intelligence (AI)-assisted technology for manuscript preparation
The authors confirm that there was no use of artificial intelligence (AI)-assisted technology for assisting in the writing or editing of the manuscript and no images were manipulated using AI.
Disclaimer
The views and opinions expressed in this article are those of the authors and do not necessarily reflect the official policy or position of the Journal or its management. The information contained in this article should not be considered to be medical advice; patients should consult their own physicians for advice as to their specific medical needs.
REFERENCES
- 1.Abudouaini H, Huang C, Liu H, Hong Y, Wang B, Ding C, et al. Change in the postoperative intervertebral space height and its impact on clinical and radiological outcomes after ACDF surgery using a zero-profile device: A single-Centre retrospective study of 138 cases. BMC Musculoskelet Disord. 2021;22:543. doi: 10.1186/s12891-021-04432-0. [DOI] [PMC free article] [PubMed] [Google Scholar]
- 2.Fleiss JL. 1st ed. United States: Wiley; 1999. The design and analysis of clinical experiments. [Google Scholar]
- 3.Frobin W, Leivseth G, Biggemann M, Brinckmann P. Vertebral height, disc height, posteroanterior displacement and dens-atlas gap in the cervical spine: Precision measurement protocol and normal data. Clin Biomech. 2002;17:423–31. doi: 10.1016/s0268-0033(02)00044-x. [DOI] [PubMed] [Google Scholar]
- 4.Joaquim AF, Lee NJ, Riew KD. Circumferential operations of the cervical spine. Neurospine. 2021;18:55–66. doi: 10.14245/ns.2040528.264. [DOI] [PMC free article] [PubMed] [Google Scholar]
- 5.Koo TK, Li MY. A guideline of selecting and reporting intraclass correlation coefficients for reliability research. J Chiropr Med. 2016;15:155–63. doi: 10.1016/j.jcm.2016.02.012. [DOI] [PMC free article] [PubMed] [Google Scholar]
- 6.Li Y, Huang M, Xiang J, Lin Y, Wu Y, Wang X. Correlation of interpedicular distance with radiographic parameters, neurologic deficit, and posterior structures injury in thoracolumbar burst fractures. World Neurosurg. 2018;118:e72–8. doi: 10.1016/j.wneu.2018.06.122. [DOI] [PubMed] [Google Scholar]
- 7.Liu J, Ebraheim NA, Haman SP, Sanford CG, Jr, Sairyo K, Faizan A, et al. How the increase of the cervical disc space height affects the facet joint: An anatomy study. Spine (Phila Pa 1976) 2006;31:E350–4. doi: 10.1097/01.brs.0000219496.42765.8a. [DOI] [PubMed] [Google Scholar]
- 8.Parra-Frutos I. Testing homogeneity of variances with unequal sample sizes. Comput Stat. 2013;28:1269–97. [Google Scholar]
- 9.Ratner B. The correlation coefficient: Its values range between +1/−1, or do they? J Target Meas Anal Mark. 2009;17:139–42. [Google Scholar]
- 10.Razzouk J, Case T, Vyhmeister E, Bono CM, Cheng W, Danisa O, et al. Morphometric analysis of cervical neuroforaminal dimensions from C2-T1 using computed tomography of 1,000 patients. Spine J. 2024. [DOI] [PubMed]
- 11.Shrout PE, Fleiss JL. Intraclass correlations: Uses in assessing rater reliability. Psychol Bull. 1979;86:420–8. doi: 10.1037//0033-2909.86.2.420. [DOI] [PubMed] [Google Scholar]
- 12.Vetter TR. Descriptive statistics: Reporting the answers to the 5 basic questions of who, what, why, when, where, and a sixth, so what? Anesth Analg. 2017;125:1797–802. doi: 10.1213/ANE.0000000000002471. [DOI] [PubMed] [Google Scholar]
- 13.Vetter TR. Fundamentals of research data and variables: The devil is in the details. Anesth Analg. 2017;125:1375–80. doi: 10.1213/ANE.0000000000002370. [DOI] [PubMed] [Google Scholar]


