

2-Aminomalonic acid is particularly interesting for the synthesis of peptides and amino acids due to its two carboxyl groups. The crystal structure reported here is the first single-crystal X-ray diffraction measurement of this compound or one of its salts.
Keywords: crystal structure, 2-aminomalonic acid, Raman, NMR, peptide synthesis
Abstract
The salt ammonium 2-aminomalonate (systematic name: ammonium 2-azaniumylpropanedioate), NH4+·C3H4NO4−, was synthesized in diethyl ether from the starting materials malonic acid, ammonia and bromine. The salt was recrystallized from water as colourless blocks. In the solid state, intramolecular medium–strong N—H⋯O, weak C—H⋯O and weak C—H⋯N hydrogen bonds build a three-dimensional network.
Introduction
The first synthesis of 2-aminomalonic acid was in 1864 and described by Bayer (Beaujon & Hartung, 1953 ▸). In 1902, Ruhemann and Orton investigated the preparation with nitromalonamide as a starting material and a reduction with amalgam (Beaujon & Hartung, 1953 ▸). In 1902, Lütz used halogenated malonic acid and ammonia as the starting materials to obtain 2-aminomalonic acid as the product (Beaujon & Hartung, 1953 ▸). To obtain a much purer product, Hartung invented in 1952 a distillation in a vacuum with a palladium–charcoal catalyst. 2-Aminomalonic acid was obtained in a yield of 80–90% (Beaujon & Hartung, 1953 ▸).
2-Aminomalonic acid is used as a complexone in medicine, environmental technology and chemistry due to it being a member of the amino polycarboxylic acid group of substances (Anderegg et al., 2005 ▸). In 1945, G. Schwarzenbach introduced the name ‘complexones’ for laboratory-synthesized compounds which are close to amino acids (Anderegg et al., 2005 ▸). Well-known representatives of complexones are, for example, EDTA (ethylenediaminetetraacetic acid), DTPA (diethylenetriamine pentaacetate) or TETA (triethylenetetramine) (Anderegg et al., 2005 ▸). These compounds are built with a nitrogen-containing moiety which enables their use as ligands.
The corresponding acids of 2-aminomalonic acid and its salts are of particular interest because of their two carboxyl groups, one of which can be decarboxylated to form a chiral centre (Zheng et al., 2023 ▸). Like other complexones, 2-aminomalonic has a nitrogen moiety and other functional groups that are very suitable for binding complexes (Anderegg et al., 2005 ▸). The zwitterionic character is similar to that of amino acids and makes it possible to use it as a ligand at different pH values.
Experimental
Synthesis and crystallization
Malonic acid (10.4 g, 0.1 mmol) and diethyl ether (100 ml) were added to a dried Schlenk flask. The mixture was cooled to 273 K and bromine (16.0 g, 0.1 mol) was added under stirring over a period of 40 min. The mixture was warmed to room temperature and stirred for a further 40 min. Aqueous ammonia (100 ml, 25%) was added slowly under stirring. The solvent was removed in a vacuum. The product was obtained as a white-to-light-yellow solid product. The synthesis route is shown in Scheme 1.
Analysis (X-ray, Raman and NMR)
We investigated and characterized salt (I) by single-crystal X-ray diffraction, Raman spectroscopy and NMR spectroscopy. Complete data and devices for the X-ray measurements are listed in the CIF in the supporting information. Low-temperature Raman spectroscopic studies were performed using a Bruker MultiRAM FT–Raman spectrometer with an Nd:YAG laser excitation (λ = 1064 cm−1) under vacuum at 77 K. For a measurement, the synthesized compound was transferred to a cooled glass cell. A Bruker AV400TR spectrometer was used for the 1H, 13C and 14N NMR measurements.
Refinement
Crystal data, data collection, and structure refinement details are summarized in Table 1 ▸.
Table 1. Experimental details.
| Crystal data | |
| Chemical formula | NH4+·C3H4NO4− |
| M r | 136.11 |
| Crystal system, space group | Orthorhombic, Pbca |
| Temperature (K) | 101 |
| a, b, c (Å) | 9.9714 (4), 9.8671 (3), 11.1884 (4) |
| V (Å3) | 1100.81 (7) |
| Z | 8 |
| Radiation type | Mo Kα |
| μ (mm−1) | 0.15 |
| Crystal size (mm) | 0.73 × 0.60 × 0.51 |
| Data collection | |
| Diffractometer | Rigaku Xcalibur Sapphire3 |
| Absorption correction | Multi-scan (CrysAlis PRO; Rigaku OD, 2020 ▸) |
| Tmin, Tmax | 0.847, 1.000 |
| No. of measured, independent and observed [I > 2σ(I)] reflections | 18831, 1483, 1391 |
| R int | 0.021 |
| (sin θ/λ)max (Å−1) | 0.685 |
| Refinement | |
| R[F2 > 2σ(F2)], wR(F2), S | 0.039, 0.113, 1.20 |
| No. of reflections | 1483 |
| No. of parameters | 114 |
| H-atom treatment | All H-atom parameters refined |
| Δρmax, Δρmin (e Å−3) | 0.49, −0.21 |
Results and discussion
Single-crystal X-ray diffraction
Herein, we present the first single-crystal X-ray diffraction analysis of the salt ammonium 2-aminomalonate, NH4+·C3H4NO4−, (I), as a zwitterion. The salt crystallizes in the orthorhombic space group Pbca with eight formula units per unit cell. The asymmetric unit is shown in Fig. 1 ▸. The C—C bonds are 1.5394 (18) (C1—C2) and 1.5485 (18) Å (C2—C3). The C—C bonds are significantly elongated compared to the median of the average Csp2—Csp3 hybridized bond (1.475–1.522 Å) determined by X-ray diffraction (Allen et al., 1987 ▸). The C2—N1 bond [1.4821 (16) Å] is in the same range as the median of an average Csp3—Nsp3 hybridized bond (1.488 Å) and that of glycine (1.484 Å) (Allen et al., 1987 ▸; Iitaka, 1960 ▸). The shorter C—O bond lengths of 1.2483 (16) (C1—O1) and 1.2462 (17) Å (C3—O3) are significantly elongated by approximately 0.015 Å compared to the shorter C—O bond in β-glycine (1.233 Å) (Iitaka, 1960 ▸). The longer C—O bonds are 1.2657 (16) (C1—O2) and 1.2597 (16) Å (C3—O4). In comparison to β-glycine (1.257 Å), the C1—O2 bond is slightly elongated (Iitaka, 1960 ▸).
Figure 1.

The asymmetric unit of salt (I), with displacement ellipsoids drawn at the 50% probability level.
The carbon chain has a C1—C2—C3 angle of 113.00 (10)° and is only slightly magnified compared to the starting material [111.3 (1)°; Jagannathan et al., 1994 ▸]. The O1—C1—O2 [124.87 (12)°] and O3—C3—O4 [127.55 (12)°] angles are only slightly influenced by the NH3 moiety compared to the starting material [O1—C1—O2 = 124.8 (1)° and O1—C1—O2 = 123.3 (2)°]. The N1—C2—C1 angle is 109.56 (10)° and the N1—C2—C3 angle is 109.98 (10)°. The torsion angles are −2.96 (16) (O1—C1—C2—N1), 175.49 (11) (O2—C1—C2—N1), 10.44 (15) (O3—C3—C2—N1) and −169.89 (10)° (O4—C3—C2—N1).
The crystal structure of salt (I) displays a three-dimensional network built of moderate N—H⋯O hydrogen bonds, according to the classification of Jeffrey (1997 ▸). Fig. 2 ▸ shows the hydrogen bonds in the crystal structure. The hydrogen bonds are listed in the CIF in the supporting information. The strongest hydrogen bond, N2—H6⋯O1, is in the asymmetric unit with an N⋯O distance of 2.803 (2) Å. The crystal structure builds chains via N1—H1C⋯O2i [2.928 (1) Å] and N2—H5⋯O4iv [2.908 (2) Å] hydrogen bonds. The chains are connected via N2—H3⋯O3v [2.832 (2) Å] and N1—H1A⋯O4ii [2.822 (2) Å] hydrogen bonds.
Figure 2.
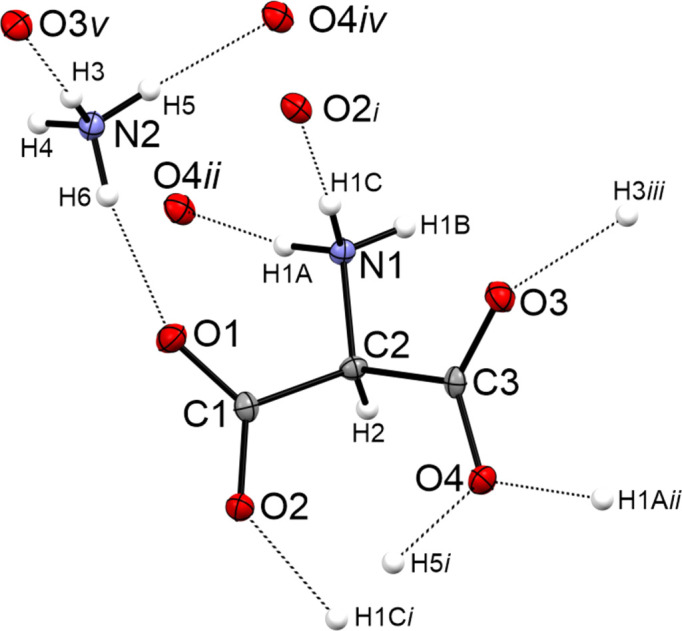
Hydrogen bonds in the crystal structure of salt (I), with displacement ellipsoids drawn at the 50% probability level. [Symmetry codes: (i) x +  , y, −z +
  ; (ii) −x + , −y + 1, z − ; (iii) −x + 1, y + , −z + ; (iv) x − , y, −z + ; (v) −x + 1, y − , −z + .]
Raman spectroscopy
The Raman spectrum of (I) is shown in Fig. 3 ▸, together with that of the starting material malonic acid. The N—H stretching vibrations are detected at 3032 and 2809 cm−1. The C—H stretching vibration is observed at 2977 cm−1. The polarized C=O stretching vibration is detected at 1684 cm−1 and that of C—O at 1328 cm−1.
Figure 3.

The low-temperature Raman spectrum of malonic acid and (I).
NMR spectroscopy
The 1H, 13C and 14N NMR spectra of salt (I) were measured in D2O at room temperature. The 1H NMR spectrum (Fig. 4 ▸) shows one singlet at 4.18 ppm (s, CH). Compared to the starting material, the proton is significantly less acidic and deshielded by 0.76 ppm. The starting material has an H/D exchange in D2O, which is recognizable by the triplet at 3.40 ppm and the singlet at 3.42 ppm (Fig. 5 ▸). The 13C NMR analysis of (I) detected the carboxyl C atom at 170.1 ppm and the C2 atom at 59.1 ppm (Fig. 6 ▸); compared to the starting material, the carboxy moieties are not significantly shifted (Fig. 7 ▸). The protons of atom C2 of the malonic acid are much more acidic, resulting in the 13C NMR spectrum in a triplet at 40.7 ppm (t, J = 20.0 Hz) and a quintet at 40.2 ppm (p, J = 20.3 Hz) splitting. In salt (I), the C2 carbon is much more deshielded and a singlet is seen at 59.1 ppm. The 14N NMR spectrum (Fig. 8 ▸) shows the ammonium cation at −340.6 ppm and the –NH3+ moiety at −361.5 ppm as singlets.
Figure 4.

The 1H NMR spectrum of (I) in D2O.
Figure 5.

The 1H NMR spectrum of malonic acid (C3H4O4) in D2O.
Figure 6.

The 13C NMR spectrum of (I) in D2O.
Figure 7.

The 13C NMR spectrum of malonic acid (C3H4O4) in D2O.
Figure 8.

The 14N NMR spectrum of (I) in D2O.
Conclusion
Herein we present the first single-crystal X-ray diffraction and Raman and NMR spectroscopy study of the salt ammonium 2-aminomalonate. For 2-aminomalonic acid, only the 1H NMR spectrum is known in the literature (Callahan & Wolfenden, 2004 ▸). Also, we describe the H/D exchange of the CH2 moiety in D2O of malonic acid for the first time.
Supplementary Material
Crystal structure: contains datablock(s) I, global. DOI: 10.1107/S2053229624005576/wv3014sup1.cif
Structure factors: contains datablock(s) I. DOI: 10.1107/S2053229624005576/wv3014Isup2.hkl
CCDC reference: 2361889
Acknowledgments
We are grateful to the Department of Chemistry at the Ludwig Maximilian University of Munich, the Deutsche Forschungsgemeinschaft (DFG), the F-Select GmbH and Professor Dr Karaghiosoff for their support. Open access funding enabled and organized by Projekt DEAL.
References
- Allen, F. H., Kennard, O., Watson, D. G., Brammer, L., Orpen, A. G. & Taylor, R. (1987). J. Chem. Soc. Perkin Trans. 2, pp. S1–S19.
- Anderegg, G., Arnaud-Neu, F., Delgado, R., Felcman, J. & Popov, K. (2005). Pure Appl. Chem.77, 1445–1495.
- Beaujon, J. H. R. & Hartung, W. H. (1953). J. Am. Chem. Soc.75, 2499.
- Callahan, B. P. & Wolfenden, R. (2004). J. Am. Chem. Soc.126, 4514–4515. [DOI] [PubMed]
- Farrugia, L. J. (2012). J. Appl. Cryst.45, 849–854.
- Iitaka, Y. (1960). Acta Cryst.13, 35–45.
- Jagannathan, N. R., Rajan, S. S. & Subramanian, E. (1994). J. Chem. Crystallogr.24, 75–78.
- Jeffrey, G. A. (1997). In An Introduction to Hydrogen Bonding. New York: Oxford University Press Inc.
- Rigaku OD (2020). CrysAlis PRO. Rigaku Oxford Diffraction Ltd, Yarnton, Oxfordshire, England.
- Sheldrick, G. M. (2015a). Acta Cryst. A71, 3–8.
- Sheldrick, G. M. (2015b). Acta Cryst. C71, 3–8.
- Spek, A. L. (2020). Acta Cryst. E76, 1–11. [DOI] [PMC free article] [PubMed]
- Zheng, W.-F., Chen, J., Qi, X. & Huang, Z. (2023). Nat. Chem.15, 1672–1682. [DOI] [PubMed]
Associated Data
This section collects any data citations, data availability statements, or supplementary materials included in this article.
Supplementary Materials
Crystal structure: contains datablock(s) I, global. DOI: 10.1107/S2053229624005576/wv3014sup1.cif
Structure factors: contains datablock(s) I. DOI: 10.1107/S2053229624005576/wv3014Isup2.hkl
CCDC reference: 2361889