

Abstract
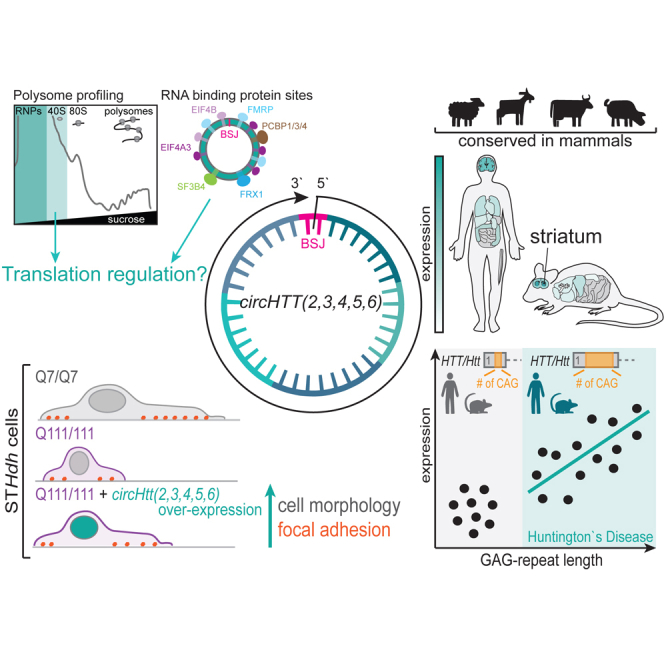
Circular RNA (circRNA) molecules have critical functions during brain development and in brain-related disorders. Here, we identified and validated a circRNA, circHTT(2,3,4,5,6), stemming from the Huntington’s disease (HD) gene locus that is most abundant in the central nervous system (CNS). We uncovered its evolutionary conservation in diverse mammalian species, and a correlation between circHTT(2,3,4,5,6) levels and the length of the CAG-repeat tract in exon-1 of HTT in human and mouse HD model systems. The mouse orthologue, circHtt(2,3,4,5,6), is expressed during embryogenesis, increases during nervous system development, and is aberrantly upregulated in the presence of the expanded CAG tract. While an IRES-like motif was predicted in circHTT(2,3,4,5,6), the circRNA does not appear to be translated in adult mouse brain tissue. Nonetheless, a modest, but consistent fraction of circHtt(2,3,4,5,6) associates with the 40S ribosomal subunit, suggesting a possible role in the regulation of protein translation. Finally, circHtt(2,3,4,5,6) overexpression experiments in HD-relevant STHdh striatal cells revealed its ability to modulate CAG expansion-driven cellular defects in cell-to-substrate adhesion, thus uncovering an unconventional modifier of HD pathology.
Keywords: MT: Non-coding RNAs, Huntington's disease, CAG-repeat expansion, Neurodegeneration, circRNA, back-splicing
Graphical abstract
Morandell and colleagues identify and experimentally validate the evolutionary conserved circHTT(2,3,4,5,6) circular RNA molecule stemming from the Huntington's disease gene locus, demonstrate an intricate link between CAG-repeat length and its expression levels, and highlight it as a possible molecular modifier of the disease.
Introduction
Global changes in transcription and translation have been associated with neuronal differentiation and plasticity.1,2 Additionally, a number of reports have concordantly supported the crucial relevance of alternative splicing (AS) regulation in diversifying neuronal transcript isoforms and protein complexity, along with its essential role for proper neurodevelopment and physiology of the adult CNS.3,4 The AS machinery is complex and relies on the co-regulated expression of RNA-binding proteins (RBPs) in a time- and tissue-dependent manner.5 Interestingly, the spliceosome machinery is not only responsible for the production of linear mRNA isoforms, but is also directly implicated in the biogenesis of circular RNAs (circRNAs) through the process of back-splicing, which generates regulatory RNAs characterized by a single-stranded circular structure in which the 3′ and 5′ ends are joined together through a covalent bond.6,7 Because of such architecture, circRNAs are naturally resistant to decay by exonucleases, unlike their linear transcript counterparts.6 They have been shown to display several functions depending on both intracellular localization and nucleotide sequence, including sponging effects for microRNAs,7,8 and RNA-binding proteins,9,10,11 regulation of transcription,12 splicing,13 and translation,11 and, in a few cases, they can be translated themselves.14 CircRNAs are expressed in a tissue-specific pattern and accumulate in particular in the adult and aging nervous system.15,16,17 Mutations in neural RBPs and splicing regulators, and aberrations in neural AS patterns and circRNA composition, have been linked to an array of neurological disorders.18,19
Huntington’s disease (HD) is a paradigmatic fatal neurodegenerative disorder that is truly monogenic, as the genetic cause underlying all cases is an expansion of the CAG trinucleotide repeat in exon 1 of the HD locus (HTT).20 A polymorphic tract of CAGs up to 27–30 repeats is found in unaffected individuals, while alleles of 40 or more repeats inevitably lead to HD. Interestingly, the CAG-repeat tract exhibits outstanding conservation throughout the course of evolution, spanning both vertebrate and invertebrate species. Even Echinodermata and Cephalochordata, which represent some of the most basal lineages with primitive nervous systems,21,22 carry a CAG tract in the HTT protein coding region, albeit a very short one consisting of only two repeats.23,24 Furthermore, species more closely related to humans tend to have a greater number of CAGs in their HTT gene orthologue, suggesting a possible correlation between the length of the CAG tract and the development of a more complex nervous system.25
Many studies demonstrate that a set of processes are commonly disrupted in HD cell lines and animal models, as well as in HD patient cells,26,27 but it is still a matter of debate which one(s) is (are) primarily responsible for pathogenesis. Lately, RNA processing dysregulation has emerged as a prevailing feature of HD.28,29 In particular, we and others have shown that RNA processing, AS, and back-splicing alterations might affect cellular fitness, thus contributing to neuronal vulnerability and pathogenesis.29 Huntingtin protein can associate with the WW-containing proteins FBP11/PRPF40A and PRPF40B,30,31,32 participating in early spliceosomal assembly and 5′ splice site recognition. On the other hand, mis-splicing events in individuals with highly expanded HTT CAG repeats have been shown to produce the small polyadenylated HTT exon 1-intron 1 transcript, HTT1a, implicated in the disease.33 Earlier evidence supports a role for mutant huntingtin in dysregulating the expression of four RBPs (PTBP1, SFRS4, RBM4, and SREK1) in HD postmortem brains, thus correlating with abnormal splicing in the CNS.34 These data were further corroborated by our work where, through integrative transcriptomic analyses, we unveiled a network of transcriptionally altered micro-RNAs and RBPs (CELF, hnRNPs PTBP, SRSF, UPF1, and YTHD2), which might influence the AS machinery and circRNA production, primarily in neural cells.29
Taken together, it is likely that dysregulation of AS and back-splicing locally at the HTT locus and/or at genome-wide level could be critical to the HD pathologic process. Back-splicing is stimulated by long flanking introns, which are rich in inverted repetitive elements.35 Considering that the HTT locus contains many repeats, it seemed reasonable to expect back-splicing events taking place at this locus. Indeed, here we describe an evolutionary conserved circRNA originating from the HTT locus circHTT(2,3,4,5,6) (484 nt, chr4: 3088665–3109150; GRCh37/hg19 genome assembly for H. sapiens), with orthologues in mouse [circHtt(2,3,4,5,6)], pig, cow, goat, and sheep, suggesting a possible conserved function. From our data, we find that circHTT(2,3,4,5,6) is a cytosolic circRNA that is strongly enriched and developmentally regulated in the brain, as well as induced by the CAG trinucleotide repeat expansion in HTT exon 1. We propose that, by interacting with RBPs and the translation machinery, circHTT(2,3,4,5,6) regulates cell morphology through focal adhesions, thus suggesting it as a modifier of HD pathophysiology.
Results
CircHTT(2,3,4,5,6): An evolutionary conserved circRNA molecule from the HD gene locus
We recently demonstrated that both canonical linear splicing as well as back-splicing are affected by the pathologic expansion of the HTT/Htt CAG-repeat tract.29 Specifically, in mouse neural-progenitor cells (NPCs), the expression of an elongated CAG tract in the Htt gene led to a significant alteration in circRNA levels, with 92 circRNAs being upregulated and the vast majority (478) being downregulated when compared with controls.29 The HD gene locus has a complex genomic architecture, with several HTT transcript isoforms reported,36,37 including a short HTT exon 1-intron 1 toxic transcript, HTT1a,33 a head-to-head antisense AS-HTT transcript that regulates HTT expression,38 and several long introns enriched for repetitive elements (ALU repeats). Thus, it seemed conceivable to expect back-splicing events at this locus. We explored the publicly available circRNA database circBASE (Database: http://www.circbase.org/) and found 89 circRNAs annotated at the HTT locus (Table S1). Interestingly, none of them spanned the CAG trinucleotide repeat tract, consistent with the notion that 5′ cap modifications of the transcript interfere with back-splicing of the first exon. We filtered circRNA candidates to identify (1) those reported in more than one study; (2) those flanked by long (>7 kb) introns, a hallmark of back-splicing hotspots; and (3) those with predicted mouse orthologues (Table S1). This narrowed the list to hsa_circ_0001392, the only circRNA reported in four independent sequencing studies described in circBase.6,7,15,39 A circRNA corresponding to the identical genomic position was further annotated in CIRCpedia.v2 (HSA_CIRCpedia_48392) and circBank (hsa_circHTT_004) (Figure S1A). This circRNA, with a length of 484 nucleotides (nt), stems from the human chr4: 3088665–3109150 (GRCh37/hg19 genome assembly) and includes exons 2 to 6 of the HTT transcript (Figure 1A). Therefore, and in accordance with the proposed guidelines to unify circRNA nomenclature,40 we named it circHTT(2,3,4,5,6). A murine orthologue circRNA from the corresponding mouse Htt locus was also identified in the circBank database, with the genomic coordinates chr5: 34782741–34799515 (mm10 genome assembly), and directly detected by riboCIRC and Oxford Nanopore Technology long reads sequencing,41 indicating its evolutionary conservation (Figure 1A). Important hallmarks and predictors for back-splicing events are the length and composition of flanking intronic sequences.35 Therefore, using CENSOR,42 we screened the genomic sequences of intron 1 and intron 6, flanking the circularized exons, of both human and mouse HTT/Htt against a reference collection of repeats. CENSOR classified introns 1 and 6 in both human and mouse HTT/Htt as long and especially rich in repetitive sequences (human HTT intron 1: 11,850 base pairs [bp] [56.03% repetitive sequences, of which 51% are ALUs] and mouse Htt intron 1: 20,632 bp [47.2% repetitive sequences]; human HTT intron 6: 7,880 bp [51.1% repetitive sequences, of which 38% are ALUs], and mouse Htt intron 6: 4,202 bp [41.6% repetitive sequences]). Thus, this analysis highlighted a potential circularization hotspot in this genomic region in both organisms (Figure 1A). Reverse complementary repeats in introns 1 and 6 of HTT/Htt pre-mRNA could undergo base pairing, promoting covalent joining of the downstream 5′ splice site (SS) at the end of exon 6 with the upstream 3′ SS at the beginning of exon 2. This back-splicing event generates a uniquely identified junction known as the back-splice junction (BSJ) (Figure 1B). Employing divergent primers and cDNA from two different human (hiPSCs-derived neural progenitors: 8330-843 and SH-SY5Y human neuroblastoma cells) and murine cell lines (STHdh wild-type44,45 and NPCs), respectively, we experimentally validated the expression of the circularized molecules, confirming the BSJ’s identity through Sanger sequencing (Figures 1C and 1D). Since the presence of the BSJ could also be explained by pre-mRNA trans-splicing events or template switching by the reverse transcriptase (RT) during cDNA synthesis,46 we treated total RNA from human HEK293T (Figure 1E) and mouse striatal STHdh cells (Figure 1F) with the exoribonuclease RNase R to digest linear RNAs, leaving circRNA molecules intact. Upon cDNA synthesis, we could observe the expected degradation of linear mRNA control transcripts (human ACTB, GAPDH, and TBP and mouse Actb, RnapII, and Htt), while the control circRNA molecules (human cirS-7 and circHIPK3 and mouse circHipk3 and circHomer1), as well as human circHTT(2,3,4,5,6) and mouse circHtt(2,3,4,5,6) were enriched in the RNase R treated samples (+) as compared with mock digestion (−) (Figures 1E and 1F).
Figure 1.

Identification and validation of the evolutionary conserved circHTT(2,3,4,5,6)
(A) Schematic representation of the Huntington’s disease gene locus in humans and mice. Circularized exons in turquoise; CircHTT(2,3,4,5,6)/circHtt(2,3,4,5,6): 484 nt, exons 2–6; % of nucleotides accounting for repetitive sequences in flanking introns in red. (B) Schematic of putative circHTT(2,3,4,5,6)/circHtt(2,3,4,5,6) biogenesis and amplification of the back-splice junction (BSJ) using divergent primers. (C and D) Representative images of gel electrophoresis after PCR amplification (top) and electropherograms after sequencing (bottom) of the human (hiPSC-derived neural progenitors 8330-8, and neuroblastoma SH-SY5Y cells) and mouse (neuro-progenitor and striatal StHdh Q7/7 cells) amplicons, spanning the BSJ. (E and F) RNase R (+) and buffer only (−) treated total RNA was purified and used for cDNA synthesis, followed by endpoint PCR for linear and circRNA targets and gel electrophoresis; left: representative gel images; right: quantification of relative abundance (n = 3 biological replicates in E and F, respectively, data are plotted as mean ± standard error of the mean (SEM). (G) Gel electrophoresis of amplicons from endpoint PCR on cDNA synthetized from total RNA of brain samples of different vertebrate species. Two divergent primer pairs were designed targeting the predicted circHTT(2,3,4,5,6) orthologue sequences (top) of each selected species, as well as primers against linear HTT and housekeeping gene orthologues (GAPDH or ACTB) (n = 2/3 biological replicates per species). (H) Gel extraction and Sanger sequencing of the longer amplicons from predicted circHTT(2,3,4,5,6) orthologues in (G). (I) Schematic representation of the CAG tract of HTT exon 1 as well as the length of introns 1 and 6 (flanking exons 2 and 6) of the selected species. (J) RT-qPCR analysis of circHTT(2,3,4,5,6) orthologue expression levels reported as a ratio from the linear HTT orthologue RNA levels in brain samples (circHTT/HTT ratio was calculated upon normalization to GAPDH housekeeping gene). Species are organized according to the length of their CAG tract (decreasing order, n = 2/3 brain samples per species, data are plotted as mean ± SEM). (K and L) Total RNA from the human tissue panel (K, Ambion, #AM6000) and adult wild-type (C57BL6J) mouse tissues/body district (L, n = 3 mice) was analyzed by qPCR for circHTT(2,3,4,5,6) and HTT, and circHtt(2,3,4,5,6), Htt levels respectively (human transcripts were normalized on NONO, mouse transcripts on Pgk1 levels and shown relative to transcript expression levels in liver, data are plotted as mean ± SEM). (L′) Direct comparison between circHtt(2,3,4,5,6) expression levels in the adult cortex, cerebellum, and striatum (n = 5 mice, one-way ANOVA with multiple comparisons testing, ∗∗p < 0.01, data are plotted as mean ± SEM).
Through sequence alignment of exons 2 to 6 and intron length comparisons of HTT gene orthologues, we found indicators for a potential conservation of circHTT(2,3,4,5,6) in selected vertebrate species Danio rerio (zebrafish), Gallus gallus (chicken), Ovis aries (sheep), Capra hircus (goat), Bos taurus (cow), and Sus scrofa (pig), but not in Drosophila melanogaster and Caenorhabditis elegans (Figure S1C). We then designed two primer pairs for the predicted circHTT(2,3,4,5,6) orthologues for each species (Table S2). In addition, a primer pair for linear HTT and one for housekeeping genes (GAPDH or ACTB) were designed as controls. Total RNA from brain tissue samples of the selected species was reverse transcribed and used as a template for endpoint PCR. Amplification of the linear mRNA HTT orthologues, as well as the housekeeping gene, was successful for all the selected species (Figure 1G). Similarly, for all species, with the exception of D. rerio, at least one of the two primer pairs that amplify across the BSJ of the predicted circHTT(2,3,4,5,6) orthologues gave an amplicon of the expected size (Figure 1G). In order to confirm that the resulting amplicons corresponded to the predicted circHTT(2,3,4,5,6) orthologue, the larger of the two amplicons for each species was excised, extracted from the gel, and sent for Sanger sequencing. The reads did align to the predicted sequence of circHTT(2,3,4,5,6) orthologues and, most importantly, were accurately spanning the BSJ, which is unique to the circular molecules, in all the species except for G. gallus (Figure 1H). Taking these results together, we conclude that circHTT(2,3,4,5,6) is conserved in all the mammalian species analyzed, i.e., O. aries, C. hircus, B. taurus and S. scrofa, but not in D. rerio and G. gallus, in line with shorter flanking intronic sequences in the latter two (Figure 1I). Moreover, by comparing the length of the polymorphic CAG tract (Figure 1I) with the levels of circHTT(2,3,4,5,6) expression among the different species, we uncovered a correlation between longer CAG tracts in exon 1 and higher circularization index between exons 2 and 6 (circHTT/HTT ratio Figure 1J). These data on the one hand suggest a possible conserved function for circHTT(2,3,4,5,6), at least in mammals, and on the other hand, propose a circularization mechanism, which conceivably co-evolved with the CAG tract of the HTT gene,25 and could be dependent on the CAG size in exon 1.
The interpretation of qPCR results assessing levels of circRNA molecules can be biased due to the strand-substitution potential of reverse transcriptases (RTs), leading to rolling circle amplification and an overestimation of circRNA abundance (Figures S2A and S2B).46,47 To estimate the impact of this bias, we employed circHtt(2,3,4,5,6) divergent quantitative (q)PCR primers after use of three different, commonly used RTs and investigated the sequence composition of amplicons of unspecific size, thus potentially corresponding to circRNA concatemers (Figure S2C). Overall, we found that the iScript cDNA synthesis kit by Bio-Rad (#170–8840) produced considerably fewer bands of non-specific size as compared with the other two tested RTs. None of those amplicons, however, when Sanger sequenced, revealed any evidence for rolling circle amplification. Prediction through the Quikfold tool by the UNAFold webserver48 calculated highly complex secondary structures at minimum free energy for both the mouse circHtt(2,3,4,5,6) and human circHTT(2,3,4,5,6) circRNA molecules (Figures S2D and S2E). Such highly structured circRNA molecules may potentially inhibit strand-substitution by the iScript RT, in line with our experimental findings (Figure S2C). We therefore concluded that the assessment of circHTT(2,3,4,5,6)/circHtt(2,3,4,5,6) levels though qPCR analysis represents a valid approach to study their tissue-specific expression patterns.
circRNA molecules are especially abundant in the CNS of adult animals.15 Therefore, we determined expression patterns across different tissues of human circHTT(2,3,4,5,6) and mouse circHtt(2,3,4,5,6) and compared them with their linear counterparts, HTT and Htt, through qPCR analysis. We employed a commercially available total RNA panel from 20 different human tissues (Clontech # 636643) (Figure 1K) and extracted total RNA from 14 different tissues of adult male C57BL6J wild-type mice (Figure 1L), synthesized cDNA, and quantified relative RNA levels of circHTT(2,3,4,5,6)/circHtt(2,3,4,5,6) and their linear counterparts HTT/Htt in the different tissues. In both species, circHTT(2,3,4,5,6) and circHtt(2,3,4,5,6) are most abundant in the CNS, i.e., brain regions and spinal cord, whereas their levels are lower in other tissues/organs (Figures 1K and 1L). Interestingly, and in line with circRNA characteristics, circHTT(2,3,4,5,6) levels were markedly lower in the fetal brain total RNA sample (Figure 1K). We then focused on the three mouse brain regions with the highest levels of circHtt(2,3,4,5,6) and found a stronger enrichment in the striatum, the most vulnerable brain region in HD (Figure 1L'). Of note, linear HTT/Htt mRNA showed more ubiquitous expression throughout all examined tissues, with generally higher levels in brain (Figures 1K and 1L), indicating that circHTT(2,3,4,5,6) abundance does not simply reflect the overall level of HTT expression.
Lengthened HTT/Htt CAG-repeat tracts correlate with increased circHTT(2,3,4,5,6)/circHtt(2,3,4,5,6) circularization
Since we found that the circHTT(2,3,4,5,6)/HTT ratio increased with a longer CAG trinucleotide repeat tract in mammalian species (Figure 1J), we predicted a corresponding increased circularization index in neuronal samples from HD patients. To test this hypothesis, we used human terminally differentiated neuronal (hTDN) samples derived from induced pluripotent stem cells (iPSCs) of healthy controls (with a CAG tract <36) and HD patients with CAGs varying between 43 and 180. Indeed, we found significantly increased levels of circHTT(2,3,4,5,6) in all samples from HD patients when compared with the non-isogenic controls (Figure 2A). Importantly, these levels were positively correlated with the number of CAG repeats in exon 1 of HTT (Figure 2B). This increase was not linked to overall increased transcription at the HTT locus, since linear HTT levels were comparable between control and HD samples (Figure 2A). Thus, considering circHTT(2,3,4,5,6)'s conservation in mice, we set out to investigate these changes in the well-characterized HD zQ175 mouse model, harboring a long tract of ∼210 consecutive CAGs, compared with the seven CAG/CAAs in wild-type mice.49 We collected brain samples from the cortex, striatum, and cerebellum of wild-type control and zQ175 heterozygous animals, at two different time points, 3 and 9 months of age. Then, the RNA levels of linear Htt mRNA, circHtt(2,3,4,5,6), as well as the toxic Htt exon1-intron 1 splice variant, Htt1a,50 were analyzed (Figure 2C). Our results revealed significantly increased levels of circHtt(2,3,4,5,6) in all three brain regions at both time points in the HD model (Figures 2D and S3A). In contrast, Htt mRNA levels were reduced in all three brain areas of the zQ175 mice at 9 months of age, in line with previous reports.51 When compared with the levels of Htt1a, a similar expression pattern for circHtt(2,3,4,5,6) could be observed (Figures 2D and S3A), thus pointing to altered linear and back-splicing dynamics associated with the expanded CAG-repeat tract in exon 1. A direct comparison between splicing dynamics in wild-type and zQ175 is, however, complicated due to the genetic architecture of exon 1 in these mutant animals.49 Therefore, we turned to a second, well-characterized mouse model for HD, the HttQ20 and HttQ111 knockin mouse lines.52 These lines were genetically modified to carry a chimeric human/mouse Htt gene and differ exclusively in the length of the CAG-repeat tract, which in the HttQ20 mouse contains 18 consecutive CAG repeats (mimicking the healthy human control), whereas in HttQ111 mice contains 109 consecutive CAGs (mimicking the human HD patient) (Figure 2E, left). In order to assess a possible regulatory role of the length of the CAG tract in favoring back-splicing between exons 2 and 6, RT-qPCR experiments on cortical and striatal RNA samples of these mice were conducted using a set of primers that amplify across the splice junctions of exons 1/2 and exons 6/7 on linear Htt mRNA, as well as primers to amplify circHtt(2,3,4,5,6)'s BSJ 6/2. Upon normalization to a housekeeping gene, a “circularization frequency” was calculated, reflecting the ratio between the back-splicing and the average linear splicing events at these specific exonic locations (Figure 2E, right). We observed significantly increased “circularization” frequencies in the HttQ111 mice at the two brain regions tested. The increased expression in circHtt(2,3,4,5,6) was prominent in the striatum (Figure 2F), and already significant at 2 months of age (Figure S3B). Specifically, when assessing the signal of the individual primer pairs employed, a decrease in exon 1/2 and 6/7 splice junctions can be observed, coupled with a concomitant increase in circHtt(2,3,4,5,6) levels (Figure 2G). These findings thus suggest that CAG-repeat length modulates the linear and back-splicing dynamics at this locus.
Figure 2.

Correlation between circHTT (2,3,4,5,6)/circHtt(2,3,4,5,6) levels and CAG trinucleotide repeat number
(A and B) CircHTT(2,3,4,5,6) expression levels assessed by RT-qPCR on induced pluripotent stem cell (iPSC)-derived terminal differentiated cortical neurons (hTDNs) from controls (n = 3) and HD patients (n = 6/8, Mann-Whitney test in (A), ∗∗p < 0.01. (B) Results of a linear regression; data are plotted as mean ± SEM). (C) Scheme of qRT-PCR strategy to assess expression levels of different transcripts (i.e., toxic fragment Htt1a, circHtt(2,3,4,5,6) and linear Htt mRNA) from the Htt locus in the brains of wild-type and the zQ175 knockin mouse model for HD. (D) RT-qPCR on brain samples from indicated brain regions (cortex, striatum, cerebellum) of 9-month-old wild-type and zQ175 mice (n = 3 wild-type and 5 zQ175 biological replicates per tissue, one-way ANOVA with Sidak's multiple comparisons testing, ∗∗∗p < 0.001, ∗∗p < 0.01, ∗p < 0.05; data are plotted as mean ± SEM). (E) Experimental strategy to test circHtt(2,3,4,5,6) back-splicing frequency-schematic representation of the binding sites of the employed primer pairs (top). CircHtt fw primer, indicated with letter B in the scheme, can also be used to detect linear Htt when combined with ex7 rv primer. (F) Circularization frequency in cortical, striatal, and cerebellar samples of 6-month-old Q20 (n = 5) and Q111 (n = 5) mice (the relative level of expression of circHtt(2,3,4,5,6) and linear isoforms was first calculated normalizing on the Pgk1 housekeeping gene and subsequently the circularization frequency—as ratio between back-splicing and linear splicing—was computed; one-way ANOVA with Sidak's multiple comparisons testing, ∗∗∗p < 0.001; data are plotted as mean ± SEM). (G) Normalized relative expression of individual primer sets used to calculate circularization frequencies in 6-month Q20 and Q111 mouse tissues (2−DDCt values, unpaired two-sided t tests for each primer set individually, ∗∗∗p < 0.001, ∗∗p < 0.01, ∗p < 0.05, ns = not significant).
Altered developmental trajectory of circHtt(2,3,4,5,6) in the striatum of the zQ175 HD mouse model
Overall, circRNA expression is dynamically and spatio-temporally regulated, with some circRNAs retaining crucial developmental functions.53,54,55 Furthermore, although typically conceived as a neurodegenerative disease, an increasing body of evidence is pointing to abnormal neurodevelopment as another player in HD.56,57,58,59 Therefore, and since we observed elevated levels of circHtt(2,3,4,5,6) already at 3 months of age, i.e., before overt HD-like phenotypic changes,49 we sought to characterize the developmental trajectories of circHtt(2,3,4,5,6) expression in the early postnatal period (P0, P7), at the age of weaning (P21) compared with the 3 months expression levels (P90) (Figure 3A). CircHtt(2,3,4,5,6) expression increases postnatally, both in wild-type as well as zQ175 striatal tissues. However, when fitted to a linear regression, circHtt(2,3,4,5,6)’s developmental increase follows a much steeper slope (0.133, with a 0.009 SEM) in the mutant brain samples when compared with the wild-type (0.065, with a 0.005 SEM) (Figure 3A). In contrast, Htt linear transcript’s developmental trajectories were overall more similar between wild-type and zQ175 striatal tissues. Nonetheless, we were able to identify a significantly reduced slope in the zQ175 line, as previously reported, representing an opposite effect compared with circHtt(2,3,4,5,6) (Figure 3A). Thus, CAG-repeat expansion in Htt exon 1 not only alters the linear and back-splicing frequency of downstream exons, but it does so in a developmental stage-dependent manner, indicating possible neurodevelopmental implications for circHtt(2,3,4,5,6) in HD pathophysiology. To investigate whether these changes may correlate with progressive neuronal differentiation, we cultured primary neurons from the developing telencephalon of wild-type and zQ175 mice at embryonic day (E)18 (Figure 3B). By comparing expression levels of well-known markers for neuronal maturation (Psd95,60 Nrxn1,61 Cntn1,61 and cirS-762) between DIV-0 and DIV-10, we confirmed progressive and comparable neuronal maturation of the cultured neurons for both genotypes (Figure 3C). CircHtt(2,3,4,5,6) expression levels were already significantly increased at DIV-0 in the zQ175 primary neurons, with comparable levels at DIV-10 (Figure 3D). Instead, and in line with our previous findings, Htt mRNA levels were significantly reduced in zQ175 primary neurons at both time points (Figure 3D). While these data do not show overt circHtt(2,3,4,5,6) increases during the in vitro neuronal differentiation setting, as observed in vivo (Figure 3A), they clearly indicate that circHtt(2,3,4,5,6) expression levels are already significantly higher at embryonic stages of development in the zQ175 mouse line, further highlighting its potential relevance for brain developmental processes in HD.
Figure 3.

In vivo and in vitro developmental trajectory of circHtt(2,3,4,5,6) abundance in the zQ175 HD mouse model
(A) RT-qPCR analysis across postnatal (P) development in the wild-type and zQ175 mouse striatum (A, n(P0) = 3 per genotype, n(P7) = 3 wild-type/2 zQ175, n(P21) = 5 per genotype, n(P90) = 5 per genotype; transcript levels normalized to the geometric mean of three housekeeping genes, Pgk1, Tfrc, and Actb, and to the wild-type levels at P0; two-way ANOVAs followed by Tukey's multiple comparisons test, and simple linear regression to calculate expression trajectory slopes, ∗∗∗p < 0.001, ∗∗p < 0.01, ∗p < 0.05). (B) Primary neuronal culture experimental layout from wild-type and zQ175 E18 embryos (top). Representative images of primary cortical neurons at 6 days in vitro (DIV), stained for Tubb3+ differentiating neurons and GFAP+ astrocytes (bottom), scale bar, 25 μm; (C and D) RT-qPCR results on cDNA from total RNA of cultured neurons at 0 and 10 DIV; neuronal maturation markers Psd95, Nrxn1, Cntn1, and the circular RNA cirS-7 (C); circHtt(2,3,4,5,6) and Htt mRNA levels in the zQ175 derived neurons at 0 DIV and 10 DIV (D) (n(embryos) = 4 wild-type and 5 zQ175; transcript levels normalized to the geometric mean of three housekeeping genes, Pgk1, Tfrc, and Actb, and to the wild-type levels at DIV-0; two-way ANOVA followed by Tukey's multiple comparisons test, ∗∗∗p < 0.001, ∗∗p < 0.01, ∗p < 0.05; data are plotted as mean ± SEM).
CircHTT(2,3,4,5,6)/circHtt(2,3,4,5,6) functional roles in physiologic conditions
In order to investigate the functional role of circHTT(2,3,4,5,6)/circHtt(2,3,4,5,6), we inspected the human circHTT(2,3,4,5,6) sequence for enrichment of miRNA binding sites; however, no high-score consensus motifs were identified (mirBASE E-value cutoff >1) (Figure 4A, left). Instead, by initially using circ-InteractomeRBP,63 then employing CISBP-RNA motifs PWM,64 and finally intersecting with eCLIP ENCODE sequence motifs,65 we found that circHTT(2,3,4,5,6) presents enrichment in RBP binding sites for translation regulating factors EIF4A3 (four sites) and EIF4B (two sites), as well as FMRP (three sites), FXR1, PCBPs (1/3/4), SF3B4, YTHDC1, and PTBP (Table S3; Figure 4A, middle), as well as a high-confidence IRES-like site (circRNADb R Score >1.6266), predicted between 34 and 182 nt (Figure 4A, right). Since this IRES-like sequence was followed by a predicted open reading frame (ORF) of 186 amino acids (aa), we investigated if circHtt(2,3,4,5,6) could be directly translated. We resorted to polysome profiling from brain cytoplasmic lysates of 6- to 7-month-old wild-type and the zQ175 mice (Figures 4B–4F), and determined circHtt(2,3,4,5,6)’s co-sedimentation profile with ribosomes and polysomes. Graphical representations of typical polysome profiles are shown in Figure 4B. The first peak contains free cytosolic light components (RNPs), followed by the ribosomal subunits (40S and 60S) and monosomes (80S), all associated with non-translating particles. The remaining peaks of the profile represent polysomes, which sediment with high sucrose concentrations and contain the RNAs associated with ribosomes. First, we confirmed successful fractionation by analyzing co-sedimentation profiles of the 18S rRNA (Figure 4C), as well as heavily translated beta actin mRNA (Actb) (Figure 4D). In contrast, the vast majority of circHtt(2,3,4,5,6) localized to the free cytosolic light components (RNPs) fractions (80%–85%), with none detected in translating polysomes (Figures 4E and 4G). Thus, we concluded that circHtt(2,3,4,5,6) is not translated itself in physiologic conditions, neither in wild-type nor zQ175 brain tissue. Interestingly, however, we observed a modest, but consistent fraction (10%–15%) of circHtt(2,3,4,5,6) co-sedimenting with the 40S small ribosomal subunit in fraction 3 (Figures 4E and 4G). On the other hand, linear Htt mRNA, as expected, showed a co-sedimentation profile mostly associated with light polysome fractions, in line with its translation (Figure 4F). When comparing co-sedimentation profiles of wild-type and zQ175 brain tissue more globally, we did not observe any overt difference between the two genotypes. Only a modest shift toward reduced translation was observed, when looking into the 18S rRNA in fraction 12 as well as the mRNAs Actb and Htt. Of note, when repeating the experiment employing an alternative buffer without deoxycholic acid for the preparation of cytoplasmic extracts, which has previously been shown to preserve polysome association of FMRP in cortical extracts,67 the circHtt(2,3,4,5,6) co-sedimentation profile remained essentially the same (data not shown). Taken together, our results do not support direct translation of circHtt(2,3,4,5,6) in vivo under physiological conditions; however, they (1) highlight an interesting association of a subset of circHtt(2,3,4,5,6) with the small 40S ribosomal subunit and (2) considering the predicted binding sites for translation regulators on its sequence, (3) point to a potential involvement of circHtt(2,3,4,5,6) in translation regulation.
Figure 4.

CircHTT(2,3,4,5,6) has predicted binding sites for RNA-binding proteins (RBPs) and associates with the 40S ribosomal subunit
(A) Sequence analysis of circHTT(2,3,4,5,6) reveals no enrichment in miRNA binding sites (left); however, binding sites for multiple RBPs (middle, Table S2, width visualizes number of nucleotides in binding motive), as well as an IRES sequence (right, localized between nucleotides 31 and 128), followed by a predicted open reading frame of 186 aa. (B) Representative sucrose gradient absorbance profiles of polysome fractionation of cytoplasmic lysates from wild-type (WT) (gray) and zQ175 (blue) brain samples at 6–7 months of age. (C–F) Relative distribution of 18S, Actb, circHtt(2,3,4,5,6), and Htt RNAs along polysome profile in WT (gray line) and zQ175 (blue line) (data are plotted as mean ± SEM of n = 5 independent biological replicates). (G) Doughnut plots reporting the relative percentages of circHtt(2,3,4,5,6) co-sedimentation with RNPs, 40S, 60S, 80S, and polysomes.
CircHtt(2,3,4,5,6) overexpression modulates cellular phenotypes and focal adhesion in the STHdh Q111/Q111 in vitro cell model for HD
To further investigate potential functional roles of circHTT(2,3,4,5,6)/circHtt(2,3,4,5,6), we cloned exons 2–6 of HTT/Htt into the ZKSCAN1 expression vector for circRNAs (Figure S4A).68 We confirmed the production of a circular transcript through northern blot analysis (Figure S4B) and used the ZKSCAN1 circHTT(2,3,4,5,6) vector, together with the empty MCS control vector, for circRNA overexpression in human HEK293T cells, characterized by low endogenous circHTT(2,3,4,5,6) levels (Figure S4C). We found that circHTT(2,3,4,5,6) overexpression did not alter linear HTT mRNA levels (Figure S4C), nor huntingtin protein abundance, as assessed by western blot analysis (Figure S4D). Since the HEK293T cells have little relevance in the context of a brain-enriched circRNA molecule and for HD pathology, we then analyzed the effect of circHtt(2,3,4,5,6) overexpression in the HD-relevant mouse STHdh cell line series with cells carrying wild-type Q7/Q7, heterozygous Q7/Q111, and homozygous Q111/Q111 knockin alleles44 that show endogenously increased levels of circHtt/Htt ratios (Figure S4E). Upon transfection of the ZKSCAN1 circHtt(2,3,4,5,6) vector and puromycin selection to obtain polyclonal cell lines with stable overexpression, we confirmed successful overexpression of circHtt(2,3,4,5,6) in cells of all three genotypes (Figure S4F). Next, we investigated possible effects of circHtt(2,3,4,5,6) overexpression on translation and/or stability of wild-type and mutant huntingtin protein in the three different genotypes through western blot analysis (Figure S4G, left). In line with the results in HEK293T cells (Figure S4D), we could not observe any significant changes in huntingtin protein abundance (Figure S4G, right). We additionally investigated the subcellular localization of endogenous circHtt(2,3,4,5,6) in the control MCS STHdh cell lines and observed strong enrichment in the cytoplasmic cell compartment (Figure S4H, left). This compartmentalization was also not substantially affected by circHtt(2,3,4,5,6) overexpression, although a tendency toward more nuclear retention (as indicated by a lower cytoplasmic/nuclear ratio) was observed in all three genotypes of these stable cell lines (Figure S4H, right). Of note, in human HEK293T cells, at physiologic levels, circHTT(2,3,4,5,6) also primarily localizes to the cytoplasm (Figure S4I). In summary, we could not observe any significant changes in HTT/Htt linear mRNA transcription/stability, huntingtin protein abundance, or subcellular compartmentalization changes upon circHTT(2,3,4,5,6)/circHtt(2,3,4,5,6) overexpression in human wild-type and mouse in vitro model systems relevant for HD.
Nonetheless, we wanted to check for possible effects in trans, with circHtt(2,3,4,5,6) overexpression possibly having an impact on the HD-related phenotypes previously described in the STHdh cell lines Q7/Q111 and Q111/Q111. To that end, we employed a live-cell painting approach using Hoechst, Calcein-AM, MitoTracker, and high-throughput confocal imaging to assess cellular and nuclear morphology, as well as mitochondria number and activity in a total of 8,000–10,000 cells per replicate for each condition (n = 3 biological and 6 technical replicates each), i.e., untransfected, MCS empty control, and ZKSCAN1 circHtt(2,3,4,5,6) overexpressing polyclonal cell lines (Figures 5A–5E, S5A, and S5B). Employing the Custom Module extension of MetaXpress 6.7.2.290 (Molecular Devices, LLC), single-cell morphology was analyzed (cytosolic Calcein-AM, Figures 5A–5C), mitochondrial morphology and intensity were evaluated (MitoTracker, Figures S5A and S5B), and nuclear morphology was assessed (Hoechst, Figures 5D and 5E). STHdh Q7/Q111 and, to a much stronger degree, STHdh Q111/Q111 cells display altered cell morphological features, i.e., reduced cell area and altered cell morphology, displaying a more circular shape, accompanied by a reduced formation of cellular processes (Figures 5A–5C). These phenotypes are in line with previous reports, and linked to altered cell-cell and cell-substrate interactions through focal adhesion (FA), possibly ascribable to decreased N-Cadherin function, which is directly linked to an HD-specific defect.69,70 Interestingly, we observed a significant amelioration of the cell morphological defects in the STHdh Q111/Q111 cells overexpressing circHtt(2,3,4,5,6) when compared with the STHdh Q111/Q111 empty MCS controls (Figure 5B, left and right). Furthermore, the reduced number and length of protrusions in the Q111/Q111 cells were also rescued by circHtt(2,3,4,5,6) overexpression (Figure 5C, left and right). Additionally, and possibly as a consequence of the generally modified cell shape, nuclear shape, as assessed by Hoechst staining (Figures 5D and 5E), responded in a similar manner to circHtt(2,3,4,5,6) overexpression in the Q111/Q111 STHdh cells (Figure 5E, right). To dissect these cell morphology phenotypes in more detail, we directly studied cellular FA. To that end, STHdh Q7/Q7 and Q111/Q111 untransfected, MCS empty control and ZKSCAN1 circHtt(2,3,4,5,6) overexpressing cells were seeded at low density, fixed, and stained for Vinculin, a central component of FA multiprotein structures that link the intracellular cytoskeleton to the extracellular matrix (Figure 5F, top). Automated cell segmentation and quantitative analysis of the number of Vinculin foci per cell revealed a significant reduction in the number of foci in Q111/Q111 cells when compared with the wild-type Q7/Q7 (Figure 5F, bottom left). Importantly, while not completely returning to the wild-type levels, this decrease was significantly modulated in cells overexpressing circHtt(2,3,4,5,6) (Figure 5F, bottom left). Instead, the mean fluorescence intensity of Vinculin signal, which appears significantly reduced in the Q111/Q111 cells when compared with the wild-type control, remained comparable in circHtt(2,3,4,5,6) overexpressing cells (Figure 5F, bottom right). Vinculin can directly interact with,71 and be recruited to, cellular junctions through N-Cadherin,72 and its reduced expression levels were previously linked to cell morphological defects in Q111/Q111 cells.70 To explore whether alterations in N-Cadherin levels were linked to the observed increase in Vinculin-positive FA sites in the Q111/Q111 circHtt(2,3,4,5,6) overexpressing cells, we performed western blot analysis (Figure 5G, top). Quantification revealed significantly reduced N-Cadherin and Vinculin levels in the Q111/Q111 mutant cells, when compared with the wild-type controls, in line with previous reports.69 This reduction, however, was not modified through circHtt(2,3,4,5,6) overexpression (Figure 5G, bottom left and right).
Figure 5.

Overexpression of circHtt(2,3,4,5,6) ameliorates cellular phenotypes of the STHdh Q111/Q111 striatal cell model system for HD
(A) Representative images of the high-throughput cell painting assay using Calcein-AM (green), MitoTracker (red), and Hoechst (blue) live-cell staining to assess cellular features of the untransfected (untr.) control STHdh Q7/Q7, Q7/Q111, and Q111/Q111 cell lines, as well as MCS and circHtt(2,3,4,5,6) overexpressing cells of all genotypes (composite merged image of the three channels is shown in A, close ups of the dash-boxed cells in the upper right corner). (B) Average cell area in μm2 (left) and cell shape factor (0 = flat, 1 = perfect circle, right) are reported. (C) Average number (left) and length (right) of cellular protrusions. (D) Representative images of Hoechst nuclear staining. (E) Average nuclear cell area in μm2 (left), and shape factor (0 = flat, 1 = perfect circle, right); (parameters as calculated upon segmentation of Calcein-AM and Hoechst signal by the Custom Module extension of MetaXpress (6.7.2.290) are reported; (A–E, n(cells) = 8,000–10,000 cells per genotype and condition over three biological replicates, each dot represents the average value of all cells from the individual replica wells; outliers were removed using the ROUT (Q = 1%) method, followed by one-way ANOVA with Sidak's multiple comparisons testing (parametric data) and Kruskal-Wallis with Dunn's multiple comparisons testing (nonparametric data), ∗∗∗p < 0.001, ∗∗p < 0.01, ∗p < 0.05, scale bars indicate 100 μm in overview and 25 μm in close ups; data are plotted as mean ± SEM). (F) Immunofluorescence staining of Q7/Q7 wild-type control and Q111/Q111 untransfected, MCS, and circHtt(2,3,4,5,6) overexpressing cells for Vinculin (orange) and Hoechst (blue) (top). The average number of Vinculin foci per cell (bottom left) and average Vinculin fluorescence intensity (bottom right) as quantified by an automated cell segmentation and analysis Macro in Fiji (n(technical replicates) = 3, with n(cells) = 69 Q7/Q7, 102 Q111/Q111 untransfected, 134 Q111/111 MCS, and 95 Q111/Q111 circHtt(2,3,4,5,6) overexpressing; outliers were removed using the ROUT (Q = 1%) method, followed by Kruskal-Wallis with Dunn's multiple comparisons testing [nonparametric data], ∗∗p < 0.01, ns = not significant, scale bars indicate 20 μm; data are presented with violin plots, central line indicates median, dotted line quartiles). (G) Representative western blots of N-Cadherin and Vinculin levels in Q7/Q7 wild-type control and Q111/Q111 untransfected, MCS, and circHtt(2,3,4,5,6) overexpressing cells (top) and quantifications normalized to Hsp90 (bottom) (n(biological replicates) = 3–4 per genotype and condition, one-way ANOVA with Sidak's multiple comparisons testing, ∗∗p < 0.01, ns = not significant; data are plotted as mean ± SEM).
Last, we investigated mitochondrial organization and function by analyzing the MitoTracker signal in the cell painting assay (Figures S5A and S5B). We observed a significantly decreased number of MitoTracker positive clusters in STHdh Q111/Q111 cells, which was slightly, but significantly, counteracted by circHtt(2,3,4,5,6) overexpression (Figure S5B, left), while the mean fluorescence intensity was not significantly altered by circHtt(2,3,4,5,6) overexpression (Figure S5B, right). To further explore a potential function of circHtt(2,3,4,5,6) in regulating mitochondrial energy metabolism, we turned to a second, quantitative approach. We dissociated and stained live cells of the different STHdh lines with the MitoStatus Red fluorescent dye and quantified the fluorescent signal emitted by stained mitochondria using the FACSymphony A1 Cell Analyzer (Figures S5C and S5D). While a clear difference in the distribution of fluorescence signal, hence mitochondrial membrane potential, among the three different genotypes could be detected, as previously reported in the literature,73 we did not observe any significant changes in the percentages of cells with high vs. low MitoStatus fluorescence intensities when circHtt(2,3,4,5,6) was overexpressed. Similarly, by analyzing the expression levels of a panel of genes regulating both mitochondrial fusion and fission through RT-qPCR, we could observe a profound deregulation between the Q7/Q111 heterozygous and, to a much stronger degree, Q111/Q111 homozygous cells when compared with the Q7/Q7 wild-type, in line with previous studies.73 However, circHtt(2,3,4,5,6) overexpression did not alter any of these transcriptional signatures of the HD cellular models (Figures S5E and S5F).
Taken together, our functional assessment of circHtt(2,3,4,5,6) overexpression in STHdh cells highlights a potential trans regulatory role of the molecule in modifying cell morphology through FA, but not mitochondrial energy metabolism.
Discussion
circRNAs were originally perceived as noise produced by the RNA processing machinery, yet they gained substantial recognition over the past decade.74 They are found across all eukaryotes (protists, fungi, plants, and animals),75 and are frequently generated from orthologous genomic regions across species, with intricate spatiotemporal expression patterns.41,55 circRNA biogenesis is mediated through a circle-forming back-splicing reaction, and is guided through the canonical splicing machinery, facilitated by reverse complementary repetitive sequences in flanking introns or through binding of RBPs, promoting pre-mRNA folding.9,35 Due to their circular structure, circRNAs are protected from the activity of cellular exonucleases, which in mitotically inactive cells, such as neurons, leads to accumulation during aging.15,16,17 While for some circRNAs specific functions covering a wide range of biological roles have been reported,76 experimental evidence for functionally, evolutionary conserved circRNAs is still very scarce. Our work fits into this focus area, providing solid proof of circHTT(2,3,4,5,6) conservation among mammalian species (human, mouse, pig, sheep, cow, and goat), and correlating its appearance with the presence of species-specific long flanking intronic sequences. CircHTT(2,3,4,5,6) stems from the HD gene locus (HTT) and it is produced downstream of exon 1 where the polymorphic CAG-repeat tract is located.20 From recent studies, the HTT CAG-repeat tract appears under purifying natural selection—characterized by the length of an uninterrupted (pure) CAG repeat—when compared with other CAG-repeat containing genomic loci.25 This exceptional conservation and purity in the HTT CAG-repeat also associates with evolutionary expansion,77 which seems to confer advantageous traits, leading to the generation of more mature, interconnected, and functional neurons.78 Our data suggest that the evolutionary expansion of HTT CAG repeats may correlate with increased levels of circHTT(2,3,4,5,6) circularization, thus suggesting a potential co-evolution of these molecular traits.
However, the evolutionary process aimed at preserving the purity of a beneficial elongation of the CAG repeat, in rare cases, can lead to an extreme expansion. When the repeat increases to over 40 units, it is associated, with full penetrance, to the autosomal dominant genetic condition known as Huntington’s disease. As a logical corollary of our hypothesis—that an elongated HTT CAG-repeat tract would correlate with increased production of circHTT(2,3,4,5,6)—indeed, we discovered that circHTT(2,3,4,5,6) biogenesis is strongly elevated when the CAG-repeat numbers reach and exceed pathological expansion in the context of HD, both in human as well as mouse model systems of the disorder. Interestingly, circHtt(2,3,4,5,6) levels do not correlate with Htt transcription levels but mimic the abundance of the highly pathogenic Htt1a fragment, generated by incomplete splicing,33 suggesting a primary underlying role for the spliceosome machinery, rather than direct transcriptional regulation. Splicing is occurring co-transcriptionally, therefore RNA Pol II speed is emerging as another determinant of splicing regulation and circRNA production.79 Indeed, genome-wide studies have reported a direct correlation between RNA Pol II velocity and circRNA biogenesis at specific loci.80 In other words, fast elongation speeds usually favor exon exclusion from linear transcripts, and increased circularization of these linearly excluded exons. Interestingly, stable RNA duplexes, DNA:RNA hybrid structures and R-loops, frequently associated with GC-rich sequences and triplet expanded tracts,81 induce transcription stalling during elongation,82 leading to increased repeat instability,83,84,85 but also impact local splicing and back-splicing events. Thus, it might be the architecture of the pure CAG tract, upstream of the circularization hot spot, directly or indirectly controlling circHTT(2,3,4,5,6) biogenesis. In fact, the highly structured CAG-repeat tract might recruit/sponge spliceosome components, RBPs, and RNA helicases, as previously reported for the HTT CAG-repeat (i.e., SRSF6,86 PRPF8, and others87,88), thus, in turn, affecting AS and back-splicing locally in cis and/or at genome-wide level in trans.29
Incidentally, an independent, complementary study also recently reported the very same circRNA molecule, composed of HTT exons 2–6, stemming from the HTT locus and increased by lengthened CAG-repeat.89 These findings additionally strengthen our conclusions and clearly support circHTT(2,3,4,5,6) as a prevalent and brain-enriched circRNA from the HTT locus.
Assessing functional roles of circRNAs is, in general, challenging. In order to obtain some initial insights on circHTT(2,3,4,5,6) function and its relevance for HD pathology, we inspected its sequence searching for predicted miRNA binding sites,90 motifs for RBPs,91 and IRES-like sequences,92 as previously reported from other circRNA molecules. No high-score miRNA consensus motif was identified, while a high-confidence IRES site was predicted between 34 and 182 nt.93 Through subcellular fractionation, we showed clear cytoplasmic localization of human circHTT(2,3,4,5,6) and mouse circHtt(2,3,4,5,6), thus we hypothesized its possible role in the regulation of protein translation (1) in cis, stimulating huntingtin protein production, (2) in trans, at genome-wide level by sequestering specific regulatory factors, or (3) being itself directly translated (predicted ORF 186 aa). With the clear limitations associated with the overexpression approach, especially if considering the globally modest endogenous expression levels of circRNAs, we initially assessed circHTT(2,3,4,5,6) functionality by overexpression in cellular systems. At first, we inspected whether a modulatory role in transcription/translation could be observed in cis at the host gene, HTT. In general, our findings support a negligible effect on HTT gene transcription and local protein translation. However, when inspecting cellular phenotypes in the HD-relevant striatal STHdh model system, a possible modulatory effect was observed. Specifically, cell morphological defects, which were previously associated with the aberrant N-Cadherin expression in Q111 mutant cells,69 were recovered by circHtt(2,3,4,5,6) overexpression. Our analysis of FA characteristics and quantification of N-Cadherin and Vinculin protein levels in Q111/Q111 cells overexpressing circHtt(2,3,4,5,6) on one hand indicate that a global change in FA and cytoskeletal organization may underlie the modulation of the observed cell morphological defects, rather than a direct regulation of transcription/translation of Vinculin and N-Cadherin themselves. On the other hand, Vinculin has over 14 putative binding partners at FA94 and the interaction with those partners is regulated by an auto-inhibitory, intramolecular interaction between its protein head and tail domains.95 The release of this auto-inhibition is believed to require simultaneous binding of multiple ligands.96 Therefore, a direct transcriptional/translational regulatory function of circHtt(2,3,4,5,6) on those Vinculin interacting proteins warrants further investigation.
We furthermore observed an effect of circHtt(2,3,4,5,6) overexpression on MitoTracker aggregate number in Q111/Q111 cells, the MitoTracker orange CMTMRos dye represents an indirect readout of mitochondrial membrane potential.97 Mitochondria, critical organelles that control energy production, lipid metabolism, and Ca2+ signaling and buffering, have been intensely studied in the context of HD, and they occupy an important position in the pathogenesis.98 To explore potential consequences and implications of this circHtt(2,3,4,5,6) overexpression-induced change in number of MitoTracker clusters, we further quantified mitochondrial functionality through a fluorescence-activated cell sorting (FACS)-based as well as RT-qPCR-based approach, directly assessing mitochondrial membrane potential and expression of genes regulating mitochondrial fission and fusion processes crucial for cellular energetic metabolism. We observed clear differences between the Q7/Q7 control and Q7/Q111 and Q111/Q111 mutant cells, however no apparent specific changes upon circHtt(2,3,4,5,6) overexpression. Thus, a tangible link between circHtt(2,3,4,5,6) and the energetic metabolic pathway is still unclear. Additionally, the phenotypes observed and the rescue through circHtt(2,3,4,5,6) overexpression are predominantly measurable in the STHdh Q111/Q111 homozygous mutant context, thus the relevance for the most common heterozygous condition in HD patients needs to be further evaluated. Finally, for all the comparisons presented here, the effect of circHtt(2,3,4,5,6) overexpression in STHdh cells was always evaluated internally, within each genotype, thus avoiding inter-genotypic comparisons that might be affected by the previously reported karyotypic alterations in this model system70; nonetheless, testing the functional impact of circHTT(2,3,4,5,6) modulation in an independent HD model system and directly, in HD patients’ cells, will be certainly needed to further establish its relevance for HD pathophysiology. Due to the extremely high levels reached by circHtt(2,3,4,5,6) overexpression, the informative value on cell physiologic functions remains quite limited. In line with this, circHTT(2,3,4,5,6) overexpression, from an independent study in HEK293T cells, highlighted significant reduction in the nuclear area,89 which could not be validated in our HD-relevant STHdh model system. Taken together, analysis of circHTT(2,3,4,5,6) function at endogenous levels, possibly capitalizing on the newer tools for circRNAs knockdown,62,99,100,101,102 is absolutely imperative to obtain reliable conclusions about its relevance for HD pathophysiology.
In this light, our investigation exploring translation regulation in vivo, using adult mouse brain cytoplasmic extracts, provides a unique, unbiased perspective on the functional properties of endogenous circHtt(2,3,4,5,6) within its proper cellular and tissue context. By polysome fractionation, we could unequivocally establish that circHtt(2,3,4,5,6) is unlikely to be directly translated, since an association with the heavier polysomal fractions was always negligible in wild-type and HD-model mouse brains. While a modest (10%–15%), though reproducible, portion of circHtt(2,3,4,5,6) was associated with the 40S small ribosomal subunit, the vast majority (80%–85%) of it remained localized to the free ribonucleo-particles. Interestingly, this localization was not changed by the increased levels of circHtt(2,3,4,5,6) in the mutant mice. Of note, other circRNAs102 have been reported to partly associate to the 40S fraction, thereby “sponging” important players in translation regulation. On the other hand, other non-coding RNAs, SINEUP molecules, that are able to increase, in a target-specific manner, protein translation, also associate to the 40S ribosomal subunit, sometimes upon stress-response-mediated cellular reshuffling.103,104,105 Thus, our initial observations set the stage for a deeper molecular investigation of the possible functional role of circHTT(2,3,4,5,6) modulation of protein synthesis in the assembly of the translational machinery, in the regulation of cap-independent translation in response to stress, or, indirectly, through binding and sequestration of RBPs and translation regulators. These regulatory mechanisms may be particularly relevant in brain districts where high levels of circRNA molecules are observed, pertinent to HD biology, but also instrumental to unveil a new perspective of circRNA biology, possibly scalable to other RNA circles.
Materials and methods
Mice
HdhQ20 (now HttQ20, B6.129S1(Cg)-Htttm2Mem/20ChdiJ, Stock No. 02741152), knockin mice and zQ175 (now HttQ175; (B6J.129S1-Htttm1Mfc/190ChdiJ Stock No. 02741049) knockin mice were purchased from the Jackson Laboratory. The HttQ20 knockin allele was originally created by Dr. Marcy E. MacDonald (Massachusetts General Hospital) and exhibits a chimeric mouse:human huntingtin exon 1 (Htt:HTT exon 1) encoding the human version of the polyglutamine/polyproline-rich segment with 18 CAG repeats [(CAG)18CAACAG].106 The HdhQ111 (now HttQ111; B6.129-Htttm5Mem/J, Stock No. Strain #:00359852) was provided by Vanessa C. Wheeler, and is different from the HttQ20 knockin line only in the length of the CAG-repeat tract [(CAG)109CAACAG]; The HdhQ20, HdhQ111, and zQ175 knockin mouse lines were maintained through crosses of male C57BL/6J wild-type animals with female knockin animals. Genotyping for the mutant CAG-repeat allele was carried out on extracted DNA from ear-punch biopsies, using the following primers: Hdh CAG1 (Q20, Q111) fw 5′-ATGAAGGCCT TCGAGTCCCTCAAGTCCTTC-3′, rev 5′-GGCGGCTGAGGAAGCTGAGGA-3’; Neo (Q175) fw 5′-CTTGGGTGGAGAGGCTATTC-3′, rev 5′-AGGTGAGATGACAGGAGATC-3’; knockin PCRs were performed using Taq PCR Core Kit (QIAGEN, #201223). For each reaction, positive and negative controls were included. PCR protocols followed the manufacturer’s instructions.
Embryonic time points were determined by plug checks, defining embryonic day (E) 0.5 as the morning after copulation. All mice were housed in groups of 2–5 mice in controlled conditions of temperature (constant at 20°C–22°C), and 12-h light-dark cycles, in individually ventilated cages (Techniplast GreenLine) and pathogen-free (SPF), according to the FELASA 2014 Guidelines. All animal experiments were conducted to minimize pain and discomfort, under approved Institutional Animal Care and Use Committee protocol of the Italian Ministry of Health (project authorization n. 781/2016-PR and 39/2023-PR).
Brain tissue sample collection
We thank Dr. Artur Fabi and his team from the Servizio Veterinario Aziendale Alto Adige, Italy, for providing brain samples from O. aries (n = 2), C. hircus (n = 3), and B. taurus (n = 3). Locally, at the public slaughterhouse, Bolzano, we collected and flash froze samples from the prefrontal cortex of these species at 0 to 3 h postmortem. The public slaughterhouse Valle Isarco SRL provided cortex samples from G. gallus (n = 3). All these animals were already destined to slaughter in the context of routine meat production, thus none were killed exclusively for this study. All animals met the required health and safety standards and received approval for slaughter from an on-site veterinarian on the day of sample collection. Importantly, all animals killed for the procurement of these brain samples were aged a maximum of 12 months at the time they were killed, an age threshold that ensures an absence of safety risks associated with prion diseases in these types of samples. Total RNA from zebrafish whole brain was provided by Maria Caterina Mione’s Laboratory of Experimental Cancer Biology at the Department of Cellular, Computational, and Integrative Biology (CIBIO), whereas Zdenka Ellederova’s Laboratory of Cell Regeneration and Plasticity at the Institute of Animal Psychology and Genetics, Czech Republic, provided brain samples from mini pigs (S. scrofa). Mouse brain samples were obtained upon cervical dislocation and rapid dissection on ice, samples were snap-frozen in liquid N2 and stored at −80°C until use. Human brain RNA was obtained from a commercially available human tissue panel (Clontech # 636643).
Sequence analysis of HTT orthologues
Alignments and HTT orthologous sequences from the selected species (D. rerio, G. gallus, M. musculus, O. aries, C. hircus, B. taurus, and S. scrofa) were obtained through the UCSC genome browser (https://genome.ucsc.edu), an interactive website offering access to genome sequence data from a variety of vertebrate and invertebrate species and major model organisms integrated with a large collection of aligned annotations. For those species whose alignments were not available on this database, the alignments were generated using BLAST.
Primer design
A comprehensive list of all primers used in this study can be found in Table S2. Primers were designed using the NCBI Primer designing tool (https://www.ncbi.nlm.nih.gov/tools/primer-blast). For endpoint PCR, for each species, two divergent primer pairs for the predicted circHTT orthologue sequence, targeting the BSJ, one primer pair for linear HTT orthologue mRNA and one primer pair for a housekeeping gene, were designed/retrieved from the literature. Standard parameters (58°C < Tm < 62°C, amplicon sizes between 90 and 250 bps) were selected. Primers designed in this study were tested for specificity by endpoint PCR and sequencing before use.
RNA extraction
Total RNA was extracted using TRIzol Reagent (Invitrogen) according to the following protocol: frozen tissue (stored at −80°C) was placed together with a homogenization bead and 1 mL of TRIzol Reagent (Invitrogen) and homogenized for 60 s at 30 Hz. Then, fats were precipitated through a centrifugation step (5 min, 12,000 × g at 4°C). The supernatant was mixed with 200 μL of chloroform, vortexed for 15 s, incubated for 2–3 min at room temperature, and centrifuged (15 min at 12,000 × g at 4°C). After phase separation, the aqueous transparent phase was transferred to a new reaction tube and mixed with 1.5 volumes of EtOH 100%, then transferred onto a Zymo-Spin IC column and centrifuged for 20 s at 10,000 × g at room temperature. The column was then washed with 500 μL 70% EtOH. DNAse I treatment was performed on the column using DNase I (Thermo Scientific #89836) (5 U in 50 μL total reaction volume of 70% EtOH) for 15 min at room temperature. Upon two washing steps using 700 μL of 70% EtOH, the column was dried by centrifuging for 1 min at 10,000 × g and total RNA was eluted using RNAse-free H2O. RNA concentration was measured using Thermo Scientific NanoDrop. Subsequently, RNA integrity was either checked through gel electrophoresis (1 μg total RNA separated on a 2% agarose gel in 1 × TBE) or using the Agilent 2100 Bioanalyzer. Total RNA was stored at −80°C until further use.
RNase R treatment
For RNase R experiments, 3 μg of total RNA were either incubated with 1.2 μL Ribonuclease R (RNase R, 500U, ABM #E049) and corresponding buffer (+samples) or with buffer alone (mock - samples), together with 0.2 μL RiboLock (40 U/μL Thermo Scientific #EO0382) in a total volume of 20 μL, at 37°C for 30 min. RNA was then cleaned up using the RNeasy Micro kit (Quiagen #74004) and equal volumes of eluted RNA from treated and mock samples were subsequently reverse transcribed. Upon analysis, ratios between treated and untreated samples were calculated.
cDNA synthesis
Reverse transcription was performed primarily using the iScript cDNA Synthesis Kit (Bio-Rad), except for Figure S2C tests for which the reverse transcriptases RevertAid First Strand cDNA Synthesis Kit (Thermo Scientific #K1621) and Maxima H Minus (Thermo Scientific #EP0753) were used. cDNA synthesis was performed on 1 μg of total RNA according to the manufacturer’s instructions. cDNA samples were diluted 1:5 for following (q)PCR analysis and stored at −20°C.
Endpoint PCR and qRT-PCR
EndPoint PCR was performed using Phusion Green Hot Start II High-Fidelity PCR Master Mix (ThermoFisher #F566L), according to the manufacturer’s protocol. PCR products were run at 100 V for approximately 20–30 min on a 1.5% agarose gel in 1 × TAE. For qRT-PCR, iTaq Universal SYBR Green Supermix (Bio-Rad #1725121) was used, according to the manufacturer’s instructions.
Cell culture and transfection
HEK293T, SH-SY5Y, and mouse striatal (STHdh Q7/7, Q7/111, Q111/111) cells were cultured in DMEM supplemented with 2 mM L-glutamine, 100 U/mL Penicillin/Streptomycin (PenStrep), and 10% fetal bovine serum (FBS). Mouse striatal cell line medium was additionally supplemented with 1 mM sodium pyruvate and 0.5 mg/mL Geneticin and grown at 33°C and 5% CO2. HEK293T and mouse striatal cell lines were transfected by using Lipofectamine 2000 (Invitrogen), according to the manufacturer’s instructions, and were eventually harvested for further analysis at 48/72 h post-transfection, or treated with puromycin to select for stable integration of the ZKSCAN1 empty and circHtt(2,3,4,5,6) overexpression vectors. Polyclonal cells were thereafter passaged 3–5 times for stabilization prior to use in experiments.
Primary neuronal culture
The primary neuronal culture experiments were performed according to Beaudoin et al.107 with few modifications. In brief, pregnant female mice were euthanized through cervical dislocation at embryonic day (E18), the embryos removed from the uterus, placed in ice-cold 1× PBS supplemented with 1× PenStrep, and decapitated with sharp scissors. From each embryo a skin biopsy was collected for subsequent genotyping of the zQ175 allele. Dissection of developing forebrain tissues and removal of meninges was performed rapidly under a stereomicroscope in DMEM without phenol red (Gibco #31053028) with 1× PenStrep, tissue was mechanically fragmented and washed 2× with fresh dissection buffer (tissue fragments were allowed to settle through sedimentation before buffer changes). Tissue was dissociated using 500 μL of 0.25% Trypsin-EDTA in a 37°C water bath for no longer than 15–20 min. Then, DNase 1 was added to the dissociation buffer and incubated for an additional 5 min at room temperature. Dissociation media was carefully removed and the tissue clumps were washed 2× in fresh dissection buffer and 2× in seeding medium (DMEM supplemented with 2 mM L-glutamine, 100 U/mL Penicillin/Streptomycin, and 10% FBS). Then, using fire-polished pasteur pipettes, the tissue pieces were triturated 8–10 times (slowly, avoiding any bubbling) until tissue pieces disappeared. Cell suspension was filtered through a 70-μm cell strainer to obtain single cells. Cell aliquots were counted using Trypan blue to determine (1) viability of the cells and (2) cell numbers, and cells were seeded in seeding medium on either sterilized 10-mm coverslips, coated with PLO/Laminin for staining (5 × 10⁴ cells), or on PLO/Laminin-coated 12-well tissue culture plates for biochemical analysis (20 × 104 cells per well). After 4 h, cells were checked for attachment to the substrate and seeding medium exchanged with neural maintenance medium (Neurobasal medium, Gibco #21103049, supplemented with B27, GlutaMax, and PenStrep). Fifty percent of the medium was then exchanged every 3–4 days for culture maintenance.
Immunofluorescence and imaging
Primary neurons grown on coverslips at DIV-6 or STHdh cells were fixed for 10 min in 4% paraformaldehyde, washed 3× in 1× PBS+/+, permeabilized using 0.25% Triton X-100 in 1× PBS+/+ for 30 min, and blocked in 2% BSA in permeabilization buffer for 30 min at room temperature. Subsequently, overnight incubation with primary antibodies (mouse anti-Tubb3 1:500, GeneTex #GTX85469; rabbit anti-GFAP 1:500, GeneTex #GTX108711; mouse anti-Vinculin 1:200, V9254) in blocking solution was carried out for 12–18 h at 4°C shaking. Upon 3× 5-min washes in 1× PBS+/+ secondary antibody labeling (anti-mouse 594 Invitrogen 1:500, and anti-rabbit 488 GeneTex Daylight 1:500) for 1 h at room temperature was performed. Finally counterstaining with Hoechst (Thermo Scientific, #62249, 1:1000) and 3× 5-min washes concluded the immunofluorescence staining. Coverslips were mounted with FluorSaveTM Reagent (Merck Millipore, #345789) on microscopy slides and images were taken on a Nikon N-SIM+Ax confocal microscope using a 20× air and 60× oil-immersion objective. Quantification of number of Vinculin foci and mean fluorescence intensity per cell was obtained upon cell segmentation and employing a custom written Macro using Fiji image analysis software,108 using the detector module for TrackMate plugin109 that relies on Cellpose.110 Representative images were adjusted for brightness and contrast using Fiji image analysis software.
RNA extraction from primary neurons
RNA extraction from primary neurons was performed using the RNeasy Micro kit (Quiagen #74004) according to manufacturer’s instructions. A total of 700 ng of total RNA was then reverse transcribed using iScript cDNA synthesis kit, see above, and used for qPCR analysis.
ZKSCAN1 overexpression vector and cloning
The pcDNA3.1(+) ZKSCAN1 MCS Exon Vector (Addgene #69901) was kindly provided by Prof. Jeremy Wilusz.68 Briefly, both circHTT(2,3,4,5,6) and circHtt(2,3,4,5,6) were cloned between EcoRV and SacII (ZKSCAN1 MCS Exon) restriction sites. Because STHdh cells already carry a Neomycin resistance gene,45 this selection cassette was replaced in ZKSCAN1 (MCS and circHtt) vectors by exploiting BstBI and SmaI restriction sites and switched with PuroR, which was previously PCR amplified from a pLKO.1 plasmid. Finally, all plasmids were Sanger sequenced to confirm successful cloning of desired sequences.
Northern blot
Northern blot on extracted RNA was performed as previously described.111 For each sample, a total of 20 μg of RNA was denatured at 65°C for 15 min in 2–3 volumes of NorthernMax Formaldehyde Loading Dye, placed on ice to chill for 5 min, and eventually loaded on a 1.2% agarose-formaldehyde gel in northern gel running buffer. After running the gel at 95V for about 3.5 h, the gel was washed twice for 15 min in ultrapure DNase/RNase-free water with gentle shaking, followed by another two washes in 10× saline sodium citrate (SSC) with the same conditions. Capillary transfer to a Hybond-N membrane in 10× SSC was carried out overnight, after which the membrane was cross-linked with UV light and incubated with ULTRAhyb-Oligo buffer at 42°C for at least 45 min, with gentle rotation. During this incubation time, the DNA oligo targeting circHTT(2,3,4,5,6) (5′-TGAGCCAGCTCAGCAAACCTC-3′) was radiolabeled with [γ-32P] by incubating 1.5 μL DNA oligo (10 μM), 2 μL 10× PNK Buffer, 4 μL [γ-32P] ATP, 1 μL T4 polynucleotide kinase, and 11.5 μL ultrapure DNase/RNase-free water at 37°C for 45–60 min. The reaction was halted by incubation at 95°C for 5 min, followed by the removal of any excess of [γ-32P] using Illustra MicroSpin G-50 columns according to the manufacturer’s instructions. Each reaction was then incubated overnight with 15 μL of radiolabeled probes, with gentle rotation. The next day, the membrane was washed twice with a pre-warmed northern wash buffer (2× SSC, 0.5% SDS) for 30 min at 42°C. Last, membranes were imaged using a Phosphorimager.
Protein extraction and western blot analysis
Proteins were extracted using RIPA (Sigma #R0278-50ML) supplemented with Halt Protease and Phosphatase Inhibitor Cocktail (Life #78440). Cells were lysed for 30 min on ice, with vortexing every 5–10 min. Genomic DNA was disrupted using sonication in the Bioruptor Pico sonication device (B01060010), quantified using PIERCE BCA protein assay kit (LifeTech #23225), and 30–50 μg of proteins were prepared for western blot analysis in 10% DTT (1 M) and NuPage 4× Loading dye. Proteins were separated for at least 3 h at 110 V on precast NuPAGE 3%–8% Tris-acetate protein gels (Life #EA0375BOX) in NuPAGE Tris-Acetate SDS Running Buffer (Life #LA0041) and plotted onto PVDF membrane (Amersham Hybond P 0.45 μm #GEH10600023) in Tris-glycine buffer with 5% MeOH at 100 V for 75 min at 4°C. Membranes were blocked for 1 h at room temperature in 5% milk - 1× PBS-Tween and incubated overnight at 4° with primary antibodies. The following primary antibodies were used: anti-Hsp90 (1:1,000, 3C9 monoclonal antibody, Aurogene #BSM-51215M) and anti-Huntingtin (1:2,000, D7F7, Cell Signaling #5656) or (1:2,000, MAB2166, Sigma Aldrich), anti-N-Cadherin (1:2,500, GTX127345, Genetx), and anti-Vinculin (1:2,000, V9254). Upon washes 3 × 10 min in 1× PBS-Tween, membranes were incubated for 1 h at room temperature with species-specific secondary antibodies conjugated to HRP (1:10,000) in milk and developed using ECL Select WB detection reagent (Amersham) on a Chemidoc Imaging system (Bio-Rad). Western blots were quantified using Fiji.
Subcellular fractionation
To perform subcellular fractionations, we employed a published protocol with few modifications.112 All steps were performed leaving cells on ice and using a refrigerated centrifuge. The cells were washed three times with ice-cold 1× PBS, then resuspended in 380 μL of ice-cold hypotonic lysis buffer (HLB, 10 mM Tris-HCl pH 7.5, 10 mM NaCl, 3 mM MgCl2, 0.3% NP-40 [vol/vol] and 10% glycerol [vol/vol]) and incubated for 30 min in ice, with occasional vortexing. After that, the cells were centrifuged at 1,000 × g for 5′ at 4°C, the supernatant (cytoplasmic RNA fraction) was carefully isolated and centrifuged again for 5′ at >5,000 × g to pellet any residues, and 1 mL of RNA precipitating solution (0.5 Ll 3M sodium acetate pH 5.5, 9.5 mL 100% ethanol) was added to the cytoplasmic fraction, which was eventually incubated at −20°C for >1 h. The nuclei pellet was instead washed three times with ice-cold HLB and 1 mL of Trizol was added to the semi-dry pellet. After >1 h at −20°C, the cytoplasmic fraction was centrifuged at 18,000 × g for 15 min at 4°C, then the supernatant was removed and the RNA pellet was resuspended in 1 mL of Trizol. RNA was finally extracted following the manufacturer’s protocol.
Cell painting assay
Cells and live-cell staining
STHdh cells were seeded in STHdh complete medium into 96-well Cell Carrier plates at a density of 4,000–6,000 live cells per well, approximately 24 h before staining. On the day of the cell painting assay, cells were incubated with Hoechst (Thermo Scientific, #62249, 1:1,000), Calcein GREEN-AM (Invitrogen, #C3099, 1:2,000), and MitoTracker orange CMTMRos (Invitrogen, #M7510, 1:1,000) for 1 h at 33°C prior to imaging.
Imaging and data analysis
Image acquisition was performed using ImageXpress Micro Confocal High Content System (Molecular Devices, LLC). Maximum intensity projection of four z stack images per well (six FOV) were acquired with 20× Plan Apo Lambda 0.75NA objective in confocal mode for three channels: Hoechst – Blue Ex 377/54 and Em 432/36, Calcein-AM Green Ex 475/28 Em 536/40, and MitoTracker- Orange Ex 555/28 and Em 600/37. Images were analyzed using the Custom Module extension of MetaXpress 6.7.2.290 (Molecular Devices, LLC). Nuclei were counted based on the Hoechst staining, the cytosolic region was identified from Calcein-AM staining, and mitochondrial aggregates were segmented using MitoTracker staining. The following parameters were measured and extracted per single-cell object: cell counting, the nuclear and cellular area, nuclear and cellular shape, the number of mitochondrial aggregates in the cytoplasm compartment, and their fluorescence intensity. The total number of cells and the mean of the phenotypic parameters per well were then calculated, features presented in this article. Representative images in Figures 5 and S5 were adjusted for brightness and contrast using Fiji image analysis software. The following parameters are reported:
-
(1)
Cell and Nuclear Area
-
(2)
Cell and Nuclear Shape Factor: A value from zero to one that represents how closely the object represents a circle. A value close to zero indicates that the object is flat, whereas a value of one indicates that the object or feature is a perfect circle.
-
(3)
Average Intensity: The average of all the intensity values for the pixels in the object or feature.
Flow cytometry
Single-cell suspensions of 150,000 STHdh live cells were stained in a volume of 200 μL complete media at a final concentration of 75 μM for 20 min at 33°C. Cells were washed 3× with FACS Buffer (1× PBS, 2.5% FBS, 4% glucose, 1× Glutamax, and 1× PenStrep) and placed on ice until analysis on a BD FACSymphony A1 Cell Analyzer. Data were analyzed employing FlowJo VX. In brief, upon gating for single cells, all conditions corresponding to the individual genotypes (i.e., untransfected, MCS, circHtt OE) were analyzed together, gating for high vs. low fluorescence intensity of the MitoStatus dye.
RBP motif prediction
miRNA binding sites were predicted by using the TargetScan Perl Script,113 using as input the mature circRNA sequences alongside the miRNA sequences retrieved from miRBase.114 The CircInteractome web tool, developed by Dudekula et al.,63 integrates information available on various online databases in order to facilitate the study of circRNAs and their interactions with other factors, mainly focusing on RBPs and miRNAs. First, circRNAs’ information (i.e., ID, coordinates, and best transcript) was recovered from the online database circBase.115 The mature sequences, along with upstream and downstream regions of 1,000 bp, were obtained from the UCSC genome browser mirror.116 Next, the datasets for RBPs identified by PAR-CLIP, HITS-CLIP, or iCLIP were retrieved from starBase v2.0,117 UCSC browser, and published datasets. Last, to predict RBP binding sites, the sequences of these RBP CLIP clusters were analyzed against the mature circRNAs (back-splice junctions included) and the flanking sequences.
Polysome profiling
Tissue lysis
Cytoplasmic lysates from mouse brain tissue (one brain hemisphere per animal) were obtained following a protocol presented by Bernabò et al.118 Mortar and pestle immersed in liquid nitrogen were used to pulverize frozen tissues. Following this step, 800 μL of mouse tissue polysomal lysis buffer (10 mM Tris-HCl pH 7.5, 10 mM MgCl2, 10 mM NaCl, 1% Triton X-100, 5 U/mL DNase I [Thermo Scientific #89836], 600 U/mL RiboLock RNase Inhibitor [Thermo Scientific], 1 mM DTT, 0.2 mg/mL cycloheximide, 1% w/V Na-deoxycholate) was added. Samples were resuspended 30 times until the powder was completely dissolved in the lysis buffer and they were incubated 30 min on ice to allow lysis to occur. Lysates were centrifuged for 10 min at 15,249 × g (4°C) to pellet membrane debris, nuclei, and mitochondria. After supernatant collection, the centrifugation step was repeated. Cytoplasmic lysates were collected and loaded on sucrose gradient for polysome profile analysis.
Polysome profiling
A total of 5.5 mL of ice-cold 40% w/v sucrose in Buffer A (100 mM NaCl, 10 mM MgCl2, 10 mM Tris/HCl pH 7.5, 40% w/V sucrose) was added to 13.2 mL polyallomer ultracentrifuge tubes (Beckman) avoiding bubble formation. Tubes were filled with cold 10% w/v sucrose in Buffer A (100 mM NaCl, 10 mM MgCl2, 10 mM Tris/HCl pH 7.5, 10% w/v sucrose). To allow the formation of a continuous gradient, tubes were tilted to the horizontal position and kept in this position for 2 h. The gradients were then brought back to the vertical position and kept on ice. Samples were loaded on the top of the gradient and ultracentrifuged for 1.5 h at 40,000 rpm at 4°C on Beckman Optima XPN-100 Ultracentrifuge with SW41 rotor. Following ultracentrifugation, Teledyne ISCO model 160 fractionator, equipped with a UA-6 UV/VIS detector to measure absorbance at 254 nm, was used to fractionate and collect 12 fractions of 1 mL each.
RNA extraction from polysome fractions
Ten percent of each fraction was collected and pooled as “input” sample for RNA extraction and subsequent analysis. RNA extraction was performed using Acid-Phenol:Chloroform (AM9720). In brief, polysome fractions were incubated with SDS (final conc. 1%) and Proteinase K (final conc. 200 μg/mL) for 2 h at 37°C. Then, 250 μL of Acid-Phenol:Chloroform was added to each 1-mL fraction and mixed thoroughly, followed by a 10-min centrifugation step at 12,750 × g at 4°C. Upon phase separation, the upper aqueous phase was transferred to a new tube and mixed with the 1 mL isopropanol and 1 μL Glycogen blue, RNA was precipitated overnight at −80° and RNA pellets collected by centrifugation at 15,300 × g for 45 min at 4°C. RNA pellets were dried, washed in 80% EtOH, centrifuged for 10 min at 12,750 × g at 4°C, dried for 30 min, and solubilized in 11.5 μL RNase-free water. RNA concentrations were determined using a Thermo Scientific NanoDrop.
cDNA synthesis for RNA extracted from polysome fractions
Reverse transcription was performed on 8 μL RNA from each fraction (independent of concentrations) using the RevertAid First Strand cDNA Synthesis (#K1621), according to the manufacturer’s protocol and including the DNase 1 treatment step using 0.5 μL DNase 1 per reaction. From the “input” sample: 1 μg of total RNA was reverse transcribed, that sample was also used as –RT control. For follow-up qPCR analysis, cDNA was 1:5 diluted.
Polysome fractionation: Data analysis
The relative distribution of RNAs of interest was measured as described in Lauria et al.119
To measure the relative distribution of circHtt(2,3,4,5,6) and mRNAs along a polysome profile, the following formula was used: .
Where n is the number of fraction and % is the percentage of RNA (circHtt(2,3,4,5,6), 18S or mRNA) of interest in fraction n. Ct RNA is the Ct of each RNA in each fraction.
Statistics
Statistical analyses were performed using Microsoft Excel 2016, and GraphPad Prism10. The D’Agostino-Pearson normality test was used to evaluate data distribution, means, and standard deviations of the data. Where applicable, i.e., cell painting and Vinculin analysis, outliers were identified and excluded using the ROUT (Q = 1%) method. Parametric data were analyzed for significance using unpaired two-tailed t tests, 1-way or 2-way ANOVAs with Sidak’s post hoc test, using ∗p < 0.05, ∗∗p < 0.01, and ∗∗∗p < 0.001 for significance, and presented as bar, box and whiskers, scatter dot plots, and mean ± standard error of the mean (SEM), unless otherwise specified. Single-cell data are presented as violin plots with median and quartiles. Simple linear regressions and comparisons between slopes were furthermore performed. Datasets with non-normal distributions were analyzed using the two-tailed Mann-Whitney U test or Kruskal-Wallis test. Adjustments for multiple comparisons were made using post hoc tests.
Data and code availability
The authors declare that all data supporting the findings of this study are available within the paper and its supplemental information files. Raw imaging data, as well as Fiji software Macro for automated Vinculin analysis are available upon reasonable request.
Acknowledgments
We thank Pamela Gatto, Michael Pancher, and Viktoryia Sidarovich of the HTS and Validation Core Facility, Dept. CIBIO UniTN, for their help and advice in designing, imaging, and analyzing the cell painting assay as well as all the fruitful discussions. We thank the Cell Analysis & Separation core facility members, Isabella Pesce and Alessandro Matté, Dept. CIBIO UniTN, for assistance as well as Michela Roccuzzo of the Advanced Imaging Core Facility, Dept. CIBIO UniTN, for writing the Macro to analyze Vinculin characteristics in single cells. We thank Dr. Artur Fabi and his team (Dr. Harald Stuefer and Dr. Ilda Idrizi) from the Servizio Veterinario Aziendale Alto Adige, Italy, for providing access to brain samples from different vertebrate species. This work was supported by the University of Trento, the Huntington Society of Canada’s NEW PATHWAYS award, the European Huntington's Disease Network (EHDN) seed fund project #1041 and the Hereditary Disease Foundation research grant #990845 to M.B. M.B. was also a recipient of a Marie Skłodowska Curie reintegration fellowship (the European Union’s Horizon 2020 Research and Innovation Program, GA n 706567). J.M. was/is supported by an EMBO postdoctoral fellowship (ALTF 897-2021) and by the European Union (under GA n 101062297- BrainCircHD). J.D. was supported by a Seal of Excellence Fellowship by the University of Trento pd. 17/21 – MSCA – SOE – C3A (SAP 40600233). This work was further supported by National Institutes of Health grant R35-GM119735 (to J.E.W.) and Cancer Prevention & Research Institute of Texas grant RR210031 (to J.E.W.). J.E.W. is a CPRIT Scholar in Cancer Research. Department CIBIO Core Facilities are supported by the European Regional Development Fund (ERDF) 2014–2020 and 2021–2027.
Author contributions
M.B. conceived and supervised the study. J.M. designed and performed experiments, analyzed data, and prepared figures; A. Monziani, J.D., C.O.P., and T.T. performed experiments and data analysis; M.L., M.P., A. Mattiello, and D.B. performed experiments under the supervision of J.M.; G.V. and D.D. supervised polysome profiling and data analysis; A.D'A., G.B., V.B.M., M.K., J.R., V.C.W., and Z.E. provided resources; C.D. and E.D. performed data analysis; J.E.W. provided the ZKSCAN1 vector and performed northern blot. J.M. wrote the paper together with M.B. All authors read and approved the final version of the manuscript.
Declaration of interests
J.E.W. serves as a consultant for Laronde. V.C.W. was a founding scientific advisory board member with financial interest in Triplet Therapeutics Inc. Her financial interests were reviewed and are managed by Massachusetts General Hospital and Mass General Brigham in accordance with their conflict-of-interest policies. She is a scientific advisory board member of LoQus23 Therapeutics Ltd. and has provided paid consulting services to Acadia Pharmaceuticals Inc., Alnylam Inc., Biogen Inc., Passage Bio, and Rgenta Therapeutics. She has received research support from Pfizer Inc.
Footnotes
Supplemental information can be found online at https://doi.org/10.1016/j.omtn.2024.102234.
Supplemental information
References
- 1.McClung C.A., Nestler E.J. Neuroplasticity Mediated by Altered Gene Expression. Neuropsychopharmacology. 2008;33:3–17. doi: 10.1038/sj.npp.1301544. [DOI] [PubMed] [Google Scholar]
- 2.Blair J.D., Hockemeyer D., Doudna J.A., Bateup H.S., Floor S.N. Widespread Translational Remodeling during Human Neuronal Differentiation. Cell Rep. 2017;21:2005–2016. doi: 10.1016/j.celrep.2017.10.095. [DOI] [PMC free article] [PubMed] [Google Scholar]
- 3.Li Q., Lee J.-A., Black D.L. Neuronal regulation of alternative pre-mRNA splicing. Nat. Rev. Neurosci. 2007;8:819–831. doi: 10.1038/nrn2237. [DOI] [PubMed] [Google Scholar]
- 4.Su C.-H., D D., Tarn W.-Y. Alternative Splicing in Neurogenesis and Brain Development. Front. Mol. Biosci. 2018;5:12. doi: 10.3389/fmolb.2018.00012. [DOI] [PMC free article] [PubMed] [Google Scholar]
- 5.Raj B., Blencowe B.J. Alternative Splicing in the Mammalian Nervous System: Recent Insights into Mechanisms and Functional Roles. Neuron. 2015;87:14–27. doi: 10.1016/j.neuron.2015.05.004. [DOI] [PubMed] [Google Scholar]
- 6.Jeck W.R., Sorrentino J.A., Wang K., Slevin M.K., Burd C.E., Liu J., Marzluff W.F., Sharpless N.E. Circular RNAs are abundant, conserved, and associated with ALU repeats. RNA. 2013;19:141–157. doi: 10.1261/rna.035667.112. [DOI] [PMC free article] [PubMed] [Google Scholar]
- 7.Memczak S., Jens M., Elefsinioti A., Torti F., Krueger J., Rybak A., Maier L., Mackowiak S.D., Gregersen L.H., Munschauer M., et al. Circular RNAs are a large class of animal RNAs with regulatory potency. Nature. 2013;495:333–338. doi: 10.1038/nature11928. [DOI] [PubMed] [Google Scholar]
- 8.Hansen T.B., Jensen T.I., Clausen B.H., Bramsen J.B., Finsen B., Damgaard C.K., Kjems J. Natural RNA circles function as efficient microRNA sponges. Nature. 2013;495:384–388. doi: 10.1038/nature11993. [DOI] [PubMed] [Google Scholar]
- 9.Ashwal-Fluss R., Meyer M., Pamudurti N.R., Ivanov A., Bartok O., Hanan M., Evantal N., Memczak S., Rajewsky N., Kadener S. circRNA biogenesis competes with pre-mRNA splicing. Mol. Cell. 2014;56:55–66. doi: 10.1016/j.molcel.2014.08.019. [DOI] [PubMed] [Google Scholar]
- 10.Holdt L.M., Kohlmaier A., Teupser D. Molecular roles and function of circular RNAs in eukaryotic cells. Cell. Mol. Life Sci. 2018;75:1071–1098. doi: 10.1007/s00018-017-2688-5. [DOI] [PMC free article] [PubMed] [Google Scholar]
- 11.Abdelmohsen K., Panda A.C., Munk R., Grammatikakis I., Dudekula D.B., De S., Kim J., Noh J.H., Kim K.M., Martindale J.L., Gorospe M. Identification of HuR target circular RNAs uncovers suppression of PABPN1 translation by CircPABPN1. RNA Biol. 2017;14:361–369. doi: 10.1080/15476286.2017.1279788. [DOI] [PMC free article] [PubMed] [Google Scholar]
- 12.Li Z., Huang C., Bao C., Chen L., Lin M., Wang X., Zhong G., Yu B., Hu W., Dai L., et al. Exon-intron circular RNAs regulate transcription in the nucleus. Nat. Struct. Mol. Biol. 2015;22:256–264. doi: 10.1038/nsmb.2959. [DOI] [PubMed] [Google Scholar]
- 13.Qin M., Wei G., Sun X. Circ-UBR5: An exonic circular RNA and novel small nuclear RNA involved in RNA splicing. Biochem. Biophys. Res. Commun. 2018;503:1027–1034. doi: 10.1016/j.bbrc.2018.06.112. [DOI] [PubMed] [Google Scholar]
- 14.Legnini I., Di Timoteo G., Rossi F., Morlando M., Briganti F., Sthandier O., Fatica A., Santini T., Andronache A., Wade M., et al. Circ-ZNF609 Is a Circular RNA that Can Be Translated and Functions in Myogenesis. Mol. Cell. 2017;66:22–37.e9. doi: 10.1016/j.molcel.2017.02.017. [DOI] [PMC free article] [PubMed] [Google Scholar]
- 15.Rybak-Wolf A., Stottmeister C., Glažar P., Jens M., Pino N., Giusti S., Hanan M., Behm M., Bartok O., Ashwal-Fluss R., et al. Circular RNAs in the Mammalian Brain Are Highly Abundant, Conserved, and Dynamically Expressed. Mol. Cell. 2015;58:870–885. doi: 10.1016/j.molcel.2015.03.027. [DOI] [PubMed] [Google Scholar]
- 16.Gruner H., Cortés-López M., Cooper D.A., Bauer M., Miura P. CircRNA accumulation in the aging mouse brain. Sci. Rep. 2016;6 doi: 10.1038/srep38907. [DOI] [PMC free article] [PubMed] [Google Scholar]
- 17.Gokool A., Anwar F., Voineagu I. The Landscape of Circular RNA Expression in the Human Brain. Biol. Psychiatry. 2020;87:294–304. doi: 10.1016/j.biopsych.2019.07.029. [DOI] [PubMed] [Google Scholar]
- 18.Licatalosi D.D., Darnell R.B. Splicing Regulation in Neurologic Disease. Neuron. 2006;52:93–101. doi: 10.1016/j.neuron.2006.09.017. [DOI] [PubMed] [Google Scholar]
- 19.Mehta S.L., Dempsey R.J., Vemuganti R. Role of circular RNAs in brain development and CNS diseases. Prog. Neurobiol. 2020;186 doi: 10.1016/j.pneurobio.2020.101746. [DOI] [PMC free article] [PubMed] [Google Scholar]
- 20.The Huntington’s Disease Collaborative Research Group A novel gene containing a trinucleotide repeat that is expanded and unstable on Huntington’s disease chromosomes. Cell. 1993;72:971–983. doi: 10.1016/0092-8674(93)90585-e. [DOI] [PubMed] [Google Scholar]
- 21.Wicht H., Lacalli T.C. The nervous system of amphioxus : structure, development, and evolutionary significance. Can. J. Zool. 2005;83:122–150. [Google Scholar]
- 22.Hinman V.F., Burke R.D. Embryonic neurogenesis in echinoderms. WIREs Dev. Biol. 2018;7 doi: 10.1002/wdev.316. [DOI] [PubMed] [Google Scholar]
- 23.Tartari M., Gissi C., Lo Sardo V., Zuccato C., Picardi E., Pesole G., Cattaneo E. Phylogenetic Comparison of Huntingtin Homologues Reveals the Appearance of a Primitive polyQ in Sea Urchin. Mol. Biol. Evol. 2008;25:330–338. doi: 10.1093/molbev/msm258. [DOI] [PubMed] [Google Scholar]
- 24.Candiani S., Pestarino M., Cattaneo E., Tartari M. Characterization, developmental expression and evolutionary features of the huntingtin gene in the amphioxus Branchiostoma floridae. BMC Dev. Biol. 2007;7:127. doi: 10.1186/1471-213X-7-127. [DOI] [PMC free article] [PubMed] [Google Scholar]
- 25.Iennaco R., Formenti G., Trovesi C., Rossi R.L., Zuccato C., Lischetti T., Bocchi V.D., Scolz A., Martínez-Labarga C., Rickards O., et al. The evolutionary history of the polyQ tract in huntingtin sheds light on its functional pro-neural activities. Cell Death Differ. 2022;29:293–305. doi: 10.1038/s41418-021-00914-9. [DOI] [PMC free article] [PubMed] [Google Scholar]
- 26.Labbadia J., Morimoto R.I. Huntington’s disease: underlying molecular mechanisms and emerging concepts. Trends Biochem. Sci. 2013;38:378–385. doi: 10.1016/j.tibs.2013.05.003. [DOI] [PMC free article] [PubMed] [Google Scholar]
- 27.Gil J.M., Rego A.C. Mechanisms of neurodegeneration in Huntington’s disease. Eur. J. Neurosci. 2008;27:2803–2820. doi: 10.1111/j.1460-9568.2008.06310.x. [DOI] [PubMed] [Google Scholar]
- 28.Bassi S., Tripathi T., Monziani A., Di Leva F., Biagioli M. Epigenetics of Huntington’s Disease. Adv. Exp. Med. Biol. 2017;978:277–299. doi: 10.1007/978-3-319-53889-1_15. [DOI] [PubMed] [Google Scholar]
- 29.Ayyildiz D., Bergonzoni G., Monziani A., Tripathi T., Döring J., Kerschbamer E., Di Leva F., Pennati E., Donini L., Kovalenko M., et al. CAG repeat expansion in the Huntington’s disease gene shapes linear and circular RNAs biogenesis. PLoS Genet. 2023;19 doi: 10.1371/journal.pgen.1010988. [DOI] [PMC free article] [PubMed] [Google Scholar]
- 30.Faber P.W., Barnes G.T., Srinidhi J., Chen J., Gusella J.F., MacDonald M.E. Huntingtin interacts with a family of WW domain proteins. Hum. Mol. Genet. 1998;7:1463–1474. doi: 10.1093/hmg/7.9.1463. [DOI] [PubMed] [Google Scholar]
- 31.Passani L.A., Bedford M.T., Faber P.W., McGinnis K.M., Sharp A.H., Gusella J.F., Vonsattel J.P., MacDonald M.E. Huntingtin’s WW domain partners in Huntington’s disease post-mortem brain fulfill genetic criteria for direct involvement in Huntington’s disease pathogenesis. Hum. Mol. Genet. 2000;9:2175–2182. doi: 10.1093/hmg/9.14.2175. [DOI] [PubMed] [Google Scholar]
- 32.Jiang Y.-J., Che M.-X., Yuan J.-Q., Xie Y.-Y., Yan X.-Z., Hu H.-Y. Interaction with polyglutamine-expanded huntingtin alters cellular distribution and RNA processing of huntingtin yeast two-hybrid protein A (HYPA) J. Biol. Chem. 2011;286:25236–25245. doi: 10.1074/jbc.M110.216333. [DOI] [PMC free article] [PubMed] [Google Scholar]
- 33.Sathasivam K., Neueder A., Gipson T.A., Landles C., Benjamin A.C., Bondulich M.K., Smith D.L., Faull R.L.M., Roos R.A.C., Howland D., et al. Aberrant splicing of HTT generates the pathogenic exon 1 protein in Huntington disease. Proc. Natl. Acad. Sci. USA. 2013;110:2366–2370. doi: 10.1073/pnas.1221891110. [DOI] [PMC free article] [PubMed] [Google Scholar]
- 34.Lin L., Park J.W., Ramachandran S., Zhang Y., Tseng Y.-T., Shen S., Waldvogel H.J., Curtis M.A., Faull R.L.M., Troncoso J.C., et al. Transcriptome sequencing reveals aberrant alternative splicing in Huntington’s disease. Hum. Mol. Genet. 2016;25:3454–3466. doi: 10.1093/hmg/ddw187. [DOI] [PMC free article] [PubMed] [Google Scholar]
- 35.Wilusz J.E. Repetitive elements regulate circular RNA biogenesis. Mob. Genet. Elements. 2015;5:1–7. doi: 10.1080/2159256X.2015.1045682. [DOI] [PMC free article] [PubMed] [Google Scholar]
- 36.Hughes A.C., Mort M., Elliston L., Thomas R.M., Brooks S.P., Dunnett S.B., Jones L. Identification of Novel Alternative Splicing Events in the Huntingtin Gene and Assessment of the Functional Consequences Using Structural Protein Homology Modelling. J. Mol. Biol. 2014;426:1428–1438. doi: 10.1016/j.jmb.2013.12.028. [DOI] [PubMed] [Google Scholar]
- 37.Labadorf A.T., Myers R.H. Evidence of Extensive Alternative Splicing in Post Mortem Human Brain HTT Transcription by mRNA Sequencing. PLoS One. 2015;10 doi: 10.1371/journal.pone.0141298. [DOI] [PMC free article] [PubMed] [Google Scholar]
- 38.Chung D.W., Rudnicki D.D., Yu L., Margolis R.L. A natural antisense transcript at the Huntington’s disease repeat locus regulates HTT expression. Hum. Mol. Genet. 2011;20:3467–3477. doi: 10.1093/hmg/ddr263. [DOI] [PMC free article] [PubMed] [Google Scholar]
- 39.Maass P.G., Glažar P., Memczak S., Dittmar G., Hollfinger I., Schreyer L., Sauer A.V., Toka O., Aiuti A., Luft F.C., Rajewsky N. A map of human circular RNAs in clinically relevant tissues. J. Mol. Med. 2017;95:1179–1189. doi: 10.1007/s00109-017-1582-9. [DOI] [PMC free article] [PubMed] [Google Scholar]
- 40.Chen L.-L., Bindereif A., Bozzoni I., Chang H.Y., Matera A.G., Gorospe M., Hansen T.B., Kjems J., Ma X.-K., Pek J.W., et al. A guide to naming eukaryotic circular RNAs. Nat. Cell Biol. 2023;25:1–5. doi: 10.1038/s41556-022-01066-9. [DOI] [PMC free article] [PubMed] [Google Scholar]
- 41.Rahimi K., Venø M.T., Dupont D.M., Kjems J. Nanopore sequencing of brain-derived full-length circRNAs reveals circRNA-specific exon usage, intron retention and microexons. Nat. Commun. 2021;12:4825. doi: 10.1038/s41467-021-24975-z. [DOI] [PMC free article] [PubMed] [Google Scholar]
- 42.Kohany O., Gentles A.J., Hankus L., Jurka J. Annotation, submission and screening of repetitive elements in Repbase: RepbaseSubmitter and Censor. BMC Bioinf. 2006;7:474. doi: 10.1186/1471-2105-7-474. [DOI] [PMC free article] [PubMed] [Google Scholar]
- 43.Sugathan A., Biagioli M., Golzio C., Erdin S., Blumenthal I., Manavalan P., Ragavendran A., Brand H., Lucente D., Miles J., et al. CHD8 regulates neurodevelopmental pathways associated with autism spectrum disorder in neural progenitors. Proc. Natl. Acad. Sci. USA. 2014;111:E4468–E4477. doi: 10.1073/pnas.1405266111. [DOI] [PMC free article] [PubMed] [Google Scholar]
- 44.Trettel F., Rigamonti D., Hilditch-Maguire P., Wheeler V.C., Sharp A.H., Persichetti F., Cattaneo E., MacDonald M.E. Dominant phenotypes produced by the HD mutation in STHdhQ111 striatal cells. Hum. Mol. Genet. 2000;9:2799–2809. doi: 10.1093/hmg/9.19.2799. [DOI] [PubMed] [Google Scholar]
- 45.Cattaneo E., Conti L. Generation and characterization of embryonic striatal conditionally immortalized ST14A cells. J. Neurosci. Res. 1998;53:223–234. doi: 10.1002/(SICI)1097-4547(19980715)53:2<223::AID-JNR11>3.0.CO;2-7. [DOI] [PubMed] [Google Scholar]
- 46.Dodbele S., Mutlu N., Wilusz J.E. Best practices to ensure robust investigation of circular RNAs: pitfalls and tips. EMBO Rep. 2021;22 doi: 10.15252/embr.202052072. [DOI] [PMC free article] [PubMed] [Google Scholar]
- 47.Wang K., Bai X., Xue Y., Luo X., Dong J., Yang G., Ma K., Huang L., Zhou J., Wang J. Absolute quantification of circRNA using digital reverse transcription-hyperbranched rolling circle amplification. Sensor. Actuator. B Chem. 2023;375 doi: 10.1016/j.snb.2022.132893. [DOI] [Google Scholar]
- 48.Zuker M. Mfold web server for nucleic acid folding and hybridization prediction. Nucleic Acids Res. 2003;31:3406–3415. doi: 10.1093/nar/gkg595. [DOI] [PMC free article] [PubMed] [Google Scholar]
- 49.Menalled L.B., Kudwa A.E., Miller S., Fitzpatrick J., Watson-Johnson J., Keating N., Ruiz M., Mushlin R., Alosio W., McConnell K., et al. Comprehensive Behavioral and Molecular Characterization of a New Knock-In Mouse Model of Huntington’s Disease: zQ175. PLoS One. 2012;7 doi: 10.1371/journal.pone.0049838. [DOI] [PMC free article] [PubMed] [Google Scholar]
- 50.Neueder A., Landles C., Ghosh R., Howland D., Myers R.H., Faull R.L.M., Tabrizi S.J., Bates G.P. The pathogenic exon 1 HTT protein is produced by incomplete splicing in Huntington’s disease patients. Sci. Rep. 2017;7:1307. doi: 10.1038/s41598-017-01510-z. [DOI] [PMC free article] [PubMed] [Google Scholar]
- 51.Southwell A.L., Smith-Dijak A., Kay C., Sepers M., Villanueva E.B., Parsons M.P., Xie Y., Anderson L., Felczak B., Waltl S., et al. An enhanced Q175 knock-in mouse model of Huntington disease with higher mutant huntingtin levels and accelerated disease phenotypes. Hum. Mol. Genet. 2016;25:3654–3675. doi: 10.1093/hmg/ddw212. [DOI] [PMC free article] [PubMed] [Google Scholar]
- 52.Wheeler V.C., Auerbach W., White J.K., Srinidhi J., Auerbach A., Ryan A., Duyao M.P., Vrbanac V., Weaver M., Gusella J.F., et al. Length-dependent gametic CAG repeat instability in the Huntington’s disease knock-in mouse. Hum. Mol. Genet. 1999;8:115–122. doi: 10.1093/hmg/8.1.115. [DOI] [PubMed] [Google Scholar]
- 53.Piwecka M., Glažar P., Hernandez-Miranda L.R., Memczak S., Wolf S.A., Rybak-Wolf A., Filipchyk A., Klironomos F., Cerda Jara C.A., Fenske P., et al. Loss of a mammalian circular RNA locus causes miRNA deregulation and affects brain function. Science. 2017;357 doi: 10.1126/science.aam8526. [DOI] [PubMed] [Google Scholar]
- 54.Hollensen A.K., Thomsen H.S., Lloret-Llinares M., Kamstrup A.B., Jensen J.M., Luckmann M., Birkmose N., Palmfeldt J., Jensen T.H., Hansen T.B., Damgaard C.K. circZNF827 nucleates a transcription inhibitory complex to balance neuronal differentiation. Elife. 2020;9 doi: 10.7554/eLife.58478. [DOI] [PMC free article] [PubMed] [Google Scholar]
- 55.Venø M.T., Hansen T.B., Venø S.T., Clausen B.H., Grebing M., Finsen B., Holm I.E., Kjems J. Spatio-temporal regulation of circular RNA expression during porcine embryonic brain development. Genome Biol. 2015;16:245. doi: 10.1186/s13059-015-0801-3. [DOI] [PMC free article] [PubMed] [Google Scholar]
- 56.Humbert S. Is Huntington disease a developmental disorder? EMBO Rep. 2010;11:899. doi: 10.1038/embor.2010.182. [DOI] [PMC free article] [PubMed] [Google Scholar]
- 57.Lee J.K., Mathews K., Schlaggar B., Perlmutter J., Paulsen J.S., Epping E., Burmeister L., Nopoulos P. Measures of growth in children at risk for Huntington disease. Neurology. 2012;79:668–674. doi: 10.1212/WNL.0b013e3182648b65. [DOI] [PMC free article] [PubMed] [Google Scholar]
- 58.Nopoulos P.C., Aylward E.H., Ross C.A., Mills J.A., Langbehn D.R., Johnson H.J., Magnotta V.A., Pierson R.K., Beglinger L.J., Nance M.A., et al. Smaller intracranial volume in prodromal Huntington’s disease: evidence for abnormal neurodevelopment. Brain. 2011;134:137–142. doi: 10.1093/brain/awq280. [DOI] [PMC free article] [PubMed] [Google Scholar]
- 59.Barnat M., Capizzi M., Aparicio E., Boluda S., Wennagel D., Kacher R., Kassem R., Lenoir S., Agasse F., Braz B.Y., et al. Huntington’s disease alters human neurodevelopment. Science. 2020;369:787–793. doi: 10.1126/science.aax3338. [DOI] [PMC free article] [PubMed] [Google Scholar]
- 60.Qin X., Jiang Y., Tse Y.C., Wang Y., Wong T.P., Paudel H.K. Early Growth Response 1 (Egr-1) Regulates N-Methyl-d-aspartate Receptor (NMDAR)-dependent Transcription of PSD-95 and α-Amino-3-hydroxy-5-methyl-4-isoxazole Propionic Acid Receptor (AMPAR) Trafficking in Hippocampal Primary Neurons. J. Biol. Chem. 2015;290:29603–29616. doi: 10.1074/jbc.M115.668889. [DOI] [PMC free article] [PubMed] [Google Scholar]
- 61.Kaur P., Karolina D.S., Sepramaniam S., Armugam A., Jeyaseelan K. Expression Profiling of RNA Transcripts during Neuronal Maturation and Ischemic Injury. PLoS One. 2014;9 doi: 10.1371/journal.pone.0103525. [DOI] [PMC free article] [PubMed] [Google Scholar]
- 62.Seeler S., Andersen M.S., Sztanka-Toth T., Rybiczka-Tešulov M., Van Den Munkhof M.H., Chang C.-C., Maimaitili M., Venø M.T., Hansen T.B., Pasterkamp R.J., et al. A Circular RNA Expressed from the FAT3 Locus Regulates Neural Development. Mol. Neurobiol. 2023;60:3239–3260. doi: 10.1007/s12035-023-03253-7. [DOI] [PMC free article] [PubMed] [Google Scholar]
- 63.Dudekula D.B., Panda A.C., Grammatikakis I., De S., Abdelmohsen K., Gorospe M. CircInteractome: A web tool for exploring circular RNAs and their interacting proteins and microRNAs. RNA Biol. 2016;13:34–42. doi: 10.1080/15476286.2015.1128065. [DOI] [PMC free article] [PubMed] [Google Scholar]
- 64.Ray D., Kazan H., Cook K.B., Weirauch M.T., Najafabadi H.S., Li X., Gueroussov S., Albu M., Zheng H., Yang A., et al. A compendium of RNA-binding motifs for decoding gene regulation. Nature. 2013;499:172–177. doi: 10.1038/nature12311. [DOI] [PMC free article] [PubMed] [Google Scholar]
- 65.Weirauch M.T., Yang A., Albu M., Cote A.G., Montenegro-Montero A., Drewe P., Najafabadi H.S., Lambert S.A., Mann I., Cook K., et al. Determination and Inference of Eukaryotic Transcription Factor Sequence Specificity. Cell. 2014;158:1431–1443. doi: 10.1016/j.cell.2014.08.009. [DOI] [PMC free article] [PubMed] [Google Scholar]
- 66.Chen C.-K., Cheng R., Demeter J., Chen J., Weingarten-Gabbay S., Jiang L., Snyder M.P., Weissman J.S., Segal E., Jackson P.K., Chang H.Y. Structured elements drive extensive circular RNA translation. Mol. Cell. 2021;81:4300–4318.e13. doi: 10.1016/j.molcel.2021.07.042. [DOI] [PMC free article] [PubMed] [Google Scholar]
- 67.Stefani G., Fraser C.E., Darnell J.C., Darnell R.B. Fragile X Mental Retardation Protein Is Associated with Translating Polyribosomes in Neuronal Cells. J. Neurosci. 2004;24:7272–7276. doi: 10.1523/JNEUROSCI.2306-04.2004. [DOI] [PMC free article] [PubMed] [Google Scholar]
- 68.Kramer M.C., Liang D., Tatomer D.C., Gold B., March Z.M., Cherry S., Wilusz J.E. Combinatorial control of Drosophila circular RNA expression by intronic repeats, hnRNPs, and SR proteins. Genes Dev. 2015;29:2168–2182. doi: 10.1101/gad.270421.115. [DOI] [PMC free article] [PubMed] [Google Scholar]
- 69.Reis S.A., Thompson M.N., Lee J.-M., Fossale E., Kim H.-H., Liao J.K., Moskowitz M.A., Shaw S.Y., Dong L., Haggarty S.J., et al. Striatal neurons expressing full-length mutant huntingtin exhibit decreased N-cadherin and altered neuritogenesis. Hum. Mol. Genet. 2011;20:2344–2355. doi: 10.1093/hmg/ddr127. [DOI] [PMC free article] [PubMed] [Google Scholar]
- 70.Singer E., Walter C., Weber J.J., Krahl A.-C., Mau-Holzmann U.A., Rischert N., Riess O., Clemensson L.E., Nguyen H.P. Reduced cell size, chromosomal aberration and altered proliferation rates are characteristics and confounding factors in the STHdh cell model of Huntington disease. Sci. Rep. 2017;7 doi: 10.1038/s41598-017-17275-4. [DOI] [PMC free article] [PubMed] [Google Scholar]
- 71.Tran N.L., Adams D.G., Vaillancourt R.R., Heimark R.L. Signal transduction from N-cadherin increases Bcl-2. Regulation of the phosphatidylinositol 3-kinase/Akt pathway by homophilic adhesion and actin cytoskeletal organization. J. Biol. Chem. 2002;277:32905–32914. doi: 10.1074/jbc.M200300200. [DOI] [PubMed] [Google Scholar]
- 72.Zheng J.Y., Han S.P., Chiu Y.-J., Yip A.K., Boichat N., Zhu S.W., Zhong J., Matsudaira P. Epithelial Monolayers Coalesce on a Viscoelastic Substrate through Redistribution of Vinculin. Biophys. J. 2017;113:1585–1598. doi: 10.1016/j.bpj.2017.07.027. [DOI] [PMC free article] [PubMed] [Google Scholar]
- 73.Jin Y.N., Yu Y.V., Gundemir S., Jo C., Cui M., Tieu K., Johnson G.V.W. Impaired Mitochondrial Dynamics and Nrf2 Signaling Contribute to Compromised Responses to Oxidative Stress in Striatal Cells Expressing Full-Length Mutant Huntingtin. PLoS One. 2013;8 doi: 10.1371/journal.pone.0057932. [DOI] [PMC free article] [PubMed] [Google Scholar]
- 74.Patop I.L., Wüst S., Kadener S. Past, present, and future of circ RNA s. EMBO J. 2019;38 doi: 10.15252/embj.2018100836. [DOI] [PMC free article] [PubMed] [Google Scholar]
- 75.Wang P.L., Bao Y., Yee M.-C., Barrett S.P., Hogan G.J., Olsen M.N., Dinneny J.R., Brown P.O., Salzman J. Circular RNA Is Expressed across the Eukaryotic Tree of Life. PLoS One. 2014;9 doi: 10.1371/journal.pone.0090859. [DOI] [PMC free article] [PubMed] [Google Scholar]
- 76.Liu C.-X., Chen L.-L. Circular RNAs: Characterization, cellular roles, and applications. Cell. 2022;185:2016–2034. doi: 10.1016/j.cell.2022.04.021. [DOI] [PubMed] [Google Scholar]
- 77.Wright G.E.B., Collins J.A., Kay C., McDonald C., Dolzhenko E., Xia Q., Bečanović K., Drögemöller B.I., Semaka A., Nguyen C.M., et al. Length of Uninterrupted CAG, Independent of Polyglutamine Size, Results in Increased Somatic Instability, Hastening Onset of Huntington Disease. Am. J. Hum. Genet. 2019;104:1116–1126. doi: 10.1016/j.ajhg.2019.04.007. [DOI] [PMC free article] [PubMed] [Google Scholar]
- 78.Mühlau M., Winkelmann J., Rujescu D., Giegling I., Koutsouleris N., Gaser C., Arsic M., Weindl A., Reiser M., Meisenzahl E.M. Variation within the Huntington’s Disease Gene Influences Normal Brain Structure. PLoS One. 2012;7 doi: 10.1371/journal.pone.0029809. [DOI] [PMC free article] [PubMed] [Google Scholar]
- 79.Muniz L., Nicolas E., Trouche D. RNA polymerase II speed: a key player in controlling and adapting transcriptome composition. EMBO J. 2021;40 doi: 10.15252/embj.2020105740. [DOI] [PMC free article] [PubMed] [Google Scholar]
- 80.Zhang Y., Xue W., Li X., Zhang J., Chen S., Zhang J.-L., Yang L., Chen L.-L. The Biogenesis of Nascent Circular RNAs. Cell Rep. 2016;15:611–624. doi: 10.1016/j.celrep.2016.03.058. [DOI] [PubMed] [Google Scholar]
- 81.Kiliszek A., Kierzek R., Krzyzosiak W.J., Rypniewski W. Atomic resolution structure of CAG RNA repeats: structural insights and implications for the trinucleotide repeat expansion diseases. Nucleic Acids Res. 2010;38:8370–8376. doi: 10.1093/nar/gkq700. [DOI] [PMC free article] [PubMed] [Google Scholar]
- 82.Belotserkovskii B.P., Liu R., Tornaletti S., Krasilnikova M.M., Mirkin S.M., Hanawalt P.C. Mechanisms and implications of transcription blockage by guanine-rich DNA sequences. Proc. Natl. Acad. Sci. USA. 2010;107:12816–12821. doi: 10.1073/pnas.1007580107. [DOI] [PMC free article] [PubMed] [Google Scholar]
- 83.Lin Y., Dent S.Y.R., Wilson J.H., Wells R.D., Napierala M. R loops stimulate genetic instability of CTG·CAG repeats. Proc. Natl. Acad. Sci. USA. 2010;107:692–697. doi: 10.1073/pnas.0909740107. [DOI] [PMC free article] [PubMed] [Google Scholar]
- 84.Reddy K., Tam M., Bowater R.P., Barber M., Tomlinson M., Nichol Edamura K., Wang Y.-H., Pearson C.E. Determinants of R-loop formation at convergent bidirectionally transcribed trinucleotide repeats. Nucleic Acids Res. 2011;39:1749–1762. doi: 10.1093/nar/gkq935. [DOI] [PMC free article] [PubMed] [Google Scholar]
- 85.Nakamori M., Pearson C.E., Thornton C.A. Bidirectional transcription stimulates expansion and contraction of expanded (CTG)•(CAG) repeats. Hum. Mol. Genet. 2011;20:580–588. doi: 10.1093/hmg/ddq501. [DOI] [PMC free article] [PubMed] [Google Scholar]
- 86.Mason M.A., Gomez-Paredes C., Sathasivam K., Neueder A., Papadopoulou A.-S., Bates G.P. Silencing Srsf6 does not modulate incomplete splicing of the huntingtin gene in Huntington’s disease models. Sci. Rep. 2020;10 doi: 10.1038/s41598-020-71111-w. [DOI] [PMC free article] [PubMed] [Google Scholar]
- 87.Schilling J., Broemer M., Atanassov I., Duernberger Y., Vorberg I., Dieterich C., Dagane A., Dittmar G., Wanker E., Van Roon-Mom W., et al. Deregulated Splicing Is a Major Mechanism of RNA-Induced Toxicity in Huntington’s Disease. J. Mol. Biol. 2019;431:1869–1877. doi: 10.1016/j.jmb.2019.01.034. [DOI] [PubMed] [Google Scholar]
- 88.Anderson R., Das M.R., Chang Y., Farenhem K., Schmitz C.O., Jain A. CAG repeat expansions create splicing acceptor sites and produce aberrant repeat-containing RNAs. Mol. Cell. 2024;84:702–714.e10. doi: 10.1016/j.molcel.2024.01.006. [DOI] [PMC free article] [PubMed] [Google Scholar]
- 89.Gantley L., Stringer B.W., Conn V.M., Ootsuka Y., Holds D., Slee M., Aliakbari K., Kirk K., Ormsby R.J., Webb S.T., et al. Functional Characterisation of the Circular RNA, circHTT(2-6), in Huntington’s Disease. Cells. 2023;12:1337. doi: 10.3390/cells12091337. [DOI] [PMC free article] [PubMed] [Google Scholar]
- 90.Jarlstad Olesen M.T., S Kristensen L. Circular RNAs as microRNA sponges: evidence and controversies. Essays Biochem. 2021;65:685–696. doi: 10.1042/EBC20200060. [DOI] [PubMed] [Google Scholar]
- 91.Das A., Sinha T., Shyamal S., Panda A.C. Emerging Role of Circular RNA–Protein Interactions. ncRNA. 2021;7:48. doi: 10.3390/ncrna7030048. [DOI] [PMC free article] [PubMed] [Google Scholar]
- 92.Fan X., Yang Y., Chen C., Wang Z. Pervasive translation of circular RNAs driven by short IRES-like elements. Nat. Commun. 2022;13:3751. doi: 10.1038/s41467-022-31327-y. [DOI] [PMC free article] [PubMed] [Google Scholar]
- 93.Li H., Xie M., Wang Y., Yang L., Xie Z., Wang H. riboCIRC: a comprehensive database of translatable circRNAs. Genome Biol. 2021;22:79. doi: 10.1186/s13059-021-02300-7. [DOI] [PMC free article] [PubMed] [Google Scholar]
- 94.Case L.B., Baird M.A., Shtengel G., Campbell S.L., Hess H.F., Davidson M.W., Waterman C.M. Molecular mechanism of vinculin activation and nanoscale spatial organization in focal adhesions. Nat. Cell Biol. 2015;17:880–892. doi: 10.1038/ncb3180. [DOI] [PMC free article] [PubMed] [Google Scholar]
- 95.Johnson R.P., Craig S.W. F-actin binding site masked by the intramolecular association of vinculin head and tail domains. Nature. 1995;373:261–264. doi: 10.1038/373261a0. [DOI] [PubMed] [Google Scholar]
- 96.Chen H., Choudhury D.M., Craig S.W. Coincidence of Actin Filaments and Talin Is Required to Activate Vinculin. J. Biol. Chem. 2006;281:40389–40398. doi: 10.1074/jbc.M607324200. [DOI] [PubMed] [Google Scholar]
- 97.Pendergrass W., Wolf N., Poot M. Efficacy of MitoTracker GreenTM and CMXrosamine to measure changes in mitochondrial membrane potentials in living cells and tissues. Cytometry Pt A. 2004;61A:162–169. doi: 10.1002/cyto.a.20033. [DOI] [PubMed] [Google Scholar]
- 98.Dai Y., Wang H., Lian A., Li J., Zhao G., Hu S., Li B. A comprehensive perspective of Huntington’s disease and mitochondrial dysfunction. Mitochondrion. 2023;70:8–19. doi: 10.1016/j.mito.2023.03.001. [DOI] [PubMed] [Google Scholar]
- 99.Pamudurti N.R., Patop I.L., Krishnamoorthy A., Ashwal-Fluss R., Bartok O., Kadener S. An in vivo strategy for knockdown of circular RNAs. Cell Discov. 2020;6:52. doi: 10.1038/s41421-020-0182-y. [DOI] [PMC free article] [PubMed] [Google Scholar]
- 100.Gao X., Ma X.-K., Li X., Li G.-W., Liu C.-X., Zhang J., Wang Y., Wei J., Chen J., Chen L.-L., Yang L. Knockout of circRNAs by base editing back-splice sites of circularized exons. Genome Biol. 2022;23:16. doi: 10.1186/s13059-021-02563-0. [DOI] [PMC free article] [PubMed] [Google Scholar]
- 101.Li X., Yang L., Chen L.-L. The Biogenesis, Functions, and Challenges of Circular RNAs. Mol. Cell. 2018;71:428–442. doi: 10.1016/j.molcel.2018.06.034. [DOI] [PubMed] [Google Scholar]
- 102.Li S., Li X., Xue W., Zhang L., Yang L.-Z., Cao S.-M., Lei Y.-N., Liu C.-X., Guo S.-K., Shan L., et al. Screening for functional circular RNAs using the CRISPR–Cas13 system. Nat. Methods. 2021;18:51–59. doi: 10.1038/s41592-020-01011-4. [DOI] [PubMed] [Google Scholar]
- 103.Pierattini B., D’Agostino S., Bon C., Peruzzo O., Alendar A., Codino A., Ros G., Persichetti F., Sanges R., Carninci P., et al. SINEUP non-coding RNA activity depends on specific N6-methyladenosine nucleotides. Mol. Ther. Nucleic Acids. 2023;32:402–414. doi: 10.1016/j.omtn.2023.04.002. [DOI] [PMC free article] [PubMed] [Google Scholar]
- 104.Carrieri C., Cimatti L., Biagioli M., Beugnet A., Zucchelli S., Fedele S., Pesce E., Ferrer I., Collavin L., Santoro C., et al. Long non-coding antisense RNA controls Uchl1 translation through an embedded SINEB2 repeat. Nature. 2012;491:454–457. doi: 10.1038/nature11508. [DOI] [PubMed] [Google Scholar]
- 105.D’Agostino S., Tettey-Matey A., Volpe M., Pierattini B., Ansaloni F., Lau P., Bon C., Peruzzo O., Braccia C., Armirotti A., et al. Internal Ribosome Entry Sites act as Effector Domain in linear and circular antisense long non-coding SINEUP RNAs. Mol. Biol. 2023 doi: 10.1101/2023.05.25.542260. [DOI] [Google Scholar]
- 106.White J.K., Auerbach W., Duyao M.P., Vonsattel J.P., Gusella J.F., Joyner A.L., MacDonald M.E. Huntingtin is required for neurogenesis and is not impaired by the Huntington’s disease CAG expansion. Nat. Genet. 1997;17:404–410. doi: 10.1038/ng1297-404. [DOI] [PubMed] [Google Scholar]
- 107.Beaudoin G.M.J., Lee S.-H., Singh D., Yuan Y., Ng Y.-G., Reichardt L.F., Arikkath J. Culturing pyramidal neurons from the early postnatal mouse hippocampus and cortex. Nat. Protoc. 2012;7:1741–1754. doi: 10.1038/nprot.2012.099. [DOI] [PubMed] [Google Scholar]
- 108.Schindelin J., Arganda-Carreras I., Frise E., Kaynig V., Longair M., Pietzsch T., Preibisch S., Rueden C., Saalfeld S., Schmid B., et al. Fiji: an open-source platform for biological-image analysis. Nat. Methods. 2012;9:676–682. doi: 10.1038/nmeth.2019. [DOI] [PMC free article] [PubMed] [Google Scholar]
- 109.Ershov D., Phan M.-S., Pylvänäinen J.W., Rigaud S.U., Le Blanc L., Charles-Orszag A., Conway J.R.W., Laine R.F., Roy N.H., Bonazzi D., et al. TrackMate 7: integrating state-of-the-art segmentation algorithms into tracking pipelines. Nat. Methods. 2022;19:829–832. doi: 10.1038/s41592-022-01507-1. [DOI] [PubMed] [Google Scholar]
- 110.Stringer C., Wang T., Michaelos M., Pachitariu M. Cellpose: a generalist algorithm for cellular segmentation. Nat. Methods. 2021;18:100–106. doi: 10.1038/s41592-020-01018-x. [DOI] [PubMed] [Google Scholar]
- 111.Tatomer D.C., Liang D., Wilusz J.E. In: mRNA Processing Methods in Molecular Biology. Shi Y., editor. Springer; 2017. Inducible Expression of Eukaryotic Circular RNAs from Plasmids; pp. 143–154. [DOI] [PubMed] [Google Scholar]
- 112.Gagnon K.T., Li L., Janowski B.A., Corey D.R. Analysis of nuclear RNA interference in human cells by subcellular fractionation and Argonaute loading. Nat. Protoc. 2014;9:2045–2060. doi: 10.1038/nprot.2014.135. [DOI] [PMC free article] [PubMed] [Google Scholar]
- 113.Agarwal V., Bell G.W., Nam J.-W., Bartel D.P. Predicting effective microRNA target sites in mammalian mRNAs. Elife. 2015;4 doi: 10.7554/eLife.05005. [DOI] [PMC free article] [PubMed] [Google Scholar]
- 114.Kozomara A., Griffiths-Jones S. miRBase: annotating high confidence microRNAs using deep sequencing data. Nucl. Acids Res. 2014;42:D68–D73. doi: 10.1093/nar/gkt1181. [DOI] [PMC free article] [PubMed] [Google Scholar]
- 115.Glažar P., Papavasileiou P., Rajewsky N. circBase: a database for circular RNAs. RNA. 2014;20:1666–1670. doi: 10.1261/rna.043687.113. [DOI] [PMC free article] [PubMed] [Google Scholar]
- 116.Kent W.J., Sugnet C.W., Furey T.S., Roskin K.M., Pringle T.H., Zahler A.M., Haussler D. The human genome browser at UCSC. Genome Res. 2002;12:996–1006. doi: 10.1101/gr.229102. [DOI] [PMC free article] [PubMed] [Google Scholar]
- 117.Li J.-H., Liu S., Zhou H., Qu L.-H., Yang J.-H. starBase v2.0: decoding miRNA-ceRNA, miRNA-ncRNA and protein-RNA interaction networks from large-scale CLIP-Seq data. Nucleic Acids Res. 2014;42:D92–D97. doi: 10.1093/nar/gkt1248. [DOI] [PMC free article] [PubMed] [Google Scholar]
- 118.Bernabò P., Tebaldi T., Groen E.J.N., Lane F.M., Perenthaler E., Mattedi F., Newbery H.J., Zhou H., Zuccotti P., Potrich V., et al. In Vivo Translatome Profiling in Spinal Muscular Atrophy Reveals a Role for SMN Protein in Ribosome Biology. Cell Rep. 2017;21:953–965. doi: 10.1016/j.celrep.2017.10.010. [DOI] [PMC free article] [PubMed] [Google Scholar]
- 119.Lauria F., Bernabò P., Tebaldi T., Groen E.J.N., Perenthaler E., Maniscalco F., Rossi A., Donzel D., Clamer M., Marchioretto M., et al. SMN-primed ribosomes modulate the translation of transcripts related to spinal muscular atrophy. Nat. Cell Biol. 2020;22:1239–1251. doi: 10.1038/s41556-020-00577-7. [DOI] [PMC free article] [PubMed] [Google Scholar]
Associated Data
This section collects any data citations, data availability statements, or supplementary materials included in this article.
Supplementary Materials
Data Availability Statement
The authors declare that all data supporting the findings of this study are available within the paper and its supplemental information files. Raw imaging data, as well as Fiji software Macro for automated Vinculin analysis are available upon reasonable request.