

Abstract
Acute intoxication with organophosphate (OP) cholinesterase inhibitors poses a significant public health risk. While currently approved medical countermeasures can improve survival rates, they often fail to prevent chronic neurological damage. Therefore, there is need to develop effective therapies and quantitative metrics for assessing OP-induced brain injury and its rescue by these therapies. In this study we used a rat model of acute intoxication with the OP, diisopropylfluorophosphate (DFP), to test the hypothesis that T2 measures obtained from brain magnetic resonance imaging (MRI) scans provide quantitative metrics of brain injury and therapeutic efficacy. Adult male Sprague Dawley rats were imaged on a 7T MRI scanner at 3, 7 and 28 days post-exposure to DFP or vehicle (VEH) with or without treatment with the standard of care antiseizure drug, midazolam (MDZ); a novel antiseizure medication, allopregnanolone (ALLO); or combination therapy with MDZ and ALLO (DUO). Our results show that mean T2 values in DFP-exposed animals were: (1) higher than VEH in all volumes of interest (VOIs) at day 3; (2) decreased with time; and (3) decreased in the thalamus at day 28. Treatment with ALLO or DUO, but not MDZ alone, significantly decreased mean T2 values relative to untreated DFP animals in the piriform cortex at day 3. On day 28, the DUO group showed the most favorable T2 characteristics. This study supports the utility of T2 mapping for longitudinally monitoring brain injury and highlights the therapeutic potential of ALLO as an adjunct therapy to mitigate chronic morbidity associated with acute OP intoxication.
Keywords: Allopregnanolone, Diisopropylfluorophosphate, Magnetic resonance imaging, Midazolam, Neurosteroid, T2 mapping
1. Introduction
Organophosphate (OP) anticholinesterases are among the most commonly used pesticides worldwide (Bouchard et al., 2010; Voorhees et al., 2017; Kumar et al., 2018), and self-poisoning with OP pesticides is one of the most prevalent means of suicide in low- and middle-income countries, with an estimated hundreds of thousands of deaths globally per year between 2010 and 2014 (Gunnell et al., 2007; Mew et al., 2017). Additionally, OP nerve agents are a significant threat to public health due to their ongoing use by militaries and terrorist groups (Tu, 2007; John et al., 2018; Nepovimova and Kuca, 2020; Young and Watson, 2020).
Acute intoxication with OPs inhibits acetylcholinesterase, which normally functions to terminate acetylcholine-mediated neurotransmission, resulting in hyperactivation of cholinergic receptors at central and peripheral synapses throughout the body (Sidell and Borak, 1992; Marrs, 1993). This manifests clinically as autonomic, somatic, and central nervous system dysfunction, including status epilepticus (SE), defined as a life-threatening seizure lasting more than 5 min (Todorovic et al., 2012). The long-term neurologic consequences observed in individuals who survive acute OP intoxication include acquired epilepsy, cognitive dysfunction, and changes in brain structure that develop in weeks to months following intoxication (Yamasue et al., 2007; Chen, 2012; Tsai and Lein, 2021).
Studies of rat models of acute intoxication with the OP diisopropylfluorophosphate (DFP) have demonstrated neurotoxic effects similar to those observed in humans acutely intoxicated with OP nerve agents (Pouliot et al., 2016), including parasympathetic signs, muscle twitching, acute seizure activity that rapidly progresses to SE, and subsequent chronic morbidities. These morbidities include progressive neuropathology, spontaneous recurrent seizures, and impaired cognitive function (Sisó et al., 2017; Guignet et al., 2020). Improved control of acute seizure activity has shown promise for reducing the severity of the long-term consequences of OP intoxication in rat models (Tattersall, 2009). However, current standard of care for OP-induced SE, the benzodiazepine, midazolam (MDZ) (Lowenstein and Alldredge, 1998), shows minimal benefit in this regard even when administered within an optimal therapeutic window (e.g., within minutes of exposure) (Figueiredo et al., 2018; Wu et al., 2018; Dhir et al., 2020; Supasai et al., 2020). Adjunct therapy with the neurosteroid, allopregnanolone (ALLO), in combination with MDZ, has shown promise, demonstrating attenuation of brain injury following acute OP intoxication as assessed by histology (Lumley et al., 2019; Reddy, 2019; Dhir et al., 2020). Histological methods for evaluating brain injury, however, do not allow for repeated measurements within the same animal longitudinally, thereby precluding the study of pathologic progression. In contrast, in vivo imaging methods permit longitudinal studies to evaluate the evolution of neuropathology and the efficacy of therapeutic candidates.
Magnetic resonance imaging (MRI) permits non-invasive monitoring of brain pathology. The spin-spin relaxation time (T2), a fundamental property of hydrogen nuclei, measures the decay of net magnetization in the transverse plane. Tissue T2 values are sensitive to changes in free water and absolute quantification of T2, represented as parametric T2 maps, has been shown to be a reliable and reproducible metric across a range of scanning environments (Deoni, 2010; Liachenko and Ramu, 2017). To date, T2 mapping has been utilized in rodent models of acute OP intoxication (Bhagat, Yusuf A.; Obenaus, André; Hamilton, Murray G.; Kendall, 2001; Bhagat et al., 2005; Gullapalli et al., 2010; Shrot et al., 2012, 2015; Lee et al., 2020); however, these studies primarily focused on identifying initial pathology. There is a paucity of data characterizing changes in T2 beyond the first few days of OP intoxication or evaluating its efficacy for monitoring long-term therapeutic response.
In this paper we evaluated longitudinal T2 mapping as a noninvasive means to assess the impact of acute DFP intoxication over the first month in a rat model. Furthermore, we assessed the ability of T2 mapping to quantify the response to anti-seizure treatments, namely MDZ, ALLO, and the combination of MDZ and ALLO (DUO).
2. Materials and methods
2.1. Animals and acute DFP intoxication paradigm
Adult male Sprague Dawley rats (250–280 g; n = 49; Charles River Laboratories, Hollister, California) were housed individually in standard plastic cages under controlled environmental conditions (22 ± 2 °C, 40%–50% humidity) with a normal 12 h light/dark cycle and ad libitum access to food and water. Since these studies were based on previous observations (Dhir et al., 2020) that examined the effects of MDZ and ALLO alone or in combination on acute seizure activity in male rats following acute intoxication with DFP, only male rats were used in the current study. All animal experiments were approved by the University of California at Davis Institutional Animal Care and Use Committee with attention to minimizing distress and discomfort.
Prior to any exposures, a random number generator was used to randomize rats into vehicle control (VEH) vs. DFP-intoxicated groups with the software designed to yield a greater number of DFP animals than VEH animals, in part to account for historical observations that 10–20% of DFP rats in any given cohort will either not develop SE or will die during the 24 h post-exposure. A smaller number of VEH relative to DFP animals were also selected based on the lower intra- and interanimal variation in imaging metrics observed within VEH controls (Supplemental Fig. S9) as previously demonstrated in this animal model (Hobson et al., 2017). Rats were injected with DFP (4 mg/kg, s. c., purity 90% ± 7% as determined by [1H]-NMR (Sigma Chemical Company, St Louis, MO)), diluted in 300 μl of sterile, ice-cold, phosphate-buffered saline (PBS, 150 mM NaCl, pH 7.2); VEH rats were injected with an equivalent volume of PBS alone. Approximately 1 min following the first injection, all animals received atropine sulfate (2 mg/kg, i. m., purity ≥97%, Sigma Chemical Company) and pralidoxime (2-PAM, 25 mg/kg, i. m., purity ≥97%, Sigma Chemical Company) (Sisó et al., 2017; Guignet et al., 2020). This protocol was shown to increase survival rate in rats acutely intoxicated with DFP (Li et al., 2011; Bruun et al., 2019). Following DFP or vehicle administration, animals were scored for seizure behavior at 5 min intervals for the first 2 h and 20 min intervals between 2 and 4 h post-DFP intoxication using a previously described modified Racine scale (Deshpande et al., 2010). This scale ranges from 1 to 5, with 5 indicating severe seizure behavior. Criterion for each score were: 1- Salivation, Lacrimation, Urination and Defecation (SLUD); 2- Tremors/Wet dog shakes; 3- Forelimb Clonus; 4- Rearing of torso; and 5- Forelimb and Hindlimb Clonus.
At 40 min post-DFP intoxication, DFP rats that achieved consecutive seizure scores ≥3 during the first 40 min post-exposure were randomized using a random number generator into one of three treatment groups: 1) DFP rats that did not receive any anti-seizure medication, 2) DFP rats treated with MDZ (1.8 mg/kg, i. m.), 3) DFP rats treated with ALLO (24 mg/kg, i. m.), and 4) DFP rats treated with combined MDZ (1.8 mg/kg, i. m.) + ALLO (24 mg/kg, i. m.) hereafter referred to as the DUO group. A schematic of the injection protocol and treatment groups is shown in Fig. 1.
Fig. 1.

Schematic showing the diisopropylfluorophosphate (DFP) intoxication paradigm design and study timeline, with the number of animals imaged from each group: vehicle (VEH), DFP with no anti-seizure treatment, midazolam (MDZ), allopregnanolone (ALLO) and the MDZ + ALLO combination (DUO) at each timepoint (days 3, 7 and 28) (bottom right). The table indicates the cohorts of imaged animals per treatment group (rows), and the timepoints at which data was acquired (green shaded boxes). The final row for each treatment (light blue shading) indicates the total number of animals imaged for each treatment group at each timepoint. Note that not all animals were imaged at every timepoint.
2.2. Magnetic resonance imaging
Magnetic resonance imaging (MRI) scans were performed 3, 7 and 28 days after DFP intoxication or vehicle injection. Scans were acquired on a 7T preclinical MR scanner (Biospec 70/30, Bruker Biospin MRI, Ettlingen, Germany) equipped with a 116-mm internal diameter B-GA12S gradient (450 mT/m, 4500 T/m/s), a 72-mm internal diameter linear transmit coil, and a four-channel, rat-brain phased array in cross coil configuration for signal reception. Animals were anesthetized with isoflurane/O2 (Piramal Healthcare, Bethlehem PA), 2.0–3.0% vol/vol for 3–5 min, and then placed head-first prone in the MR scanner where they received 1.0–2.0%vol/vol of anesthesia. A stereotactic head holder consisting of a bite bar and ear canal bars was used to minimize motion during scanning. For the duration of the scanning, temperature and respiration rate were monitored (Small Animal Instruments, Inc., Stony Brook, NY), and anesthesia and delivery of warm air to the scanner bore were modulated to ensure that a body temperature of 37 °C and respiration rate of 50–70 breaths/min were maintained. Images were acquired using Paravision 5.1 (Bruker BioSpin MRI, Ettlingen, Germany).
The scanning paradigm included a localizer, followed by a multi-slice T2-weighted, rapid acquisition with relaxation enhancement (RARE) sequence for anatomic reference. Axial images were collected using the following parameters: repetition time (TR) = 6250 ms, echo time (TE) = 33 ms; RARE factor = 8; averages = 4; field-of-view (FOV) = 35.0 × 25.0 × 29.5 mm3, with a matrix size of 280 × 200 in plane and 59 slices in total, resulting in a resolution of 0.125 × 0.125 mm2 in-plane and a slice thickness of 0.500 mm, spanning approximately −11.25 mm–18.25 mm Bregma. Lastly, a multi-slice multi-echo (MSME) pulse sequence was used to generate T2 maps with 15 echoes equally spaced by 10 ms from 10 to 150 ms. The MSME sequence had a TR of 1500 ms; FOV of 35.0 × 25.0 × 13.0 mm3; in-plane matrix size of 140 × 100; and 9 slices along the z direction; in-plane resolution of 0.25 × 0.25 mm2, slice thickness of 1.00 mm and slice gap of 0.50 mm, spanning approximately −10 mm–3 mm Bregma. At the time of data acquisition, scan geometry was set to align the slice coordinates of the T2-weighted data with the slice coordinates of the T2 maps. As a result, the T2-weighted and MSME data were inherently co-registered. Total imaging time for each rat was approximately 40 min when also accounting for animal setup and data acquisition. Positron emission tomography (PET) data were also acquired on the same days as MRI. PET scans were 30 min in duration and those data are the subject of a separate manuscript and, therefore, will not be discussed further in this article.
2.3. Regional delineation
Five volumes of interest (VOIs) that encompassed the piriform cortex, amygdala, hippocampus, dorsolateral thalamus and medial thalamus were delineated from the brain scans, as these brain regions have previously been demonstrated to exhibit pathological changes following acute DFP intoxication (Hobson et al., 2017; Guignet et al., 2020). The VOIs were manually segmented on T2-weighted, axial images by individuals with experience in analyzing rat brain images and then reviewed and confirmed by an expert in rat brain anatomy using AMIRA 6.0 software (Thermo Fisher Scientific, Waltham, MA). The VOIs are illustrated in Fig. 2. Atlas-based segmentation, including non-linear warping, was not performed, as the marked brain atrophy observed in this model (Hobson et al., 2017) produces sub-optimal results. Segmentation was guided by the Paxinos and Watson’s atlas of the rat brain (Paxinos, George; Watson, 2007). Where possible, image derived anatomic boundaries such as the skull, white matter tracts, and vasculature were utilized as anatomic landmarks. When unavailable, such as between portions of the piriform cortex and amygdala, region boundaries were approximated using the atlas. The axial extents of VOIs, listed as “start/end distance from Bregma” in mm are as follows: amygdala, −2.0/−4.0; hippocampus, −2.0/6.0; piriform cortex, 0.0/−3.5; thalamus (medial and dorsolateral) −1.5/5.0, and were selected to overlap known areas of OP-induced neuropathology (Sisó et al., 2017), and avoid any susceptibility or motion artifacts.
Fig. 2.

Exemplary T2-weighted anatomical scans (left) and corresponding T2 maps (right) of the vehicle control (VEH) (row 1) and diisopropylfluorophosphate (DFP) groups (row 2) imaged at day 3 post-DFP intoxication. The volumes of interest (VOIs) are overlaid on a representative T2-weighted MRI axial section (row 3). The bilateral VOIs evaluated from the magnetic resonance images (MRI) were the hippocampus (green), dorsolateral thalamus (yellow), medial thalamus (red), amygdala (blue) and piriform cortex (pink).
2.4. Creation of T2 maps
The MRI scans were cropped using a center-of-mass algorithm to remove extracerebral anatomy and reduce computation time (MATLAB and Statistics Toolbox Release, 2012b; The MathWorks Inc., Natick, MA). The software code for image cropping and T2 map calculation is available on GitHub (https://github.com/ajchaudhari/T2-mapping).
To generate the T2 maps, a mono-exponential curve fit was performed voxel-wise on the intensity vs. TE curves over the 15 TEs according to the equation:
where M is the signal intensity, M0 is the equilibrium magnetization, and f is a constant offset/y-intercept. From the T2 map, the mean, standard deviation, skewness, and kurtosis of T2 values in each VOI were calculated. This voxel-wise method is used as the primary method of analysis.
Another method of regional quantification, whereby voxel intensity values in each VOI were averaged at each TE, was also explored. A single curve fit was then performed on these averaged T2 values over 15 TEs for each VOI. This method, referred to as Simplified Regional Quantification, was investigated due to its reduced computation time and the results of this analysis method are presented in the supplementary material (Supplemental Figs. S1 and 2).
2.5. Statistical analysis
For all outcomes, which were measured in multiple brain regions and across time for the same animals, mixed effects models with robust standard errors, including animal-specific random effects, were fit to assess differences between groups. These models allow for the inclusion of between- (group) and within-animal (timepoint and brain VOI) factors and can accommodate missing data so that not all animals need to have outcomes at all timepoints. Primary factors of interest included exposure (VEH, DFP, DFP + MDZ, DFP + ALLO, DFP + DUO), brain VOI (piriform cortex, amygdala, hippocampus, dorsolateral thalamus, and medial thalamus) and timepoint (3, 7 and 28 days post-exposure). For all VOIs, except the medial thalamus, outcomes for the left and right hemisphere were averaged. For the mean metric, a log transformation after a shift in all values (subtracting 40 from the T2 mean to better meet the assumptions of the model without changing the conclusions) resulted in better meeting the assumptions of the model. Kurtosis (a metric that encompasses the extent of outliers in the T2 value distribution) and standard deviation of T2 values were transformed using the natural logarithm to better meet the assumptions of the model (Groeneveld and Meeden, 1984). Interactions between the factors (acute--intoxication, VOI, timepoint) were considered and the best model was chosen using Akaike Information Criterion (AIC) (Akaike, 1974). Contrasts for differences between groups, either overall or by VOI or timepoint, were constructed and tested using a Wald test. Comparison of the classical likelihood-based standard errors to sandwich standard errors that are robust to heteroskedasticity revealed substantial differences for one of our outcomes (the transformed T2 mean), indicating the likelihood-based AIC method was not trustworthy unless adjustments are made for the heteroskedasticy (White, 1980; Ronchetti, 1985). Hence, for that model, we relied instead on statistical significance testing based on the robust standard errors to decide whether or not to include the interaction term. The Benjamini-Hochberg false discovery rate (FDR) was used within an outcome measure to account for multiple comparisons. Results for mean, standard deviation and kurtosis (log--transformed outcomes) across VOIs or timepoints are presented as geometric mean ratios (GMRs) between groups, while those for skew (a measure of asymmetry given by the amount of deviation from a Gaussian curve) and Simplified Regional Quantification mean (non--transformed outcomes) are presented as average differences between groups. All analyses were performed using SAS software, version 9.4 and alpha was set at 0.05. A nonparametric one-way ANOVA was run to compare averaged seizure scores across groups at 40 min and 4 h. The T2 values were correlated with seizure severity using the nonparametric Spearman correlation test with a two-tailed p-value; multiple tests were accounted for using FDR. Comparisons remained statistically significant after the FDR correction, unless otherwise stated.
3. Results
3.1. Acute DFP intoxication elicited robust seizure behavior and seizure score was reduced by antiseizure therapy
The behavioral seizure score of all DFP-intoxicated animals included in the study averaged 2.83 over the first 40 min (n = 44, although note that not all animals were imaged at all timepoints). All animals achieved consecutive seizure severity scores of 3 or above during the first 40 min, indicative of SE (Pouliot et al., 2016; Guignet et al., 2020). At 40 min post-DFP, DFP animals were randomized into treatment groups, and immediately prior to administration of treatments, no significant differences were detected in average seizure scores across treatment groups. The mean and 95% confidence intervals (CI) of behavioral seizure scores at 40 min for the groups were: DFP: 2.80 [2.63, 2.96], MDZ: 2.86 [2.76, 2.97], ALLO: 2.81 [2.62, 3.00], DUO 2.87 [2.72, 3.02].
Rats in the ALLO and DUO anti-seizure treatment group exhibited mild-to-moderate sedation, including brief loss of righting reflex, but remained responsive to tail or toe pinch as reported in previous studies (Dhir et al., 2020). Relative to the DFP group that did not receive anti-seizure medication, administration of anti-seizure treatments significantly reduced average seizure scores from 45 min until 4 h post-exposure (MDZ, p < 0.001; ALLO, p = 0.001; DUO, p < 0.001). The MDZ group had significantly higher averaged seizure score at 4 h post-DFP compared to the DUO (p < 0.001) and ALLO (p = 0.01) groups. No significant differences were detected between ALLO and DUO groups. The mean and 95% CI for seizure scores measured from 45 min to 4 h were: DFP: 2.51 [2.19, 2.82], MDZ: 1.78 [1.43, 2.14], ALLO: 0.76 [−0.003, 1.52], DUO: 0.13 [0.07, 0.19].
3.2. T2 maps revealed lesions following acute DFP intoxication
Acute DFP intoxication produced hyperintense lesions on T2 maps in locations that included, but were not limited to, the piriform cortex, thalamus, amygdala, and hippocampus (Fig. 3). Qualitatively, these lesions appeared to be more distinguishable (Fig. 2) on T2 maps compared to T2-weighted images, and were most prominent on day 3 post-intoxication. Relative to day 3, lesions detected on days 7 and 28 generally demonstrated reduced intensity, extent, and prevalence. At the 28-day timepoint, hypointensites were noted in the thalami and hippocampi of animals in the DFP group, consistent with signal loss due to magnetic susceptibility (Fig. 3).
Fig. 3.
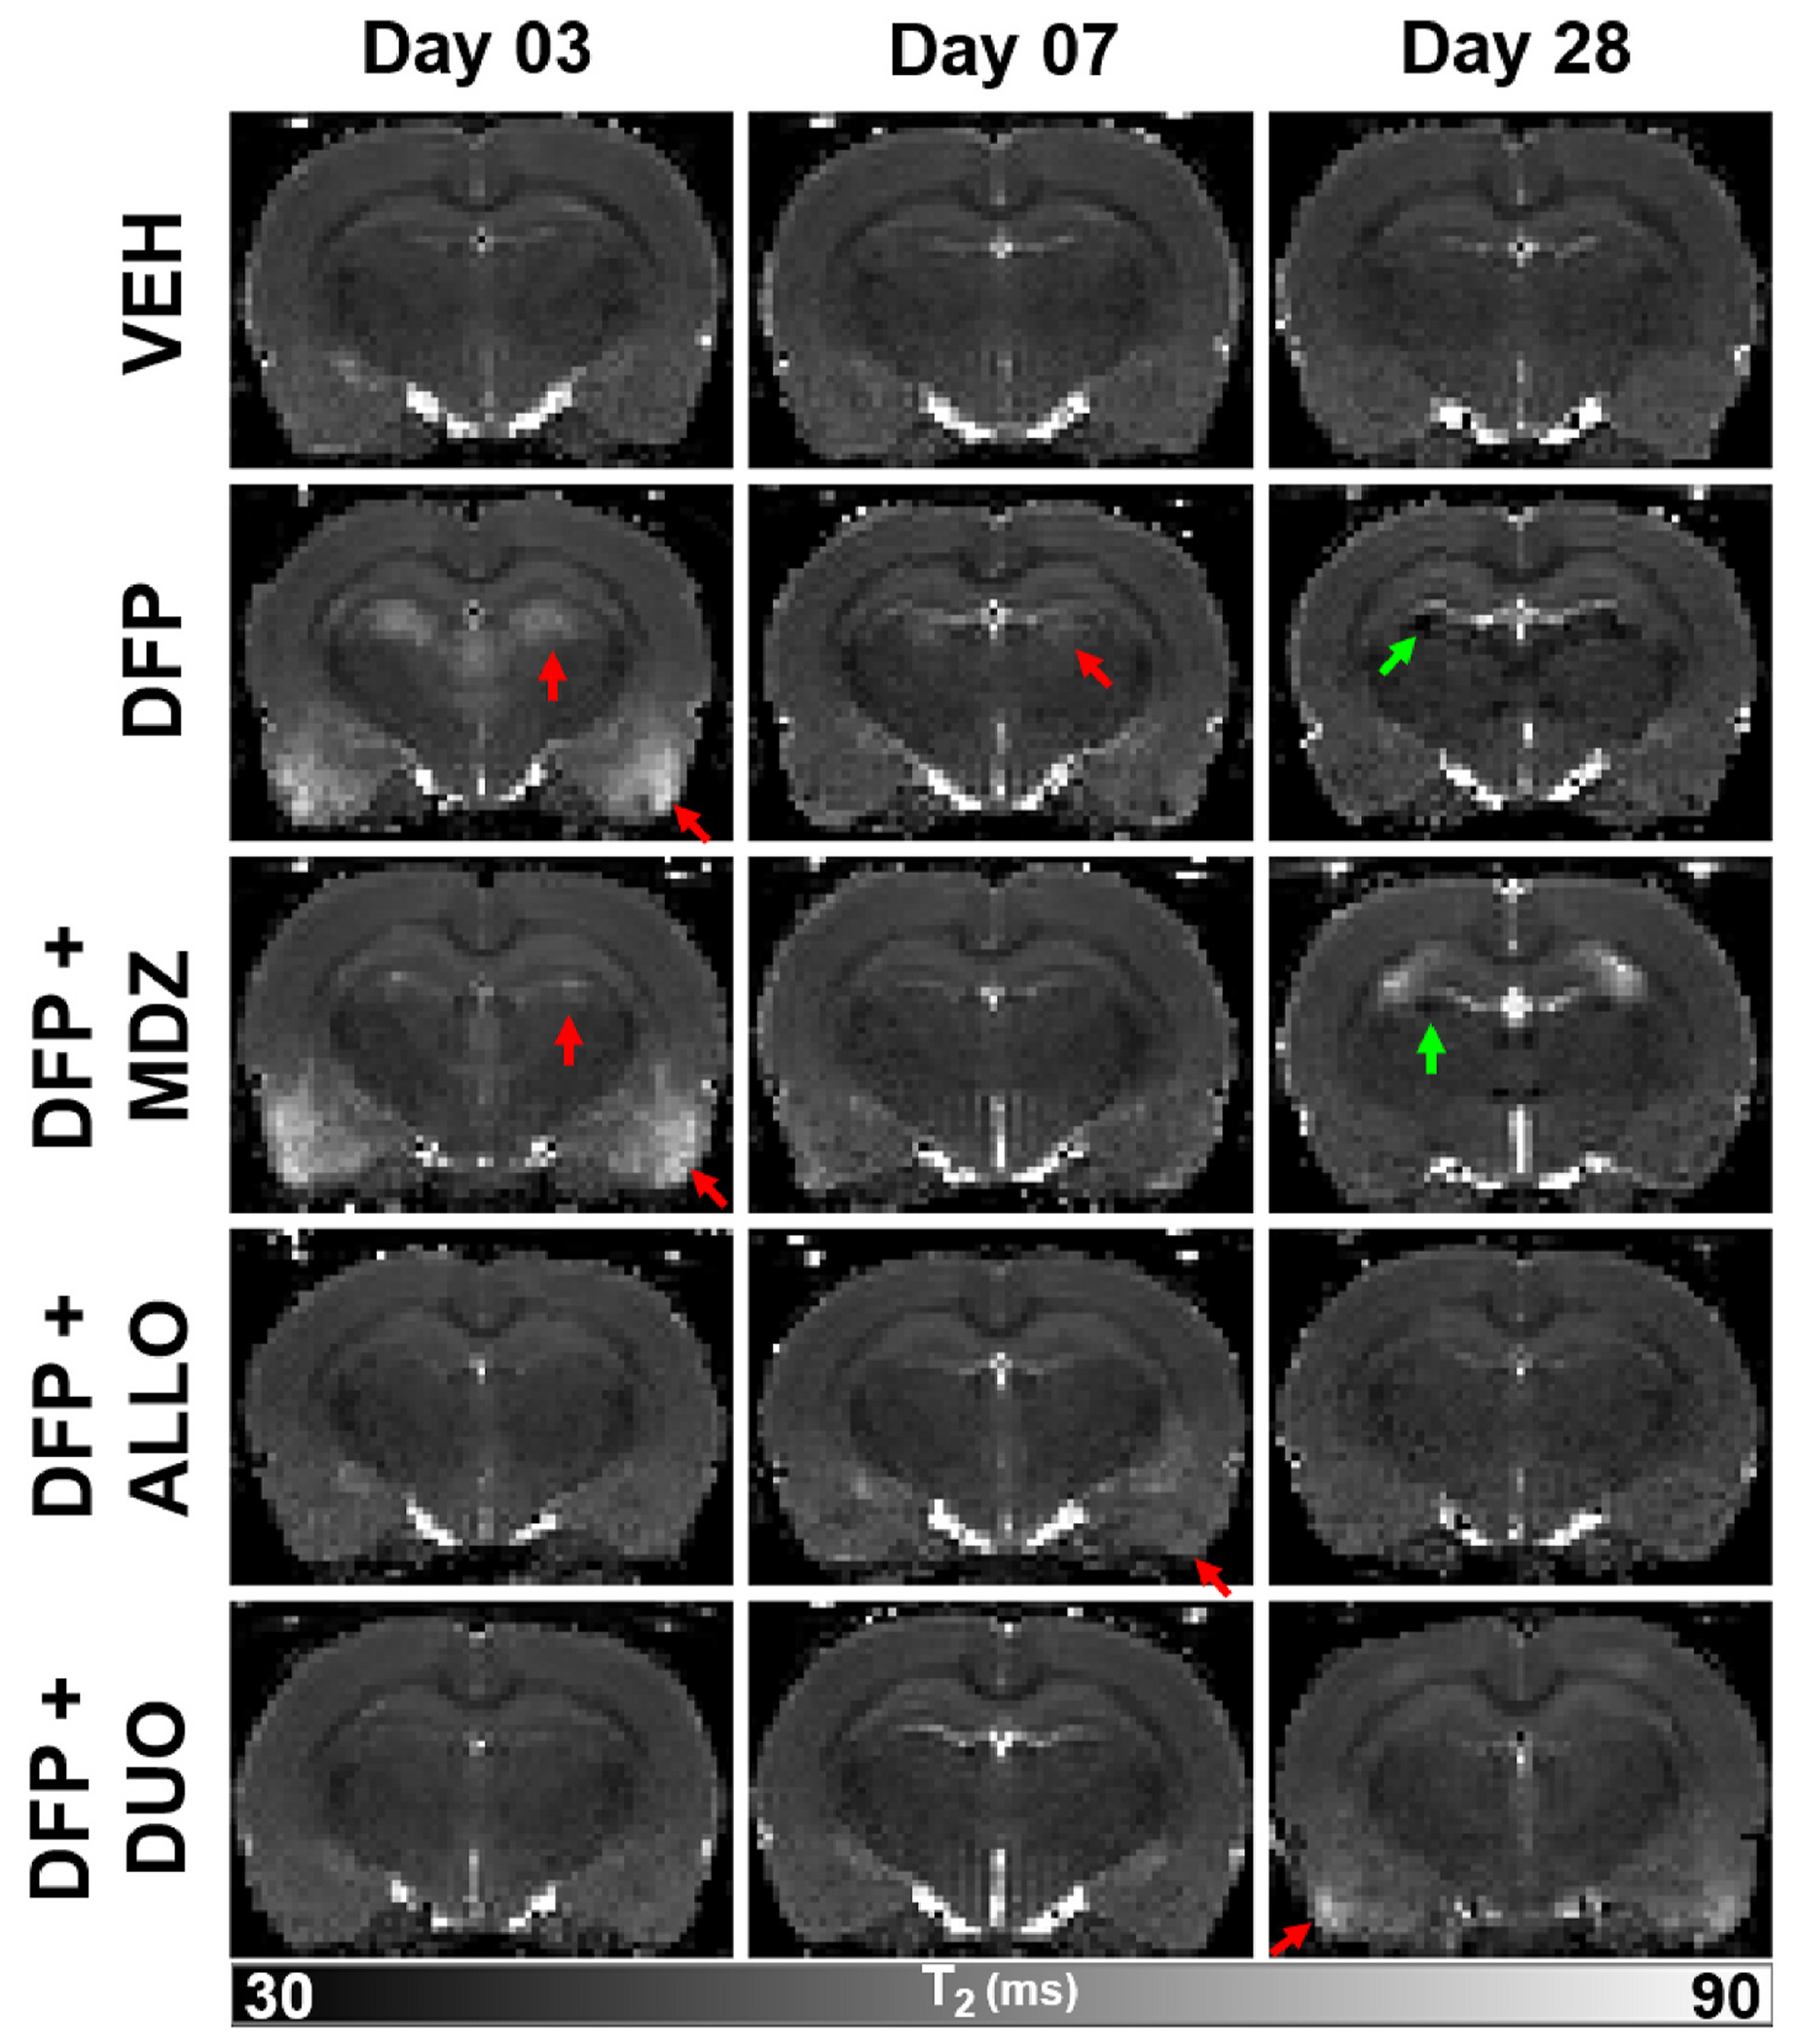
Reconstructed voxel-wise T2 parametric maps depicted brain injury following acute diisopropylfluorophosphate (DFP) intoxication that is modified by intervention with anti-seizure medication. Red arrows indicate hyperintensities consistent with edema, while green arrows indicate hypointensities suggestive of magnetic susceptibility consistent with previously reported mineralization at later timepoints.
3.3. Region- and time-dependent changes were observed in mean T2 values following acute DFP intoxication
Acute DFP intoxication resulted in a significant increase in mean T2 values (Table 1) when compared to the VEH group across all VOIs on day 3 (p < 0.001) (Fig. 4, Table 2). This increase diminished with time, consistent with the visual appearance of lesions. The increased mean T2 values observed in the DFP group on day 3 persisted in the piriform cortex (p = 0.003) until day 7 (Fig. 4). However, mean T2 values in the medial and dorsolateral thalamus (p < 0.001) were significantly reduced when compared to the VEH group on day 28 (Fig. 4).
Table 1.
Mean T2 values in milliseconds (ms) along with standard deviation in vehicle controls (VEH), diisopropylfluorophosphate (DFP) animals that received no anti-seizure medication and DFP animals that received combined antiseizure medication of midazolam (MDZ) and allopregnanolone (ALLO), referred to as DUO) across the 5 volumes of interest (VOIs) at the three timepoints; days 3, 7 and 28 post-acute intoxication.
| VOI | T2 values (ms) |
||||||||
|---|---|---|---|---|---|---|---|---|---|
| VEH |
DFP |
DUO |
|||||||
| Day 03 | Day 07 | Day 28 | Day 03 | Day 07 | Day 28 | Day 03 | Day 07 | Day 28 | |
| Piriform Cortex | 58.0±4.5 | 57.6±4.0 | 57.1±4.1 | 71.9±9.0 | 59.7±4.8 | 57.1±4.8 | 58.0±3.8 | 58.3±3.3 | 57.2±4.6 |
| Hippocampus | 54.1±2.8 | 54.0±3.1 | 53.5±3.0 | 57.3±4.7 | 54.3±3.9 | 54.1±4.2 | 53.8±2.9 | 54.1±3.1 | 53.6±3.1 |
| Amygdala | 55.4±2.9 | 55.4±2.9 | 54.5±3.2 | 63.6±6.5 | 55.8±3.3 | 55.3±3.8 | 56.5±4.1 | 56.2±3.2 | 55.3±3.4 |
| Medial Thalamus | 51.6±3.5 | 51.6±3.5 | 50.9±3.8 | 56.8±4.9 | 51.0±3.8 | 47.8±4.8 | 51.7±3.7 | 52.3±3.6 | 50.5±3.8 |
| Dorsolateral Thalamus | 48.2±2.3 | 48.0±2.5 | 47.4±2.3 | 50.8±4.2 | 47.8±3.0 | 46.0±3.6 | 47.9±2.3 | 48.0±2.2 | 47.4±2.4 |
Fig. 4.

Geometric mean ratios (GMRs) of mean T2 values in diisopropylfluorophosphate (DFP) vs. vehicle (VEH) groups across all timepoints (in days) and in all 5 volumes of interest (VOIs). Each dot represents the GMR; the bars indicate 95% confidence intervals (VEH: n = 5 and DFP: n = 12). Blue indicates significantly higher T2 values in DFP vs. VEH; red, significantly lower T2 values in DFP vs. VEH; and black, no significant difference in T2 values between the DFP and VEH groups. (When the confidence interval for the GMR includes 1, there is no statistical evidence of a difference between groups).
Table 2.
Summary of the differences observed in mean T2 values (ms) in vehicles (VEH) diisopropylfluorophosphate (DFP) animals that received one of the antiseizure medication (midazolam (MDZ), allopregnanolone (ALLO) or combined MDZ and ALLO, referred to as DUO) vs. DFP animals that received no anti-seizure medication across all timepoints (in days) and in all 5 volumes of interest (VOIs).
| VOI | VEH vs DFP |
MDZ vs DFP |
ALLO vs DFP |
DUO vs DFP |
||||||||
|---|---|---|---|---|---|---|---|---|---|---|---|---|
| Day 03 | Day 07 | Day 28 | Day 03 | Day 07 | Day 28 | Day 03 | Day 07 | Day 28 | Day 03 | Day 07 | Day 28 | |
| Piriform Cortex | ↓* | ↓* | ↓* | ↓ | ↓* | |||||||
| Hippocampus | ↓* | ↓* | ↓* | ↓* | ||||||||
| Amygdala | ↓* | ↓* | ↓ | ↓* | ||||||||
| Dorsolateral Thalamus | ↓* | ↑* | ↓* | ↓* | ↓* | ↑* | ||||||
| Medial Thalamus | ↓* | ↑* | ↓* | ↓* | ↓* | ↑* | ↑* | |||||
indicates p < .05 after FDR.
Note: Upward arrows indicate increase, while downward arrows indicate decrease. *p < .05 after False Discovery Rate (FDR) correction.
3.4. MDZ significantly altered DFP-induced changes in mean T2 values on day 3 but not on days 7 and 28
The MDZ group displayed significantly lower mean T2 values compared to the DFP group in the hippocampus (p = 0.003), medial thalamus (p = 0.004) and dorsolateral thalamus (p = 0.001) on day 3. There were no significant differences compared to the DFP group on day 7. At day 28, the MDZ group had lower mean T2 values compared to the DFP group in the amygdala (p = 0.002) (Fig. 5, Table 2).
Fig. 5.

Geometric mean ratios (GMRs) of mean T2 values between diisopropylfluorophosphate (DFP) animals that received no anti-seizure medication vs. DFP animals that received midazolam (MDZ), allopregnanolone (ALLO) or combined MDZ and ALLO, referred to as DUO across all timepoints (in days) and in all 5 volumes of interest (VOIs). Each dot represents the GMR between DFP and VEH; bars, the 95% confidence intervals (DFP: n = 12, MDZ: n = 12, ALLO: n = 10, DUO: n = 10 animals). Blue indicates significantly higher T2 values in the treated group vs. DFP alone; red, significantly lower T2 values in the treated group vs. DFP; black, no significant difference in T2 values between anti-seizure treatment groups (MDZ, ALLO, DUO) and the DFP group. (When the confidence interval for the GMR includes 1, there is no statistical evidence of a difference between groups).
3.5. T2 mapping demonstrated therapeutic rescue by DUO
On day 3, mean T2 values were significantly lower in the DUO (p < 0.002) group across all VOIs compared to the DFP group (Table 1). The ALLO group displayed a similar trend of significantly lower T2 values on day 3 (p < 0.016), although the difference in the amygdala was no longer significant after FDR correction (Fig. 5, Table 2). Mean T2 values remained significantly lower in the piriform cortex of the ALLO group on day 7 (p = 0.023), but this did not remain significant after FDR correction. By contrast, mean T2 values were significantly higher in the medial thalamus of the DUO group on days 7 (p = 0.005) and 28 (p = 0.001) and the dorsolateral thalamus (p = 0.001) on day 28 (Fig. 5).
3.6. The skewness, standard deviation, and kurtosis of T2 values varied spatiotemporally
When comparing the DFP and VEH group, the standard deviation of T2 values was significantly higher in the former timepoint on days 3 and 28 (day 3; p < 0.001 and day 28; p = 0.005); this difference did not significantly vary by VOI. Standard deviation of T2 values was lower in ALLO and DUO groups in comparison to the DFP group on day 3 (p < 0.001) and day 7 for the DUO group (p = 0.008) (Supplementary Figs. S3 and 4).
Skewness of the fitted T2 values varied by VOI and was higher in the DFP group compared to the VEH group in the amygdala (p = 0.005) and hippocampus (p = 0.007), but lower in the piriform cortex (p = 0.002). Skewness of T2 was significantly lower for the MDZ group in the hippocampus (p = 0.003), for the ALLO group in the amygdala (p = 0.004) and medial thalamus (p = 0.007) and for the DUO group in the hippocampus (p < 0.001) when compared to the DFP group (Supplemental Figs. S5 and 6).
Kurtosis of the T2 values was significantly lower in the piriform cortex (p < 0.001) of the DFP group compared to the VEH group. Kurtosis of T2 values was also significantly lower in the hippocampus of the DUO group (p < 0.001), but significantly higher in the piriform cortex (p = 0.002) when compared to the DFP group (Supplemental Figs. S7 and 8).
3.7. Seizure scores and mean T2 values
Seizure scores averaged at 4 h post-DFP intoxication were significantly and positively correlated with mean T2 values at day 3 across all analyzed brain VOIs (p < 0.02) (Table 3). There was a significant negative correlation between this averaged seizure score and mean T2 values at day 7 in the medial thalamus (rs = −0.41, p = 0.008) (Supplementary Table S1). A similar significantly negative correlation in T2 was observed at day 28 in the medial thalamus (rs = −0.62, p < 0.0001) and the dorsolateral thalamus (rs = −0.62, p < 0.0001). However, a positive correlation was observed between the average seizure score and the mean T2 value in the hippocampus at day 28 (rs = 0.39, p = 0.02) (Table 4) (Supplemental Figs. S9 and 10).
Table 3.
Spearman correlation coefficients between averaged seizure scores and mean T2 values at day 3 across all 5 volumes of interest (VOIs). (rs: Spearman correlation coefficient, CI: confidence interval).
| VOI | Correlation between averaged seizure score at 4 h vs T2 value at day 3 |
||
|---|---|---|---|
| rs | 95% CI | p | |
| Piriform Cortex | 0.59 | 0.33 to 0.76 | <0.0001 |
| Hippocampus | 0.38 | 0.07 to 0.62 | 0.02 |
| Amygdala | 0.65 | 0.41 to 0.80 | <0.0001 |
| Medial Thalamus | 0.64 | 0.40 to 0.79 | <0.0001 |
| Dorsolateral Thalamus | 0.46 | 0.16 to 0.67 | 0.003 |
Table 4.
Spearman correlation coefficients between averaged seizure scores and mean T2 values at day 28 across all 5 volumes of interest (VOIs). (rs: Spearman correlation coefficient, CI: confidence interval).
| VOI | Correlation between averaged seizure score at 4 h vs T2 value at day 28 |
||
|---|---|---|---|
| rs | 95% CI | p | |
| Piriform Cortex | −0.07 | −0.38 to 0.26 | 0.7 |
| Hippocampus | 0.39 | 0.07 to 0.63 | 0.02 |
| Amygdala | 0.08 | −0.25 to 0.39 | 0.6 |
| Medial Thalamus | −0.62 | −0.78 to −0.37 | <0.0001 |
| Dorsolateral Thalamus | −0.62 | −0.78 to −0.37 | <0.0001 |
4. Discussion
Our study utilized T2 mapping to quantify MR scans collected longitudinally in a rat model of acute DFP intoxication. Our results revealed patterns of region-specific and time-dependent changes in T2 values in brain regions known to be impacted by acute OP intoxication (Lemercier et al., 1983; Chen, 2012). Treatment with ALLO, in combination with MDZ (DUO), significantly attenuated DFP-induced changes in T2, highlighting it’s potential in mitigating brain injury following acute DFP intoxication. Significant differences in regional mean T2 values between treatment groups evolved with time, demonstrating the advantages of T2 mapping as a non-invasive biomarker for longitudinal monitoring of dynamic brain injury from acute OP intoxication and its mitigation by therapy.
Mean T2 values were significantly elevated in the DFP group on day 3 in all assessed brain VOIs compared to VEH controls. This increase was corroborated by the appearance of hyperintense lesions in those VOIs on the corresponding T2 parametric maps, and suggest that the observed T2 hyperintensity is the result of cerebral edema (Loubinoux et al., 1997; Testylier et al., 2007). Our results are consistent with previous studies of rodent models of acute intoxication with the nerve agent soman or the pesticide paraoxon (Gullapalli et al., 2010; Shrot et al., 2012, 2015; Lee et al., 2020), as well as SE induced by kainic acid (Liachenko et al., 2015) or lithium-pilocarpine intoxication (Roch et al., 2002; Fabene et al., 2003; Duffy et al., 2014; Suleymanova et al., 2016). Specifically, consistent with our observations, these published studies noted increased T2 values at early stages post-intoxication, which were similarly attributed to edema.
While correlative histology was not conducted in this study, and is thus a limitation, the hyperintense lesions apparent on T2-weighted images and T2 maps were highly consistent with regards to visual appearance and spatial distribution to lesions detected in previous MRI-based assessments of acute OP intoxicated rodent models in mice (Testylier et al., 2007), rats (Bar-Klein et al., 2017; Lee et al., 2020; Reddy et al., 2020), and guinea pigs (Gullapalli et al., 2010). In these studies, T2 or T2-weighted abnormalities on MR images were mapped onto, or show high levels of correlation with, areas of neuronal necrosis (Hobson et al., 2017; Reddy et al., 2020), neurodegeneration (Gullapalli et al., 2010), and neuroinflammation (Hobson et al., 2017) as identified histologically. This association between lesions on T2 MRI and underlying edema, cell death, and inflammation is consistent with the interpretation of T2 MRI in the broader field of preclinical seizure and epilepsy models (Gröhn and Pitkänen, 2007; Liachenko et al., 2015; Reddy et al., 2019). Additionally, histological and biochemical assessments of these same brain areas in DFP intoxicated rats (Sisó et al., 2017; Kuruba et al., 2018; Lee et al., 2020; Supasai et al., 2020) that used hematoxylin-eosin (H&E) staining or FluoroJade C staining and immunohistochemical analyses detected severe neuronal necrosis, microgliosis, reactive astrogliosis. Thus, while the present study utilized longitudinal in vivo MRI rather than histological assessment, the data suggest significant underlying neuropathology resultant to DFP intoxication.
At the 7 day timepoint, we observed a reduction in mean T2 values relative to day 3 across all VOIs in the DFP group. While the most likely explanation of this effect is the attenuation of edema, we acknowledge that this normalization may be the result of concurrent mechanisms with differential effects on T2. Specifically, increased T2 due to edematous processes may coincide with mechanisms driving the decreased T2 values seen at later timepoints, such as mineralization (discussed below). In this regard, we observed a reduction in the standard deviation of T2 values at the 7 day timepoint across regions, suggesting the attenuation of edema rather than a cancellation of T2 effects due to competing mechanisms. This pattern of increased and subsequently decreased mean T2 during the first week post-OP intoxication has been previously reported (Gullapalli et al., 2010; Shrot et al., 2015) and is consistent with the slow restoration of the blood brain barrier (Bar-Klein et al., 2017; Bernardino et al., 2023) and may be associated with subsiding of vasogenic edema (Carpentier et al., 1990). However, mean T2 values remained elevated in the piriform cortex on day 7. The persistent injury in the piriform cortex may be the result of more severe underlying neuropathology that has been previously reported in the piriform cortex in animal models of acute OP intoxication (Bailie et al., 2005; de Araujo Furtado et al., 2012; Sisó et al., 2017) and has been characterized by marked reduction in tissue cellularity following pan necrosis and tissue liquification. In terms of regional progression of injury beyond 7 days, at the 28 day timepoint, T2 values in the amygdala further decreased to levels observed in VEH group, suggesting near complete resolution of the edematous process.
The spatiotemporal progression of edema detected by T2 imaging following OP intoxication has varied significantly across studies. In a guinea pig model of soman intoxication, mean T2 values remained elevated at day 7 in the piriform cortex, amygdala and thalami, but returned to VEH levels in the hippocampus (Gullapalli et al., 2010). This is in partial agreement with our study where mean T2 values at day 7 remained elevated in the piriform cortex. However, another study of acute paraoxon intoxication reported no changes in T2 in any VOI of the rat brain at 7 days post-exposure (Shrot et al., 2012). Elevated T2 values at timepoints beyond 7 days have also been reported in the lithium pilocarpine model of SE that reported elevated T2 values persisting until the 30-day time point (Suleymanova et al., 2016), specifically in the parietal and prefrontal cortices. These discrepancies in patterns of T2 across studies could be due to differences in the specific mechanism by which the intoxicating agent induces SE (Banks and Lein, 2012), intra-species variability (Calsbeek et al., 2021), or the variation in MR image quality resulting from the tradeoff between acquisition time, spatial resolution, and signal to noise, as well as image analysis methods.
A unique finding of the present work is the significant reduction in T2 values in the medial and dorsolateral thalamus at 28 days post-acute OP intoxication. Visual inspection of T2 maps (Fig. 3) revealed small hypointense lesions in both these VOIs. The stark drop-out in signal and reduction of estimated T2 values is suggestive of magnetic susceptibility effects, often associated with the presence of mineral deposits (Langkammer et al., 2012), which can alter the local magnetic field, thereby reducing the T2 values (Borradaile, 1988; Schenck, 1996). Dystrophic mineralization in the thalamus is a common finding in preclinical models of acute OP intoxication (Kadar et al., 1995; Pouliot et al., 2016; Sisó et al., 2017) and preclinical models of epilepsy (Gramsbergen and van den Berg, 1994; Gayoso et al., 2003; Aggarwal et al., 2018). Previous ex vivo studies using CT (González et al., 2020) and histology (Kadar et al., 1995; Sisó et al., 2017) have described mineralized lesions with a similar spatial pattern within the hippocampus and thalami as a long-term consequence of DFP intoxication. While the appearance of these lesions is consistent with mineralization, their exact origin remains unclear, and may be the result of multiple pathological processes associated with OP intoxication including, but not limited, to neuroinflammation (Maheshwari et al., 2022), necrotic (Gezercan et al., 2016) or non-necrotic (Deshpande et al., 2010) calcium dysregulation (Deshpande et al., 2010), and slow accumulation of iron following the development of spontaneous recurrent seizures (Zimmer et al., 2021). Nonetheless, their development and effect on T2 following DFP intoxication appears to have been significantly attenuated following administration of MDZ and ALLO.
Administration of 1.8 mg/kg of MDZ reduced T2 values in the hippocampus and thalamic VOIs at day 3 compared to DFP alone. In addition to these VOIs, a single 24 mg/kg dose of ALLO administered 40 min post-DFP exposure consistently reduced T2 hyperintense lesions in the piriform cortex as well. Furthermore, combined treatment with ALLO and MDZ (DUO) not only diminished the early increase in mean T2 values across all VOIs, but also attenuated the T2 hypointensity observed in both the thalamic VOIs at the 28 day timepoint in the DFP group. By comparison, MDZ or ALLO alone did not significantly alter T2 values in any VOI at the 7 or 28 day timepoint when compared to the DFP group. These observations strongly suggest that ALLO, particularly administered alongside MDZ, may be a more effective strategy than MDZ alone in attenuating OP-related neuropathology.
The ability of a one-time combined dose of ALLO and MDZ (DUO therapy) to attenuate both the initial hyperintense lesions and their later hypointense counterparts is likely attributable to an improvement in anti-seizure performance compared to MDZ or ALLO alone. Administration of DUO significantly reduced seizure behavior when compared to MDZ alone. We observed significant positive correlations between the average seizure score over the 4-h monitoring window after DFP intoxication and mean T2 values in all VOIs assessed at the 3-day timepoint. Additionally, the significant negative correlation between averaged seizure score at 4 h and T2 measured at day 28 in the medial and dorsolateral thalamus likely reflect an association between seizure severity and mineralization. The DUO group had the lowest seizure score at 4 h, followed by the ALLO and then the MDZ groups, which was in agreement with the spatiotemporal patterns of T2, where administration of the DUO treatment appeared to be most effective in attenuating both hyper- and hypointense lesions, followed by ALLO. While both ALLO and MDZ are positive allosteric modifiers of the GABAA receptor, each binds to a distinct subset of GABAA receptor subtypes (Rogawski et al., 2013). Benzodiazepine-sensitive GABAA receptors are synaptic receptors that function to decrease neuronal excitability (Masiulis et al., 2019). These synaptic receptors are rapidly internalized during SE (Naylor et al., 2005), which diminishes the therapeutic effectiveness of benzodiazepines, such as MDZ. By contrast, ALLO binds not only synaptic but also extrasynaptic α4δ GABAA receptors (Mostallino et al., 2006) that are not internalized during seizure, and may mediate tonic inhibition. The broader target specificity of ALLO likely explains the improved performance of the DUO therapy. While it is difficult to speculate on the impact of the DUO therapy with regards to long-term outcomes of OP intoxication such as SRS and cognition, there is some evidence that attenuation of T2-related lesions on MRI is associated with a reduction is long-term brain atrophy. Guinea pigs intoxicated with the OP nerve agent soman exhibited a similar pattern of T2 elevation in the hippocampus followed by an expansion of ventricular CSF highly suggestive of brain atrophy (Gullapalli et al., 2010). Similarly, in a rat model of lithium-pilocarpine-induced SE, initial increases in T2 in the hippocampus were replaced by expansion of the lateral ventricles and a marked reduction in hippocampal volume (Suleymanova et al., 2014). In both models, intervention with candidate therapies attenuated both the increased T2 and the subsequent atrophy. In the guinea pig model this attenuation associated in reduced histopathological evidence of neuronal cell death in the same spatial location as the T2-weighted lesions (Gullapalli et al., 2010). Notably, in a mouse model of SE using pilocarpine, animals that experienced SE developed T2 increases in the hippocampus, piriform cortex, and amygdala similar to the present study, and subsequent hippocampal atrophy. When a subset of animals was further instrumented with EEG, no association was observed between these changes and spike frequency when assessed during a randomly selected 96 h window (Kharatishvili et al., 2014). Such data indicate T2 may not be predictive of long-term electrographic abnormalities; however, a more comprehensive assessment by EEG following T2 MRI is warranted.
In addition to mean T2 values, our study analyzed additional T2 metrics, including standard deviation, skewness, and kurtosis. Across regions, the standard deviation of T2 values was increased in the DFP group relative to controls. This higher level of intra-tissue variance is inline with our previous work demonstrating a similar increase in intra-regional variance in tissue diffusion following DFP intoxication (Hobson et al., 2017). These results suggest subregional structures, such as neuronal cell layers, are experiencing varying levels of underlying neuropathological processes such as edema, necrosis, or inflammation (Hobson et al., 2017, 2018; Sisó et al., 2017). The increased skewness, in the hippocampus, would further suggest that the observed changes in mean T2 may be similarly driven by localized regions of severe neuropathology. Kurtosis assesses the degree by which the mean is influenced by extreme values in the tails of the distribution. Thus, increases in kurtosis may indicate spatially heterogeneous effects of DFP intoxication on the underlying tissue while reduced kurtosis may indicate that a given brain area experienced a more spatially homogenous effect. While some patterns exhibited by these novel metrics were unique, differences were not as striking as those detected by the mean metric. Further, it is important to note that while the subject numbers in the present study demonstrated robust effects of DFP intoxication and therapeutic rescue as determined by analysis of mean values, assessments of skewness and kurtosis values are typically much more meaningful when significantly larger datasets are evaluated (Cain et al., 2017). Finally, methods for texture analysis of images have recently been developed that capture even higher order information from image intensity features (Gillies et al., 2016). It is possible that such analyses may aid in the detection of subtle features not detected by current metrics (Crombé et al., 2021).
Traditional T2-weighted images were limited in their sensitivity to detect lesions one-week post-acute DFP intoxication (Hobson et al., 2017). In contrast, T2 mapping enabled absolute quantification and further eliminated dependencies on extraneous factors such as acquisition parameters, signal amplifier gains and geometry of receiver coil (Deoni, 2010), thereby resulting in better reproducibility of intensity values across scans and timepoints. Previous methods have evaluated diffusion weighted imaging (DWI) for tracking pathology in the brain of rats acutely intoxicated with DFP (Testylier et al., 2007; Rosman et al., 2012; Shrot et al., 2015; Hobson et al., 2017). These studies showed heterogenous diffusion in regions that align with those exhibiting T2 alterations in our study. It is currently unclear if DWI metrics could provide complementary information compared to that from T2 maps. Additionally, there could be value in comparing assessments of neuroinflammation through positron emission tomography (PET) imaging (Sisó et al., 2017; Hobson et al., 2019) to evaluate spatiotemporal changes in neuroinflammation in the brain relative to lesions identified on the T2 maps (Shrot et al., 2015; Hobson et al., 2017, 2018). While beyond the scope of this study, such a head-to-head comparison of other in vivo imaging metrics and those derived from T2 maps is warranted in future studies.
Our study focused on the effects of ALLO and MDZ on animals underdoing acute OP intoxication and did not include separate assessments of ALLO and MDZ on animals not intoxicated with DFP. Similar dosing of ALLO was well tolerated in rats (Irwin et al., 2015; Dhir et al., 2020) and MDZ is canonically used at similar doses in preclinical models of OP intoxication and epilepsy (Schläppi, 1983; Reddy and Reddy, 2015) without adverse outcomes. Thus, while we do not anticipate any meaningful effect of these agents on T2 in healthy animals, we are unable to decisively conclude this based on the data from the present study. We analyzed five brain VOIs chosen because of their known significance as targets of acute OP intoxication. A comparative analysis of T2 signals in these VOIs with other brain regions could provide comprehensive insight into the whole-brain impact of acute OP intoxication. While manual delineation of MRI scans is tedious, these analyses could be facilitated by recent advancements in machine learning techniques enabling more efficient and accurate brain regional analysis (Feo and Giove, 2019). While all the animals included in the present study were males, we are currently performing experiments with male and female rats to account for gender differences. Lastly, a pragmatic choice was made at the beginning of the study to balance factors such as spatial resolution, signal-to-noise ratio, number of echoes and acquisition time to tailor the imaging protocol to the specific goals of this project. A different trade-off between imaging parameters may be needed when implementing our method for other strains or species or when using an MRI scanner operating at a different field strength or having a different hardware configuration.
In conclusion our study demonstrates the potential for T2 mapping as a valuable, quantitative tool to track brain injury resulting from OP-intoxication and to assess the efficacy of neuroprotective therapies. It also highlights the potential of the neurosteroid ALLO as an adjunct therapy for mitigating OP-induced damage. The availability of analogous methods for T2 mapping for human brain imaging (Carr and Purcell, 1954; Meiboom and Gill, 1958; Peters et al., 2007) suggests that the findings from our study could be translated to clinical settings (Peters et al., 2007). With the increasing availability of MRI, T2 mapping could serve as a useful tool for developing broad-spectrum medical counter-measures against various seizure-inducing chemicals, where longitudinal monitoring of brain injury and therapeutic response is crucial.
Supplementary Material
Funding
This work was supported by the National Institutes of Health [grant numbers U54 NS079202, U54 NS127758 and R21 AG064599] and the National Center for Advancing Translational Sciences [grant number UL1 TR001860 and linked award TL1 TR001861].
Abbreviations
- AIC
Akaike information criterion
- ALLO
allopregnanolone
- CI
confidence interval
- DFP
diisopropylfluorophosphate
- TE
echo time
- FDR
false discovery rate
- FOV
field of view
- GMR
geometric mean ratio
- H&E
hematoxylin-eosin
- MRI
magnetic resonance imaging
- MDZ
midazolam
- MSME
multi-slice multi-echo
- OP
organophosphate
- SE
status epilepticus
- VEH
vehicle
- VOIs
volumes of interest
- RARE
rapid acquisition with relaxation enhancement
- SLUD
Salivation, Lacrimation, Urination and Defecation
- TR
repetition time
Footnotes
CRediT authorship contribution statement
Alita Jesal D. Almeida: Conceptualization, Data curation, Formal analysis, Investigation, Methodology, Software, Validation, Writing – original draft, Writing – review & editing. Brad A. Hobson: Conceptualization, Data curation, Formal analysis, Investigation, Methodology, Supervision, Validation, Writing – original draft, Writing – review & editing. Naomi Saito: Data curation, Formal analysis, Investigation, Software, Writing – review & editing. Donald A. Bruun: Data curation, Investigation, Methodology, Validation, Writing – review & editing. Valerie A. Porter: Data curation, Investigation, Writing – review & editing. Danielle J. Harvey: Data curation, Formal analysis, Investigation, Methodology, Resources, Software, Supervision, Validation, Writing – original draft, Writing – review & editing. Joel R. Garbow: Conceptualization, Investigation, Methodology, Validation, Writing – review & editing. Abhijit J. Chaudhari: Conceptualization, Investigation, Methodology, Project administration, Resources, Supervision, Writing – original draft, Writing – review & editing. Pamela J. Lein: Conceptualization, Funding acquisition, Investigation, Methodology, Project administration, Resources, Supervision, Writing – review & editing.
Declaration of competing interest
The authors declare the following financial interests/personal relationships which may be considered as potential competing interests:
Pamela J. Lein has patent Mitigation of epileptic seizures by combination therapy using benzodiazepines and neurosteroids issued to The Regents of the University of California.
Appendix A. Supplementary data
Supplementary data to this article can be found online at https://doi.org/10.1016/j.neuropharm.2024.109895.
Data availability
Data will be made available on request.
References
- Aggarwal M, et al. , 2018. Nuclei-specific deposits of iron and calcium in the rat thalamus after status epilepticus revealed with quantitative susceptibility mapping (QSM). J. Magn. Reson. Imag. : JMRI 47 (2), 554–564. 10.1002/jmri.25777. [DOI] [PMC free article] [PubMed] [Google Scholar]
- Akaike H, 1974. A new look at the statistical model identification. IEEE Trans. Automat. Control 19 (6), 716–723. 10.1109/TAC.1974.1100705. [DOI] [Google Scholar]
- de Araujo Furtado M, et al. , 2012. Exposure to nerve agents: from status epilepticus to neuroinflammation, brain damage, neurogenesis and epilepsy. Neurotoxicology 33 (6), 1476–1490. 10.1016/j.neuro.2012.09.001. [DOI] [PubMed] [Google Scholar]
- Baille V, et al. , 2005. Soman-induced convulsions: the neuropathology revisited. Toxicology 215 (1–2), 1–24. 10.1016/j.tox.2005.05.028. [DOI] [PubMed] [Google Scholar]
- Banks CN, Lein PJ, 2012. A review of experimental evidence linking neurotoxic organophosphorus compounds and inflammation. Neurotoxicology 33 (3), 575–584. 10.1016/j.neuro.2012.02.002. [DOI] [PMC free article] [PubMed] [Google Scholar]
- Bar-Klein G, et al. , 2017. Imaging blood–brain barrier dysfunction as a biomarker for epileptogenesis. Brain 140 (6), 1692–1705. 10.1093/brain/awx073. [DOI] [PubMed] [Google Scholar]
- Bernardino PN, et al. , 2023. Time- and region-dependent blood-brain barrier impairment in a rat model of organophosphate-induced status epilepticus. Neurobiol. Dis 187, 106316 10.1016/j.nbd.2023.106316. [DOI] [PMC free article] [PubMed] [Google Scholar]
- Bhagat YA, et al. , 2005. Neuroprotection from soman-induced seizures in the rodent: evaluation with diffusion- and T2-weighted magnetic resonance imaging. Neurotoxicology 26 (6), 1001–1013. 10.1016/j.neuro.2005.04.006. [DOI] [PubMed] [Google Scholar]
- Bhagat Yusuf A., Obenaus André, Hamilton Murray G., Kendall EJ, 2001. Magnetic resonance imaging predicts neuropathology from soman-mediated seizures in the rodent. Neuroreport 12 (7), 1481–1487. [DOI] [PubMed] [Google Scholar]
- Borradaile GJ, 1988. Magnetic susceptibility, petrofabrics and strain. Tectonophysics 156 (1–2), 1–20. 10.1016/0040-1951(88)90279-X. [DOI] [Google Scholar]
- Bouchard MF, et al. , 2010. Attention-deficit/hyperactivity disorder and urinary metabolites of organophosphate pesticides. Pediatrics 125 (6), e1270–e1277. 10.1542/peds.2009-3058. [DOI] [PMC free article] [PubMed] [Google Scholar]
- Bruun DA, et al. , 2019. Pretreatment with pyridostigmine bromide has no effect on seizure behavior or 24 hour survival in the rat model of acute diisopropylfluorophosphate intoxication. Neurotoxicology 73, 81–84. 10.1016/j.neuro.2019.03.001. [DOI] [PMC free article] [PubMed] [Google Scholar]
- Cain MK, Zhang Z, Yuan K-H, 2017. Univariate and multivariate skewness and kurtosis for measuring nonnormality: prevalence, influence and estimation. Behav. Res. Methods 49 (5), 1716–1735. 10.3758/s13428-016-0814-1. [DOI] [PubMed] [Google Scholar]
- Calsbeek JJ, et al. , 2021. Strain differences in the extent of brain injury in mice after tetramethylenedisulfotetramine-induced status epilepticus. Neurotoxicology 87, 43–50. 10.1016/j.neuro.2021.08.011. [DOI] [PMC free article] [PubMed] [Google Scholar]
- Carpentier P, et al. , 1990. Seizure-related opening of the blood-brain barrier induced by soman: possible correlation with the acute neuropathology observed in poisoned rats. Neurotoxicology 11 (3), 493–508. http://www.ncbi.nlm.nih.gov/pubmed/2284054. [PubMed] [Google Scholar]
- Carr HY, Purcell EM, 1954. Effects of diffusion on free precession in nuclear magnetic resonance experiments. Phys. Rev 94 (3), 630–638. 10.1103/PhysRev.94.630. [DOI] [Google Scholar]
- Chen Y, 2012. Organophosphate-induced brain damage: mechanisms, neuropsychiatric and neurological consequences, and potential therapeutic strategies. Neurotoxicology 33 (3), 391–400. 10.1016/j.neuro.2012.03.011. [DOI] [PubMed] [Google Scholar]
- Crombé A, et al. , 2021. Assessment of repeatability, reproducibility, and performances of T2 mapping-based radiomics features: a comparative study. J. Magn. Reson. Imag 54 (2), 537–548. 10.1002/jmri.27558. [DOI] [PubMed] [Google Scholar]
- Deoni SCL, 2010. Quantitative relaxometry of the brain. Top. Magn. Reson. Imag 21 (2), 101–113. 10.1097/RMR.0b013e31821e56d8. [DOI] [PMC free article] [PubMed] [Google Scholar]
- Deshpande LS, et al. , 2010. Development of a prolonged calcium plateau in hippocampal neurons in rats surviving status epilepticus induced by the organophosphate diisopropylfluorophosphate. Toxicol. Sci. : an official journal of the Society of Toxicology 116 (2), 623–631. 10.1093/toxsci/kfq157. [DOI] [PMC free article] [PubMed] [Google Scholar]
- Dhir A, et al. , 2020. Allopregnanolone and perampanel as adjuncts to midazolam for treating diisopropylfluorophosphate-induced status epilepticus in rats. Ann. N. Y. Acad. Sci 1480 (1), 183–206. 10.1111/nyas.14479. [DOI] [PMC free article] [PubMed] [Google Scholar]
- Duffy BA, et al. , 2014. Dexamethasone exacerbates cerebral edema and brain injury following lithium-pilocarpine induced status epilepticus. Neurobiol. Dis 63, 229–236. 10.1016/j.nbd.2013.12.001. [DOI] [PMC free article] [PubMed] [Google Scholar]
- Fabene PF, et al. , 2003. Magnetic resonance imaging of changes elicited by status epilepticus in the rat brain: diffusion-weighted and T2-weighted images, regional blood volume maps, and direct correlation with tissue and cell damage. Neuroimage 18 (2), 375–389. 10.1016/S1053-8119(02)00025-3. [DOI] [PubMed] [Google Scholar]
- Feo R, Giove F, 2019. Towards an efficient segmentation of small rodents brain: a short critical review. J. Neurosci. Methods 323, 82–89. 10.1016/j.jneumeth.2019.05.003. [DOI] [PubMed] [Google Scholar]
- Figueiredo TH, et al. , 2018. Acute and long-term consequences of exposure to organophosphate nerve agents in humans. Epilepsia 59, 92–99. 10.1111/epi.14500. [DOI] [PMC free article] [PubMed] [Google Scholar]
- Gayoso MJ, et al. , 2003. Selective calcification of rat brain lesions caused by systemic administration of kainic acid. Histol. Histopathol 18 (3), 855–869. 10.14670/HH-18.855. [DOI] [PubMed] [Google Scholar]
- Gezercan Y, et al. , 2016. Six different extremely calcified lesions of the brain: brain stones. SpringerPlus 5 (1), 1941. 10.1186/s40064-016-3621-3. [DOI] [PMC free article] [PubMed] [Google Scholar]
- Gillies RJ, Kinahan PE, Hricak H, 2016. Radiomics: images are more than pictures, they are data. Radiology 278 (2), 563–577. 10.1148/radiol.2015151169. [DOI] [PMC free article] [PubMed] [Google Scholar]
- González EA, et al. , 2020. The chemical convulsant diisopropylfluorophosphate (DFP) causes persistent neuropathology in adult male rats independent of seizure activity. Arch. Toxicol 94 (6), 2149–2162. 10.1007/s00204-020-02747-w. [DOI] [PMC free article] [PubMed] [Google Scholar]
- Gramsbergen JB, van den Berg KJ, 1994. Regional and temporal profiles of calcium accumulation and glial fibrillary acidic protein levels in rat brain after systemic injection of kainic acid. Brain Res. 667 (2), 216–228. 10.1016/0006-8993(94)91499-0. [DOI] [PubMed] [Google Scholar]
- Groeneveld RA, Meeden G, 1984. Measuring skewness and kurtosis. The Statistician 33 (4), 391. 10.2307/2987742. [DOI] [Google Scholar]
- Gröhn O, Pitkänen A, 2007. Magnetic resonance imaging in animal models of epilepsy—noninvasive detection of structural alterations. Epilepsia 48 (s4), 3–10. 10.1111/j.1528-1167.2007.01236.x. [DOI] [PubMed] [Google Scholar]
- Guignet M, et al. , 2020. Persistent behavior deficits, neuroinflammation, and oxidative stress in a rat model of acute organophosphate intoxication. Neurobiol. Dis 133, 104431 10.1016/j.nbd.2019.03.019. [DOI] [PMC free article] [PubMed] [Google Scholar]
- Gullapalli RP, et al. , 2010. Magnetic resonance imaging reveals that galantamine prevents structural brain damage induced by an acute exposure of Guinea pigs to soman. Neurotoxicology 31 (1), 67–76. 10.1016/j.neuro.2009.09.004. [DOI] [PubMed] [Google Scholar]
- Gunnell D, et al. , 2007. The global distribution of fatal pesticide self-poisoning: systematic review. BMC Public Health. BioMed Central 1–15. 10.1186/1471-2458-7-357. [DOI] [PMC free article] [PubMed] [Google Scholar]
- Hobson BA, et al. , 2017. From the cover: magnetic resonance imaging reveals progressive brain injury in rats acutely intoxicated with diisopropylfluorophosphate. Toxicol. Sci 157 (2), 342–353. 10.1093/toxsci/kfx049. [DOI] [PMC free article] [PubMed] [Google Scholar]
- Hobson BA, et al. , 2018. A magnetic resonance imaging study of early brain injury in a rat model of acute DFP intoxication. Neurotoxicology 66, 170–178. 10.1016/j.neuro.2017.11.009. [DOI] [PMC free article] [PubMed] [Google Scholar]
- Hobson BA, et al. , 2019. TSPO PET using [18F]PBR111 reveals persistent neuroinflammation following acute diisopropylfluorophosphate intoxication in the rat. Toxicol. Sci 170 (2), 330–344. 10.1093/toxsci/kfz096. [DOI] [PMC free article] [PubMed] [Google Scholar]
- Irwin RW, et al. , 2015. Allopregnanolone preclinical acute pharmacokinetic and pharmacodynamic studies to predict tolerability and efficacy for Alzheimer’s disease. PLoS One 10 (6), e0128313. 10.1371/journal.pone.0128313. [DOI] [PMC free article] [PubMed] [Google Scholar]
- John H, et al. , 2018. Fatal sarin poisoning in Syria 2013: forensic verification within an international laboratory network. Forensic Toxicol. 36 (1), 61–71. 10.1007/s11419-017-0376-7. [DOI] [PMC free article] [PubMed] [Google Scholar]
- Kadar T, et al. , 1995. Sarin-induced neuropathology in rats. Hum. Exp. Toxicol 14 (3), 252–259. 10.1177/096032719501400304. [DOI] [PubMed] [Google Scholar]
- Kharatishvili I, et al. , 2014. MRI changes and complement activation correlate with epileptogenicity in a mouse model of temporal lobe epilepsy. Brain Struct. Funct 219 (2), 683–706. 10.1007/s00429-013-0528-4. [DOI] [PubMed] [Google Scholar]
- Kumar S, et al. , 2018. Microbial degradation of organophosphate pesticides: a review. Pedosphere 28 (2), 190–208. 10.1016/S1002-0160(18)60017-7. [DOI] [Google Scholar]
- Kuruba R, Wu X, Reddy DS, 2018. Benzodiazepine-refractory status epilepticus, neuroinflammation, and interneuron neurodegeneration after acute organophosphate intoxication. Biochim. Biophys. Acta (BBA) - Mol. Basis Dis 1864 (9 Pt B), 2845–2858. 10.1016/j.bbadis.2018.05.016. [DOI] [PMC free article] [PubMed] [Google Scholar]
- Langkammer C, et al. , 2012. Quantitative susceptibility mapping (QSM) as a means to measure brain iron? A post mortem validation study. Neuroimage 62 (3), 1593–1599. 10.1016/j.neuroimage.2012.05.049. [DOI] [PMC free article] [PubMed] [Google Scholar]
- Lee K, et al. , 2020. Quantitative T2 MRI is predictive of neurodegeneration following organophosphate exposure in a rat model. Sci. Rep 10 (1) 10.1038/s41598-020-69991-z. [DOI] [PMC free article] [PubMed] [Google Scholar]
- Lemercier G, et al. , 1983. Histological and histochemical changes in the central nervous system of the rat poisoned by an irreversible anticholinesterase organophosphorus compound. Acta Neuropathol. 61 (2), 123–129. 10.1007/BF00697391. [DOI] [PubMed] [Google Scholar]
- Li Y, et al. , 2011. Spatiotemporal pattern of neuronal injury induced by DFP in rats: a model for delayed neuronal cell death following acute OP intoxication. Toxicol. Appl. Pharmacol 253 (3), 261–269. 10.1016/j.taap.2011.03.026. [DOI] [PMC free article] [PubMed] [Google Scholar]
- Liachenko S, et al. , 2015. Quantitative assessment of MRI T2 response to kainic acid neurotoxicity in rats in vivo. Toxicol. Sci 146 (1), 183–191. 10.1093/toxsci/kfv083. [DOI] [PubMed] [Google Scholar]
- Liachenko S, Ramu J, 2017. Quantification and reproducibility assessment of the regional brain T2 relaxation in naïve rats at 7T. J. Magn. Reson. Imag 45 (3), 700–709. 10.1002/jmri.25378. [DOI] [PubMed] [Google Scholar]
- Loubinoux I, et al. , 1997. Spreading of vasogenic edema and cytotoxic edema assessed by quantitative diffusion and T2 magnetic resonance imaging. Stroke 28 (2), 419–427. 10.1161/01.STR.28.2.419. [DOI] [PubMed] [Google Scholar]
- Lowenstein DH, Alldredge BK, 1998. Status epilepticus. N. Engl. J. Med 338 (14), 970–976. 10.1056/NEJM199804023381407. [DOI] [PubMed] [Google Scholar]
- Lumley L, et al. , 2019. Neurosteroid and benzodiazepine combination therapy reduces status epilepticus and long-term effects of whole-body sarin exposure in rats. Epilepsia open 4 (3), 382–396. 10.1002/epi4.12344. [DOI] [PMC free article] [PubMed] [Google Scholar]
- Maheshwari U, et al. , 2022. The interplay between brain vascular calcification and microglia. Front. Aging Neurosci 14 10.3389/fnagi.2022.848495. [DOI] [PMC free article] [PubMed] [Google Scholar]
- Marrs TC, 1993. Organophosphate poisoning. Pharmacol. Therapeut 58 (1), 51–66. 10.1016/0163-7258(93)90066-M. [DOI] [PubMed] [Google Scholar]
- Masiulis S, et al. , 2019. GABAA receptor signalling mechanisms revealed by structural pharmacology. Nature 565 (7740), 454–459. 10.1038/s41586-018-0832-5. [DOI] [PMC free article] [PubMed] [Google Scholar]
- Meiboom S, Gill D, 1958. Modified spin-echo method for measuring nuclear relaxation times. Rev. Sci. Instrum 29 (8), 688–691. 10.1063/1.1716296. [DOI] [Google Scholar]
- Mew EJ, et al. , 2017. The global burden of fatal self-poisoning with pesticides 2006-15: systematic review. J. Affect. Disord 219, 93–104. 10.1016/j.jad.2017.05.002. [DOI] [PubMed] [Google Scholar]
- Mostallino MC, et al. , 2006. Changes in expression of the δ subunit of the GABA A receptor and in receptor function induced by progesterone exposure and withdrawal. J. Neurochem 99 (1), 321–332. 10.1111/j.1471-4159.2006.04055.x. [DOI] [PubMed] [Google Scholar]
- Naylor DE, Liu H, Wasterlain CG, 2005. Trafficking of GABAA receptors, loss of inhibition, and a mechanism for pharmacoresistance in status epilepticus. J. Neurosci 25 (34), 7724–7733. 10.1523/JNEUROSCI.4944-04.2005. [DOI] [PMC free article] [PubMed] [Google Scholar]
- Nepovimova E, Kuca K, 2020. Novichoks. In: Handbook of Toxicology of Chemical Warfare Agents. Elsevier, pp. 143–148. 10.1016/B978-0-12-819090-6.00010-6. [DOI] [Google Scholar]
- Paxinos George, Watson C, 2007. The Rat Brain in Stereotaxic Coordinates. Academic Press [Preprint], London. [Google Scholar]
- Peters AM, et al. , 2007. T2* measurements in human brain at 1.5, 3 and 7 T. Magn. Reson. Imag 25 (6), 748–753. 10.1016/j.mri.2007.02.014. [DOI] [PubMed] [Google Scholar]
- Pouliot W, et al. , 2016. A rodent model of human organophosphate exposure producing status epilepticus and neuropathology. Neurotoxicology 56, 196–203. 10.1016/j.neuro.2016.08.002. [DOI] [PMC free article] [PubMed] [Google Scholar]
- Reddy DS, 2019. Mechanism-based novel antidotes for organophosphate neurotoxicity. Current Opinion in Toxicology 14, 35–45. 10.1016/j.cotox.2019.08.001. [DOI] [PMC free article] [PubMed] [Google Scholar]
- Reddy S, et al. , 2019. Neuroimaging biomarkers of experimental epileptogenesis and refractory epilepsy. Int. J. Mol. Sci 20 (1), 220. 10.3390/ijms20010220. [DOI] [PMC free article] [PubMed] [Google Scholar]
- Reddy SD, et al. , 2020. Magnetic resonance imaging analysis of long-term neuropathology after exposure to the nerve agent soman: correlation with histopathology and neurological dysfunction. Ann. N. Y. Acad. Sci 1480 (1), 116–135. 10.1111/nyas.14431. [DOI] [PMC free article] [PubMed] [Google Scholar]
- Reddy SD, Reddy DS, 2015. Midazolam as an anticonvulsant antidote for organophosphate intoxication-A pharmacotherapeutic appraisal. Epilepsia 56 (6), 813–821. 10.1111/epi.12989. [DOI] [PMC free article] [PubMed] [Google Scholar]
- Roch C, et al. , 2002. Magnetic resonance imaging in the study of the lithium-pilocarpine model of temporal lobe epilepsy in adult rats. Epilepsia 43 (4), 325–335. 10.1046/j.1528-1157.2002.11301.x. [DOI] [PubMed] [Google Scholar]
- Rogawski MA, et al. , 2013. Neuroactive steroids for the treatment of status epilepticus. Epilepsia 54, 93–98. 10.1111/epi.12289. [DOI] [PMC free article] [PubMed] [Google Scholar]
- Ronchetti E, 1985. Robust model selection in regression. Stat. Probab. Lett 3 (1), 21–24. [Google Scholar]
- Rosman Y, et al. , 2012. Using MRI for the assessment of paraoxon-induced brain damage and efficacy of antidotal treatment. J. Appl. Toxicol 32 (6), 409–416. 10.1002/jat.1715. [DOI] [PubMed] [Google Scholar]
- Schenck JF, 1996. The role of magnetic susceptibility in magnetic resonance imaging: MRI magnetic compatibility of the first and second kinds. Med. Phys 23 (6), 815–850. 10.1118/1.597854. [DOI] [PubMed] [Google Scholar]
- Schläppi B, 1983. Safety aspects of midazolam. Br. J. Clin. Pharmacol 16 (Suppl. 1), 37S–41S. 10.1111/j.1365-2125.1983.tb02269.x. [DOI] [PMC free article] [PubMed] [Google Scholar]
- Shrot S, et al. , 2012. Early in vivo MR spectroscopy findings in organophosphate-induced brain damage-potential biomarkers for short-term survival. Magn. Reson. Med 68 (5), 1390–1398. 10.1002/mrm.24155. [DOI] [PubMed] [Google Scholar]
- Shrot S, et al. , 2015. Early brain magnetic resonance imaging can predict short and long-term outcomes after organophosphate poisoning in a rat model. Neurotoxicology 48, 206–216. 10.1016/j.neuro.2015.04.003. [DOI] [PubMed] [Google Scholar]
- Sidell FR, Borak J, 1992. Chemical warfare agents: II. nerve agents. Ann. Emerg. Med 21 (7), 865–871. 10.1016/S0196-0644(05)81036-4. [DOI] [PubMed] [Google Scholar]
- Sisó S, et al. , 2017. Editor’s highlight: spatiotemporal progression and remission of lesions in the rat brain following acute intoxication with diisopropylfluorophosphate. Toxicol. Sci 157 (2), 330–341. 10.1093/toxsci/kfx048. [DOI] [PMC free article] [PubMed] [Google Scholar]
- Suleymanova E, Gulyaev M, Chepurnova N, 2014. Ginseng extract attenuates early MRI changes after status epilepticus and decreases subsequent reduction of hippocampal volume in the rat brain. Epilepsy Res. 108 (2), 223–231. 10.1016/j.eplepsyres.2013.11.018. [DOI] [PubMed] [Google Scholar]
- Suleymanova EM, Gulyaev MV, Abbasova KR, 2016. Structural alterations in the rat brain and behavioral impairment after status epilepticus: an MRI study. Neuroscience 315, 79–90. 10.1016/j.neuroscience.2015.11.061. [DOI] [PubMed] [Google Scholar]
- Supasai S, et al. , 2020. Acute administration of diazepam or midazolam minimally alters long-term neuropathological effects in the rat brain following acute intoxication with diisopropylfluorophosphate. Eur. J. Pharmacol 886, 173538 10.1016/j.ejphar.2020.173538. [DOI] [PMC free article] [PubMed] [Google Scholar]
- Tattersall J, 2009. Seizure activity post organophosphate exposure. Front. Biosci (14), 3688. 10.2741/3481. [DOI] [PubMed] [Google Scholar]
- Testylier G, et al. , 2007. Cerebral edema induced in mice by a convulsive dose of soman. Evaluation through diffusion-weighted magnetic resonance imaging and histology. Toxicol. Appl. Pharmacol 220 (2), 125–137. 10.1016/j.taap.2007.01.013. [DOI] [PubMed] [Google Scholar]
- Todorovic MS, et al. , 2012. Characterization of status epilepticus induced by two organophosphates in rats. Epilepsy Res. 101 (3), 268–276. 10.1016/j.eplepsyres.2012.04.014. [DOI] [PMC free article] [PubMed] [Google Scholar]
- Tsai Y-H, Lein PJ, 2021. Mechanisms of organophosphate neurotoxicity. Current Opinion in Toxicology 26, 49–60. 10.1016/j.cotox.2021.04.002. [DOI] [PMC free article] [PubMed] [Google Scholar]
- Tu AT, 2007. Toxicological and chemical aspects of sarin terrorism in Japan in 1994 and 1995. Toxin Rev. 26 (3), 231–274. 10.1080/15569540701496321. [DOI] [Google Scholar]
- Voorhees JR, et al. , 2017. Neurotoxicity in preclinical models of occupational exposure to organophosphorus compounds. Front. Neurosci 10 10.3389/fnins.2016.00590. [DOI] [PMC free article] [PubMed] [Google Scholar]
- White H, 1980. A heteroskedasticity-consistent covariance matrix estimator and a direct test for heteroskedasticity. Econometrica 48 (4), 817. 10.2307/1912934. [DOI] [Google Scholar]
- Wu X, Kuruba R, Reddy DS, 2018. Midazolam-resistant seizures and brain injury after acute intoxication of diisopropylfluorophosphate, an organophosphate pesticide and surrogate for nerve agents. J. Pharmacol. Exp. Therapeut 367 (2), 302–321. 10.1124/jpet.117.247106. [DOI] [PMC free article] [PubMed] [Google Scholar]
- Yamasue H, et al. , 2007. Human brain structural change related to acute single exposure to sarin. Ann. Neurol 61 (1), 37–46. 10.1002/ana.21024. [DOI] [PubMed] [Google Scholar]
- Young RA, Watson A, 2020. Organophosphate nerve agents. In: Handbook of Toxicology of Chemical Warfare Agents. Elsevier. 10.1016/B978-0-12-819090-6.00008-8. [DOI] [Google Scholar]
- Zimmer TS, et al. , 2021. Seizure-mediated iron accumulation and dysregulated iron metabolism after status epilepticus and in temporal lobe epilepsy. Acta Neuropathol. 142 (4), 729–759. 10.1007/s00401-021-02348-6. [DOI] [PMC free article] [PubMed] [Google Scholar]
Associated Data
This section collects any data citations, data availability statements, or supplementary materials included in this article.
Supplementary Materials
Data Availability Statement
Data will be made available on request.