

Abstract
Background
The study aims to evaluate the diagnostic efficacy of contrast-enhanced ultrasound (CEUS) and shear-wave elastography (SWE) in detecting small malignant breast nodules in an effort to inform further refinements of the Breast Imaging Reporting and Data System (BI-RADS) classification system.
Methods
This study retrospectively analyzed patients with breast nodules who underwent conventional ultrasound, CEUS, and SWE at Gongli Hospital from November 2015 to December 2019. The inclusion criteria were nodules ≤ 2 cm in diameter with pathological outcomes determined by biopsy, no prior treatments, and solid or predominantly solid nodules. The exclusion criteria included pregnancy or lactation and low-quality images. Imaging features were detailed and classified per BI-RADS. Diagnostic accuracy was assessed using receiver operating characteristic curves.
Results
The study included 302 patients with 305 breast nodules, 113 of which were malignant. The diagnostic accuracy was significantly improved by combining the BI-RADS classification with CEUS and SWE. The combined approach yielded a sensitivity of 88.5%, specificity of 87.0%, positive predictive value of 80.0%, negative predictive value of 92.8%, and accuracy of 87.5% with an area under the curve of 0.877. Notably, 55.8% of BI-RADS 4A nodules were downgraded to BI-RADS 3 and confirmed as benign after pathological examination, suggesting the potential to avoid unnecessary biopsies.
Conclusion
The integrated use of the BI-RADS classification, CEUS, and SWE enhances the accuracy of differentiating benign and malignant small breast nodule, potentially reducing the need for unnecessary biopsies.
Keywords: Contrast-enhanced ultrasound, Shear-wave elastography, Small breast nodule, Ultrasound, BI-RADS classification
Introduction
Breast cancer is the most frequently diagnosed cancer among women and the second leading cause of cancer-related, contributing significantly to morbidity (Siegel et al., 2022; Sung et al., 2021). The asymptomatic detection of breast abnormalities during screenings is prevalent among women diagnosed with breast cancer. In the United States, the 5-year survival rates for localized, regional, and distant breast cancer are 99%, 85%, and 27%, respectively, highlighting the critical importance of early detection and intervention (DeSantis et al., 2017).
Large-scale screening programs have been demonstrated to reduce overall breast cancer mortality by 20% and early-stage mortality by 60% (Nothacker et al., 2009). In China, the higher prevalence of small breast volumes and dense breast tissue represents challenges for mammography, reducing its sensitivity in malignancy detection (Bae & Kim, 2016; Lai & Law, 2015). Ultrasound is crucial for breast cancer screening because of its cost-effectiveness, portability, and accessibility (Geisel, Raghu & Hooley, 2018). In dense breast tissue in particular, ultrasound outperforms mammography in characterizing suspicious lesions (Lee et al., 2010). However, small nodules (≤2 cm) often lack clear ultrasound features, leading to clinical oversight (Welch et al., 2016).
The Breast Imaging Reporting and Data System (BI-RADS) has significantly improved diagnostic accuracy by standardizing breast ultrasonography reporting, thereby increasing the sensitivity in identifying malignant masses (Nam et al., 2016; Zhu et al., 2018). Despite these improvements, the false-positive rate remains high, reflecting the limitations of subjective clinical assessments in conventional ultrasound (Castro et al., 2017; Pistolese et al., 2019; Yeo et al., 2018). This underscores the ongoing necessity for ultrasound-guided biopsies to confirm early breast cancer diagnoses.
According to management guidelines, BI-RADS category 4A nodules warrant biopsies because of their malignancy risk of 3%–10% (Mercado, 2014).
However, biopsies are invasive, they carry needle-related risks, and they impose financial and psychological burdens on patients. Therefore, enhancing screening tools and algorithms to minimize biopsies is imperative.
Advances in contrast-enhanced ultrasound (CEUS) and shear-wave elastography (SWE) offer the potential to refine breast nodule diagnosis. CEUS provides detailed contrast sonograms that highlight the vascularity and morphology of tumors by exploiting tissue-specific acoustic properties (Ji et al., 2017). SWE assesses tissue stiffness by measuring shear wave velocity, aiding in the differentiation of benign and malignant lesions (Youk, Gweon & Son, 2017). Previous investigations indicated that the use of multimodal ultrasound, which integrates CEUS or SWE with traditional ultrasound, can markedly enhance the efficiency of breast cancer diagnosis (Liu et al., 2019; Xiang et al., 2017). Nonetheless, there is a dearth of thorough assessments of the synergistic application of ultrasound, CEUS, and SWE in the detection of small breast cancers and the potential to minimize the number of unwarranted biopsies.
This study evaluated the diagnostic efficacy of CEUS and SWE in detecting small malignant breast nodules to potentially inform further refinements of the BI-RADS classification system.
Materials and Methods
Study design and patients
This retrospective study enrolled all patients with breast nodules who underwent conventional ultrasound, CEUS, and SWE at Gongli Hospital between November 2015 and December 2019. The Ethics Committee of Gongli Hospital approved this study (#[2020] Provisional Trial No. (003)). Given its retrospective design, the requirement for individual consent was waived by the committee. All patient details have been de-identified. The reporting of this study conforms to the STROBE guidelines as per the recommendation (von Elm et al., 2007).
The inclusion criteria encompassed patients who met the following criteria: (1) a breast nodule with a diameter of ≤2 cm with pathological outcomes based on the results of surgical or needle biopsy, (2) no prior treatment for a breast nodule before ultrasonography, and (3) a solid or predominantly solid breast nodule (with the cystic component constituting <25% of the total volume). The breast density of the patients included in this study comprises Type B, Type C, and Type D as determined by ultrasound characteristics. These types reflect a range of breast tissue compositions, including predominantly fibrous (Type B), heterogeneous density with both fibrous and glandular elements (Type C), and predominantly glandular tissue (Type D), which can influence the sensitivity of imaging techniques and the interpretation of findings.
Conversely, the exclusion criteria were (1) pregnancy or lactation and (2) low-quality breast nodule images that were unsuitable for analysis, including cases with blurriness on conventional ultrasound or inconclusive SWE measurements.
For clarity, patients with BI-RADS category 1 lesions, indicating no abnormalities, were excluded from the study. Additionally, patients with BI-RADS category 2 lesions were also excluded. The rationale for this exclusion is that category 2 nodules are typically benign and they often require no further investigation beyond regular follow-up. It is only when these nodules exhibit changes that might warrant a change in the BI-RADS classification that additional imaging or biopsy is considered. A visual representation of the patient selection process is detailed in Fig. 1.
Figure 1. Flowchart of patient selection.

Data collection and imaging examinations
Information on age, tumor size, location, shape, orientation, margins, echo patterns, posterior acoustic features, calcification, vascularity, and lymph node metastasis was retrieved from the patients’ medical records. The multimodality ultrasound examinations were all performed on the same day.
Conventional ultrasound
Operators recorded comprehensive details regarding nodular characteristics, encompassing location, size, shape, orientation, margin, echo pattern, posterior acoustic features, calcification, and vascularity. Subsequently, lesions were classified according to the BI-RADS classification system. In cases in which multiple nodules were present, the nodule with the highest BI-RADS classification was included in the study. If two nodules held the highest BI-RADS classification, both were included concurrently.
SWE
During the study period, a Siemens Acuson S3000 ultrasound diagnostic apparatus (Siemens Medical Solutions, Mountain View, CA, USA) equipped with SWE imaging software was employed for SWE. SWE was conducted when the gray-scale ultrasound indicated that the maximum diameter of the lesion and the image clarity was optimal. The SWE sampling frame size was adjusted to be at least twice the size of the nodules, and patients were instructed to briefly hold their breath after achieving image stability. The SWE speed mode was utilized to directly derive the shear-wave velocity (SWV) across the two-dimensional spatial distribution of the SWE imaging map. The SWV range was gradually fine-tuned (with a maximum of 10.0 m/s) when the interior regions of the nodules displayed red or yellow hues, whereas the surrounding areas appeared blue or green. Multiple regions of interest (typically 5–7) were strategically positioned within various areas within the nodules (upper, lower, middle, and periphery at the highest and lowest speeds). SWV measurements were taken within the effective measurement areas, and the average SWV (m/s) was subsequently determined for each nodule.
CEUS
During the study period, a Philips EPIQ 5 ultrasound diagnostic apparatus equipped with CEUS software (Philips Medical Systems, Bothell, WA, USA) was used. For CEUS, sections exhibiting robust blood flow, prominent blood vessels, or irregular shapes were selected. Areas featuring substantial calcification accompanied by broad sound shadows were intentionally avoided. The focal point was positioned behind the nodule using a mechanical index of 0.07. The contrast agent SonoVue (25 mg in five mL of 0.9% sodium chloride, Bracco SpA, Milan, Italy) was administered per the standard procedure. The nodule’s dynamic perfusion process was observed for at least 3 min. During CEUS, nine distinct variables were assessed (Luo et al., 2016): (1) enhancement intensity (low enhancement, equal enhancement, high enhancement); (2) order of enhancement (concentric, non-concentric); (3) change (difficult to discern, shrinking, unchanged, expanding); (4) enhancement uniformity (uniform, non-uniform); (5) enhancement defects (present or absent); (6) morphology after enhancement (regular, difficult to discern, irregular); (7) enhanced posterior boundary (clearly distinguishable, difficult to discern, unclear); (8) claw sign (present or absent); and (9) presence of nourishing blood vessels. Discrepancies in evaluations were resolved through discussion between two ultrasound physicians to reach a consensus.
Imaging analysis
All SWE image acquisitions and subsequent data analyses were performed by two radiologists with more than 3 and 10 years of expertise, respectively, in SWE and breast ultrasonography. CEUS images were evaluated by two radiologists with more than 5 and 10 years of proficiency, respectively, in CEUS and routine ultrasound examinations. Each ultrasound image was reviewed and confirmed by two ultrasound specialists not involved in the acquisition of the contrast images. The contrast characteristics of the lesions were categorized following consensus agreement. Prior to image analysis, these two ultrasound specialists were not privy to the patients’ clinical data, ensuring an unbiased evaluation process. This approach ensured consistent assessment of CEUS images by the two radiologists. Disagreements between the radiologists were resolved through joint re-evaluation of the imaging features. This collaborative process ensured that any discrepancies were resolved in a manner that maintained the integrity and reliability of the study findings.
To determine the most accurate classification for breast nodules, an integrated multimodal imaging approach was utilized. Initially, each nodule was given a preliminary classification based on the BI-RADS system. Subsequently, nodule vascularity was assessed using CEUS, and any nodule exhibiting at least two malignant features was classified as malignant. The classification was further refined using SWE, with nodules having SWVs of 3.7 m/s or higher being considered malignant. The final categorization was achieved by combining the results of the initial BI-RADS classification with the findings of CEUS and SWE. In cases of disagreement between CEUS and SWE, the BI-RADS classification was either upgraded, downgraded, or retained (Fig. 1). The resulting integrated methodology provided an enhanced diagnostic platform, amalgamating the insights of BI-RADS, CEUS, and SWE. The SWE classification cutoff 3.7 m/s is derived from our team’s clinical experience and a detailed analysis of patient data from the hospital. This value was established through receiver operating characteristic (ROC) curve analysis, which provided the highest accuracy in distinguishing between benign and malignant nodules.
Statistical analysis
The statistical analysis was performed using SPSS 22.0 (IBM, Armonk, NY, USA) and MedCalc 19.0.7 (MedCalc Software bvba, Ostend, Belgium). Continuous variables were reported as means ± standard deviations or ranges, and comparisons were made using the independent-samples t-test. Categorical data were presented as n (%) and analyzed using the chi-squared test or Fisher’s exact test. The agreement between the two radiologists for CEUS and SWE evaluations was determined using the interclass correlation coefficient (ICC), with values close to 1 indicating excellent reliability. To assess the diagnostic efficacy of classifying small breast nodules, ROC curves were employed for the four diagnostic methods (BI-RADS, CEUS, SWE, and the combined method). Areas under the curve (AUCs) were computed to determine the diagnostic performance of the four methods. For statistical evaluation, the Cochran Q-test and z-test were utilized. The optimal cutoffs were derived from the ROC analysis, with subsequent calculation of sensitivity (SEN), specificity (SPE), positive predictive value (PPV), negative predictive value (NPV), and accuracy (ACC). Statistical significance was defined as a two-sided P-value of less than 0.05.
Results
Clinical data and pathological findings
In this study, of the 676 initially assessed patients, 302 met the inclusion criteria, and 305 nodules were analyzed because three patients had two nodules with the same highest BI-RADS classification. Among these, 113 nodules (37.0%) were malignant, and 192 (63.0%) were benign. The mean age of the patients was 49.2 ± 16.4 years. The benign nodules comprised various pathologies, most commonly fibroadenoma (43.2%), adenopathy (21.4%), and adenopathy with fibroadenoma (20.3%). The malignant nodules were mainly invasive ductal carcinoma (69.0%), followed by ductal carcinoma in situ and papillary carcinoma (9.7% each).
Ultrasound predictors of malignancy
Patient age, the breast nodule size, the breast nodule location, and the echo pattern did not exhibit significant differences between patients with benign and malignant nodules (all P > 0.05). However, notable distinctions were observed in terms of shape (P < 0.001), orientation (P < 0.001), margins (P < 0.001), posterior acoustic features (P = 0.001), calcification (P < 0.001), internal vascularity (P < .001), and lymph node metastasis (P < 0.001) between malignant and benign lesions (Table 1 and Fig. 2).
Table 1. The demographic and ultrasonographic characteristics of enrolled patients with small breast nodules.
| Parameter | Pathological result | Total | t/χ2 | P-value | |
|---|---|---|---|---|---|
| Benign | Malignant | ||||
| No. of nodules | n = 192 | n = 113 | n = 305 | ||
| Age, years | 0.693 | 0.406 | |||
| Mean | 42 ± 14 | 60 ± 12 | |||
| Range | 18–83 | 36–84 | |||
| Tumor size (mm) | 2.452 | 0.118 | |||
| Mean | 13.8 ± 4.3 | 14.5 ± 3.8 | |||
| Range | 4–20 | 5–20 | |||
| Location, n (%) | 0.759 | 0.226 | |||
| Right breast | 88 (45.8) | 46 (40.7) | 134 | ||
| Left breast | 104 (54.2) | 67 (59.3) | 171 | ||
| Shape, n (%) | 57.455 | <0.001 | |||
| Oval | 106 (55.2) | 13 (11.5) | 119 | ||
| Round | 8 (4.2) | 7 (6.2) | 15 | ||
| Irregular | 78 (40.6) | 93 (82.3) | 171 | ||
| Orientation, n (%) | 59.354 | <0.001 | |||
| Parallel | 159 (82.8) | 45 (39.8) | 204 | ||
| Non-parallel | 33 (17.2) | 68 (60.2) | 101 | ||
| Margin, n (%) | 91.450 | <0.001 | |||
| Circumscribed | 141 (73.4) | 19 (16.8) | 160 | ||
| Not circumscribed | 51 (26.6) | 94 (83.2) | 145 | ||
| Echo pattern, n (%) | 3.093 | 0.542 | |||
| Hypoechoic | 169 (88.0) | 101 (89.4) | 270 | ||
| Heterogeneous | 7 (3.6) | 5 (4.4) | 12 | ||
| Complex cystic and solid | 15 (7.8) | 7 (6.2) | 22 | ||
| Hyperechoic | 1 (0.5) | 0 | 1 | ||
| Posterior acoustic features, n (%) | 16.015 | 0.001 | |||
| No. of posterior acoustic features | 172 (89.6) | 94 (83.2) | 266 | ||
| Enhancement | 10 (5.2) | 1 (0.9) | 11 | ||
| Shadowing | 7 (3.6) | 17 (15.0) | 24 | ||
| Combined pattern | 3 (1.6) | 1 (0.9) | 4 | ||
| Calcification, n (%) | 43.308 | <0.001 | |||
| None | 156 (81.3) | 54 (47.8) | 210 | ||
| Calcification inside a mass | 35 (18.2) | 52 (46.0) | 87 | ||
| Calcification outside a mass | 1 (0.5) | 0 | 1 | ||
| Intraductal calcification | 0 | 7 (6.2) | 7 | ||
| Vascularity, n (%) | 35.871 | <0.001 | |||
| Absent | 136 (70.8) | 44 (38.9) | 180 | ||
| Internal vascularity | 43 (22.4) | 62 (54.9) | 105 | ||
| Vessels in rim | 11 (5.7) | 4 (3.5) | 15 | ||
| Internal+vessels in rim | 2 (1.0) | 3 (2.7) | 5 | ||
| Lymph node metastasis, n (%) | 60.745 | <0.001 | |||
| Normal | 192 (100.0) | 78 (69.0) | 271 | ||
| Metastasis | 0 | 35 (31.0) | 35 | ||
Figure 2. (A) An irregular and uncircumscribed nodule classified as BI-RADS 4A. (B) CEUS revealed no significant enhancement, and the volume decreased after enhancement. (C) The average SWV on SWE was 2.8 m/s, which was below the cutoff, indicating that the texture of the nodules was soft. After combining BI-RADS, CEUS, and SWE, the BI-RADS category was downgraded to BI-RADS 3. The final pathological result was breast adenopathy. (D) The nodule was not circumscribed and not parallel, and it was classified as BI-RADS 4A. (E) CEUS displayed high enhancement and an increased volume after enhancement. (F) The average SWV on SWE was 4.1 m/s, which exceeded the cutoff, indicating that the nodule was hard.

After combining BI-RADS, CEUS, and SWE, the BI-RADS category was upgraded to BI-RADS 4B. The final pathological result was ductal carcinoma in situ. BI-RADS, Breast Imaging Reporting, and Data System; SWV, shear-wave velocity; SWE, shear-wave elastography; CEUS, contrast-enhanced ultrasound.
Diagnostic efficacy
The BI-RADS classifications of the breast nodules are outlined in Table 2. The determined cutoff for the BI-RADS classification system was category 4B. Correspondingly, this yielded SEN, SPE, PPV, NPV, ACC, and AUC of 82.3%, 74.5%, 65.5%, 87.7%, 77.4%, and 0.784, respectively.
Table 2. The BI-RADS categories of breast nodules.
| Total | Benign | Malignant | Malignant rate (%) | |
|---|---|---|---|---|
| BI-RADS 3 | 25 | 25 | 0 | 0.0 |
| BI-RADS 4A | 137 | 120 | 17 | 12.4 |
| BI-RADS 4B | 78 | 45 | 33 | 42.3 |
| BI-RADS 4C | 60 | 2 | 58 | 96.7 |
| BI-RADS 5 | 5 | 0 | 5 | 100.0 |
Notes.
BI-RADS, Breast Imaging Reporting and Data System.
Interrater reliability, as assessed using ICC, indicated excellent agreement between the two radiologists for both CEUS (ICC = 0.91, 95% confidence interval (CI) [0.89–0.93]) and SWE (ICC = 0.89, 95% CI [0.86–0.91]). The distinct characteristics indicative of potential malignancy in breast nodules identified by CEUS are presented in Table 3. CEUS demonstrated the capacity to identify malignant nodules when at least two of the nine suspicious malignant signs were concurrently present. In this scenario, the ensuing SEN, SPE, PPV, NPV, ACC, and AUC were 83.2%, 87.5%, 79.7%, 89.8%, 85.9%, and 0.853, respectively.
Table 3. Details of the nine suspected malignant characteristics of breast nodules by CEUS.
| Total | Benign | Malignant | Malignant rate (%) | |
|---|---|---|---|---|
| High enhancement | 188 | 108 | 80 | 42.6 |
| Centripetal enhancement | 99 | 28 | 71 | 71.7 |
| Inhomogeneous enhancement | 166 | 82 | 84 | 50.6 |
| Filling defect | 25 | 2 | 23 | 92 |
| Irregular shape after enhancement | 164 | 70 | 94 | 57.3 |
| Volume expansion | 72 | 8 | 64 | 88.9 |
| Unclear boundary after contrast enhancement | 134 | 38 | 96 | 71.6 |
| Crab foot sign | 29 | 1 | 28 | 96.6 |
| Nourishing vessel sign | 57 | 8 | 49 | 86.0 |
Notes.
CEUS, contrast-enhanced ultrasound.
The diagnostic efficiency of SWE was determined using the mean SWV. Malignant nodules exhibited a mean SWV of 5.2 ± 1.6 m/s, which was significantly higher the value observed for benign nodules (3.1 ± 1.1 m/s, P < 0.001). Employing ROC curve analysis, the optimal cutoff for SWV was 3.7 m/s. Consequently, the resulting SEN, SPE, PPV, NPV, ACC, and AUC were calculated as 86.7%, 82.8%, 74.8%, 91.4%, 84.3%, and 0.848, respectively.
When CEUS or SWE alone was combined with the BI-RADS classification in diagnosing benign nodules, the BI-RADS classification remained unaltered. Nonetheless, the AUC for this combined diagnosis was 0.758, indicating lower performance compared to the individual BI-RADS classification, SWE, and CEUS. Conversely, the combination of CEUS and SWE led to a one-category increase and decrease in the BI-RADS classification for malignant and benign nodules, respectively. This combined diagnostic approach yielded SEN, SPE, PPV, NPV, ACC, and AUC of 88.5%, 87.0%, 80.0%, 92.8%, 87.5%, and 0.877, respectively.
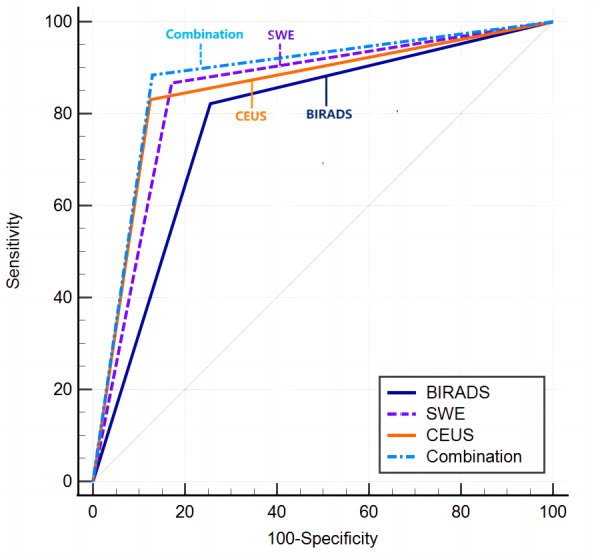
Significant differences were noted among the four diagnostic methods, as indicated by the Cochran Q-test (Cochran’s Q = 19.573, P < 0.01). The AUCs for the diagnostic efficacy of BI-RADS, CEUS, SWE, and the combined method (CEUS + SWE + BI-RADS) were 0.784, 0.853, 0.848, and 0.877, respectively. In the statistical comparison of the combination diagnostic model with BI-RADS, CEUS, and SWE when utilized individually, P-values of <0.001, 0.012, and 0.017, respectively, were obtained. These results suggest that the combination diagnostic approach is significantly more effective than the individual methods (Tables 4–5 and Fig. 3). Implementing this combined diagnostic approach resulted in the reclassification of 55.8% (67/120) of the BI-RADS 4A nodules as BI-RADS 3. These reclassified nodules were subsequently confirmed as benign through pathological assessment, suggesting that unnecessary biopsy procedures could potentially be avoided for such nodules.
Table 4. Comparison of the diagnoses of malignant nodules based on the four examination methods.
| Category | Final diagnosis | Total | χ 2 | P-value | |
|---|---|---|---|---|---|
| Benign | Malignant | ||||
| No. of nodules | n = 192 | n = 113 | n = 305 | ||
| BI-RADS | 92.171 | <0.001 | |||
| Benign | 143 | 20 | 163 | ||
| Malignant | 49 | 93 | 142 | ||
| CEUS | 149.838 | <0.001 | |||
| Benign | 168 | 19 | 187 | ||
| Malignant | 24 | 94 | 118 | ||
| SWE | 143.380 | <0.001 | |||
| Benign | 159 | 15 | 174 | ||
| Malignant | 33 | 98 | 131 | ||
| Combination | 167.533 | <0.001 | |||
| Benign | 167 | 13 | 180 | ||
| Malignant | 25 | 100 | 125 | ||
Notes.
- BI-RADS
- Breast Imaging-Reporting and Data System
- CEUS
- contrast-enhanced ultrasound
- SWE
- shear-wave elastography
Table 5. Diagnostic efficacy of the four examination methods.
| Parameter | SEN (%) | SPE (%) | PPV (%) | NPV (%) | ACC (%) | AUC | 95% CI (%) |
|---|---|---|---|---|---|---|---|
| BI-RADS | 82.3 | 74.5 | 65.5 | 87.7 | 77.4 | 0.784 | 73.3–82.9 |
| CEUS | 83.2 | 87.5 | 79.7 | 89.8 | 85.9 | 0.853 | 80.9–89.1 |
| SWE | 86.7 | 82.8 | 74.8 | 91.4 | 84.3 | 0.848 | 80.2–88.6 |
| Combination | 88.5 | 87.0 | 80.0 | 92.8 | 87.5 | 0.877 | 83.5–91.2 |
Notes.
- SEN
- sensitivity
- SPE
- specificity
- PPV
- positive predictive value
- NPV
- negative predictive value
- ACC
- accuracy
- AUC
- area under the receiver operating characteristic curve
- CI
- confidence interval
- BI-RADS
- Breast Imaging Reporting and Data System
- CEUS
- contrast-enhanced ultrasound
- SWE
- shear-wave elastography
Figure 3. Analysis of the receiver operating characteristic curves of the four methods.
Discussion
This study assessed the potential of CEUS and SWE to distinguish between benign and malignant small breast nodules. The findings indicate that CEUS and SWE could serve as supplementary techniques to enhance the accuracy of the BI-RADS classification for small breast nodules. The combination of CEUS, SWE, and BI-RADS has the potential to enhance the identification of small malignant breast nodules and subsequently reduce the necessity for biopsies.
Through the utilization of CEUS, this study revealed distinct characteristics among fibroadenomas, intraductal papillomas, and malignant breast lesions. Malignant breast lesions often lack capsules, and they feature disorganized capillary networks and increased microcirculation on CEUS, distinguishing them from benign lesions such as fibroadenoma and intraductal papilloma (Chen et al., 2023; Wang et al., 2023). Moreover, the peripheries of malignant breast tumors frequently overlap with regions of breast hyperplasia and various stages of precancerous lesions. Adenosis and inflammatory lesions can exhibit malignancy-like features, such as uneven enhancement and irregular shapes, on CEUS, potentially leading to misdiagnosis (Huang et al., 2019).
Benign tumors, such as breast fibroadenomas, possess stroma with abundant loose mucopolysaccharides, contributing to their reduced hardness compared to malignant tumors such as invasive ductal carcinomas, which are characterized by denser and harder stromal structures because of their fibrous tissue constituents (Aouad et al., 2017). The real-time SWE technique offers a relatively straightforward, noninvasive, and objective approach for assessing tissue hardness. Notably, this study consistently demonstrated the strong diagnostic performance of SWE in terms of SEN and SPE for both BI-RADS 4 nodules and small breast tumors, corroborating prior research findings (Ko et al., 2010; Park et al., 2015). Tissue density data obtained by SWE can predict the extent of vascular infiltration, a key determinant of lymph node metastasis (Celebi et al., 2015; Wojcinski et al., 2012).
It combined CEUS, SWE, and BI-RADS to fine-tune the classification of certain breast nodules. This combined approach resulted in enhanced diagnostic accuracy for both benign and malignant breast nodules. Notably, the study demonstrated that using CEUS and SWE to either downgrade (when both indicators are negative) or upgrade (when both indicators are positive) the BI-RADS classification by one category yielded a superior AUC compared to any of the three methods alone. Significantly, this amalgamated method enabled the reclassification of 55.8% of BI-RADS 4A nodules as BI-RADS 3, all of which were subsequently confirmed to be benign upon pathological examination. This underscores that biopsy could have been avoided for 67 of 120 nodules. Among the falsely identified cases, sclerosing adenoses were the most prevalent, displaying irregular morphologies attributable to interstitial fiber hyperplasia often accompanied by inflammation. These instances corresponded with elevated SWVs exceeding the established threshold coupled with variable regions of pronounced contrast enhancement on CEUS. Conversely, small breast carcinomas that escape detection despite exhibiting malignant features were not as conspicuous on two-dimensional ultrasound, merely displaying significant lobulation, uniform echo patterns, and the absence of posterior feature changes or enhancement. These ultrasound representations bore resemblance to benign tumors, with SWE values below the cutoff and CEUS revealing uniform, low-contrast enhancement. Consequently, a comprehensive analysis of multiple images is imperative for nodules with these attributes, necessitating vigilant monitoring. Furthermore, individuals younger than 60 who have an elevated malignancy risk because of familial history should undergo close surveillance, with additional puncture biopsies performed as deemed necessary (Smith, Cokkinides & Brawley, 2012).
The BI-RADS classification system is not exempt from shortcomings, which are particularly evident in cases involving BI-RADS 4 nodules (in which the probability of malignancy ranges from >2% to <95%) (Jørgensen & Gøtzsche, 2009). In the context of this study, of the 120 nodules initially classified as BI-RADS 4A, 67 were subsequently reclassified as BI-RADS category 3 following the integration of CEUS and SWE results. The diagnostic approach proposed in this study holds the potential to avoid unnecessary biopsies, thereby reducing the associated morbidity linked to breast nodule screening.
Combining ultrasonography modalities for assessing BI-RADS 4 breast lesions continues to be of interest, with studies advocating for various combinations to achieve optimal accuracy. As evident from the recent literature, the amalgamation of ultrasound with two-dimensional SWE and CEUS has displayed considerable promise, especially in studies by Chen et al. (2022) and Liu et al. (2019), which reported AUCs of 0.974 and 0.973 respectively (Table 6). Such high AUCs indicate a substantial diagnostic accuracy. The amalgamated study using a unique combination of BI-RADS, CEUS, and SWE revealed a similar trend, although the AUC was slightly lower at 0.877. Nonetheless, combined modalities enhance the diagnostic precision in assessing BI-RADS 4 lesions. This underscores the potential of these combined techniques as pivotal tools in breast lesion assessment, thus informing clinical decision-making and potentially leading to better patient outcomes.
Table 6. Comparative analysis of combined ultrasonography modalities in assessing breast lesions.
| Study | Year of publication | No. of lesions | Benign (%) | Malignant (%) | Best combined modality | AUC |
|---|---|---|---|---|---|---|
| Chen et al. (2022) | 2022 | 104 | 82 (78.8%) | 22 (21.2%) | US+2D-SWE+CEUS | 0.974 |
| Liu et al. (2019) | 2019 | 118 | 74 (62.7%) | 44 (37.3%) | US+SWE+CEUS | 0.973 |
| He et al. (2023) | 2023 | 26 | 19 (73.1%) | 7 (26.9%) | Combination of CEUS and SWE | 0.86 |
| Our study | 2023 | 305 | 192 (63%) | 113 (37%) | BI-RADS combined with CEUS and SWE | 0.877 |
Notes.
- US
- ultrasonography
- 2D-SWE
- 2D shear wave elastography
- CEUS
- contrast enhanced ultrasonography
- BI-RADS
- Breast Imaging-Reporting and Data System
- AUC
- areas under the curves
Several limitations of this study must be acknowledged. First, its retrospective design inherently carries the risk of selection bias, as the study used pre-existing records that might not have captured all relevant variables uniformly (Hall, Kea & Wang, 2019). Second, the study was potentially subject to inherent biases related to the interpretation of imaging results despite efforts to ensure blinded assessments. Additionally, the study was conducted at a single institution, which could limit the generalizability of the findings to other settings with different patient demographics or varying levels of access to imaging technologies. Finally, although the combination of CEUS and SWE led to improved diagnostic accuracy, the cost and availability of these technologies might pose barriers to their widespread adoption, particularly in low-resource settings (Dan et al., 2023). Future prospective studies with larger, more diverse populations and multicenter collaborations are necessary to validate these findings and explore the cost-effectiveness and practical implementation of integrating CEUS and SWE into routine clinical practice.
The findings of this study have significant implications for clinical guidelines and practices, particularly in resource-limited settings in which access to advanced imaging technologies such as CEUS and SWE could be restricted (Dan et al., 2023). The enhanced diagnostic accuracy achieved by combining CEUS and SWE with the BI-RADS classification system suggests a potential paradigm shift in the management of small breast nodules. However, it is crucial to consider the feasibility and accessibility of these technologies in diverse clinical settings. In regions where these advanced imaging modalities are not readily available, alternative strategies must be developed to ensure that patients receive accurate and timely breast cancer diagnoses (Bonsu & Ncama, 2018; Broach et al., 2016). Future studies should focus on adapting these findings to simpler, more widely available diagnostic tools to ensure broad applicability and minimize disparities in breast cancer care.
CONCLUSIONS
The integrated diagnosis using multiple ultrasound techniques (BI-RADS with conventional ultrasound, CEUS, and SWE) displayed an enhanced capability to differentiate benign and malignant breast nodules. CEUS and SWE might effectively serve as supplementary tools to enhance the clarity of the BI-RADS classification for smaller benign nodules, thereby refining the management of BI-RADS categorization for this subset of cases.
Supplemental Information
Abbreviations
- ACC
accuracy
- AUC
area under the ROC curve
- BI-RADS
Breast Imaging Reporting and Data System
- CEUS
Contrast-enhanced ultrasound
- NPV
negative predictive value
- PPV
positive predictive value
- ROC
receiver operating characteristics
- SEN
sensitivity
- SPE
specificity
- SWE
Shear-wave elastography
- SWV
shear-wave velocity
Funding Statement
This study was funded by the Surface Project of Shanghai Health and Family Planning Commission (#202001640) and the Shanghai Pudong New Area Health System key Specialty Construction (#PWZzk2022-18). The funders had no role in study design, data collection and analysis, decision to publish, or preparation of the manuscript.
Contributor Information
Jiangnan Dong, Email: dongjiangnan0303@126.com.
Xiaohong Fu, Email: fuxiaohong66@126.com.
Additional Information and Declarations
Competing Interests
The authors declare there are no competing interests.
Author Contributions
Yan Shen conceived and designed the experiments, performed the experiments, analyzed the data, prepared figures and/or tables, authored or reviewed drafts of the article, and approved the final draft.
Jie He performed the experiments, analyzed the data, prepared figures and/or tables, authored or reviewed drafts of the article, and approved the final draft.
Miao Liu performed the experiments, authored or reviewed drafts of the article, and approved the final draft.
Jiaojiao Hu performed the experiments, authored or reviewed drafts of the article, and approved the final draft.
Yonglin Wan performed the experiments, authored or reviewed drafts of the article, and approved the final draft.
Tingting Zhang performed the experiments, authored or reviewed drafts of the article, and approved the final draft.
Jun Ding performed the experiments, authored or reviewed drafts of the article, and approved the final draft.
Jiangnan Dong performed the experiments, authored or reviewed drafts of the article, and approved the final draft.
Xiaohong Fu conceived and designed the experiments, performed the experiments, authored or reviewed drafts of the article, and approved the final draft.
Human Ethics
The following information was supplied relating to ethical approvals (i.e., approving body and any reference numbers):
The Ethics committee of Gongli Hospital approved the study (#[2020] Provisional Trial No. (003)).
Data Availability
The following information was supplied regarding data availability:
Raw data are available in the Supplemental Files.
References
- Aouad et al. (2017).Aouad P, Saikali M, Abdel-Samad R, Fostok S, El-Houjeiri L, Pisano C, Talhouk R, Darwiche N. Antitumor activities of the synthetic retinoid ST1926 in two-dimensional and three-dimensional human breast cancer models. Anti-Cancer Drugs. 2017;28:757–770. doi: 10.1097/CAD.0000000000000511. [DOI] [PubMed] [Google Scholar]
- Bae & Kim (2016).Bae JM, Kim EH. Breast density and risk of breast cancer in Asian women: a meta-analysis of observational studies. Journal of Preventive Medicine and Public Health. 2016;49:367–375. doi: 10.3961/jpmph.16.054. [DOI] [PMC free article] [PubMed] [Google Scholar]
- Bonsu & Ncama (2018).Bonsu AB, Ncama BP. Evidence of promoting prevention and the early detection of breast cancer among women, a hospital-based education and screening interventions in low- and middle-income countries: a systematic review protocol. Systematic Reviews. 2018;7:234. doi: 10.1186/s13643-018-0889-0. [DOI] [PMC free article] [PubMed] [Google Scholar]
- Broach et al. (2016).Broach RB, Geha R, Englander BS, De LaCruz L, Thrash H, Brooks AD. A cost-effective handheld breast scanner for use in low-resource environments: a validation study. World Journal of Surgical Oncology. 2016;14:277. doi: 10.1186/s12957-016-1022-2. [DOI] [PMC free article] [PubMed] [Google Scholar]
- Castro et al. (2017).Castro SM, Tseytlin E, Medvedeva O, Mitchell K, Visweswaran S, Bekhuis T, Jacobson RS. Automated annotation and classification of BI-RADS assessment from radiology reports. Journal of Biomedical Informatics. 2017;69:177–187. doi: 10.1016/j.jbi.2017.04.011. [DOI] [PMC free article] [PubMed] [Google Scholar]
- Celebi et al. (2015).Celebi F, Pilanci KN, Ordu C, Agacayak F, Alco G, Ilgun S, Sarsenov D, Erdogan Z, Ozmen V. The role of ultrasonographic findings to predict molecular subtype, histologic grade, and hormone receptor status of breast cancer. Diagnostic and Interventional Radiology. 2015;21:448–453. doi: 10.5152/dir.2015.14515. [DOI] [PMC free article] [PubMed] [Google Scholar]
- Chen et al. (2022).Chen Y, Lu J, Li J, Liao J, Huang X, Zhang B. Evaluation of diagnostic efficacy of multimode ultrasound in BI-RADS 4 breast neoplasms and establishment of a predictive model. Frontiers in Oncology. 2022;12:1053280. doi: 10.3389/fonc.2022.1053280. [DOI] [PMC free article] [PubMed] [Google Scholar]
- Chen et al. (2023).Chen X, Yu H, Wei N, Ozcan BB, An G, Wu Q, Wang N. Diagnostic performance of contrast-enhanced ultrasound combined with shear wave elastography in differentiating benign from malignant breast lesions: a systematic review and meta-analysis. Gland Surgery. 2023;12:1610–1623. doi: 10.21037/gs-23-333. [DOI] [PMC free article] [PubMed] [Google Scholar]
- Dan et al. (2023).Dan Q, Zheng T, Liu L, Sun D, Chen Y. Ultrasound for breast cancer screening in resource-limited settings: current practice and future directions. Cancer. 2023;15(7):2112. doi: 10.3390/cancers15072112. [DOI] [PMC free article] [PubMed] [Google Scholar]
- DeSantis et al. (2017).DeSantis CE, Ma J, Goding Sauer A, Newman LA, Jemal A. Breast cancer statistics, 2017, racial disparity in mortality by state. CA: A Cancer Journal for Clinicians. 2017;67:439–448. doi: 10.3322/caac.21412. [DOI] [PubMed] [Google Scholar]
- Geisel, Raghu & Hooley (2018).Geisel J, Raghu M, Hooley R. The role of ultrasound in breast cancer screening: the case for and against ultrasound. Semin Ultrasound CT MR. 2018;39:25–34. doi: 10.1053/j.sult.2017.09.006. [DOI] [PubMed] [Google Scholar]
- Hall, Kea & Wang (2019).Hall MK, Kea B, Wang R. Recognising bias in studies of diagnostic tests part 1: patient selection. Emergency Medicine Journal. 2019;36:431–434. doi: 10.1136/emermed-2019-208446. [DOI] [PMC free article] [PubMed] [Google Scholar]
- He et al. (2023).He H, Wu X, Jiang MJ, Xu Z, Zhang X, Pan J, Fu X, Luo Y, Chen J. Diagnostic accuracy of contrast-enhanced ultrasound synchronized with shear wave elastography in the differential diagnosis of benign and malignant breast lesions: a diagnostic test. Gland Surgery. 2023;12(1):54–66. doi: 10.21037/gs-22-684. [DOI] [PMC free article] [PubMed] [Google Scholar]
- Huang et al. (2019).Huang R, Jiang L, Xu Y, Gong Y, Ran H, Wang Z, Sun Y. Comparative diagnostic accuracy of contrast-enhanced ultrasound and shear wave elastography in differentiating benign and malignant lesions: a network meta-analysis. Frontiers in Oncology. 2019;9:102. doi: 10.3389/fonc.2019.00102. [DOI] [PMC free article] [PubMed] [Google Scholar]
- Ji et al. (2017).Ji CL, Li XL, He YP, Li DD, Gu XG, Xu HX. Quantitative parameters of contrast-enhanced ultrasound in breast invasive ductal carcinoma: the correlation with pathological prognostic factors. Clinical Hemorheology and Microcirculation. 2017;66:333–345. doi: 10.3233/CH-170251. [DOI] [PubMed] [Google Scholar]
- Jørgensen & Gøtzsche (2009).Jørgensen KJ, Gøtzsche PC. Overdiagnosis in publicly organised mammography screening programmes: systematic review of incidence trends. BMJ. 2009;339:b2587. doi: 10.1136/bmj.b2587. [DOI] [PMC free article] [PubMed] [Google Scholar]
- Ko et al. (2010).Ko ES, Lee BH, Kim HA, Noh WC, Kim MS, Lee SA. Triple-negative breast cancer: correlation between imaging and pathological findings. European Radiology. 2010;20:1111–1117. doi: 10.1007/s00330-009-1656-3. [DOI] [PubMed] [Google Scholar]
- Lai & Law (2015).Lai CW, Law HK. Mammographic breast density in chinese women: spatial distribution and autocorrelation patterns. PLOS ONE. 2015;10:e0136881. doi: 10.1371/journal.pone.0136881. [DOI] [PMC free article] [PubMed] [Google Scholar]
- Lee et al. (2010).Lee CH, Dershaw DD, Kopans D, Evans P, Monsees B, Monticciolo D, Brenner RJ, Bassett L, Berg W, Feig S, Hendrick E, Mendelson E, D’Orsi C, Sickles E, Burhenne LW. Breast cancer screening with imaging: recommendations from the Society of Breast Imaging and the ACR on the use of mammography, breast MRI, breast ultrasound, and other technologies for the detection of clinically occult breast cancer. Journal of the American College of Radiology. 2010;7:18–27. doi: 10.1016/j.jacr.2009.09.022. [DOI] [PubMed] [Google Scholar]
- Liu et al. (2019).Liu G, Zhang MK, He Y, Liu Y, Li XR, Wang ZL. BI-RADS 4 breast lesions: could multi-mode ultrasound be helpful for their diagnosis? Gland Surgery. 2019;8:258–270. doi: 10.21037/gs.2019.05.01. [DOI] [PMC free article] [PubMed] [Google Scholar]
- Luo et al. (2016).Luo J, Chen J, Chen Q, Yue L, Guo Z, Cheng L, Yi L, Wu C, Su X, Lu J. Application value of predictive models of contrast-enhanced ultrasound in the evaluation of breast imaging reporting and data system 4 breast lesions. Chinese Journal of Medical Ultrasound. 2016;13:7. doi: 10.3877/cma.j.issn.1672-6448.2016.06.012. [DOI] [Google Scholar]
- Mercado (2014).Mercado CL. BI-RADS update. Radiologic Clinics of North America. 2014;52:481–487. doi: 10.1016/j.rcl.2014.02.008. [DOI] [PubMed] [Google Scholar]
- Nam et al. (2016).Nam SY, Ko EY, Han BK, Shin JH, Ko ES, Hahn SY. Breast imaging reporting and data system category 3 lesions detected on whole-breast screening ultrasound. Journal of Breast Cancer. 2016;19:301–307. doi: 10.4048/jbc.2016.19.3.301. [DOI] [PMC free article] [PubMed] [Google Scholar]
- Nothacker et al. (2009).Nothacker M, Duda V, Hahn M, Warm M, Degenhardt F, Madjar H, Weinbrenner S, Albert US. Early detection of breast cancer: benefits and risks of supplemental breast ultrasound in asymptomatic women with mammographically dense breast tissue. A systematic review. BMC Cancer. 2009;9:335. doi: 10.1186/1471-2407-9-335. [DOI] [PMC free article] [PubMed] [Google Scholar]
- Park et al. (2015).Park J, Woo OH, Shin HS, Cho KR, Seo BK, Kang EY. Diagnostic performance and color overlay pattern in shear wave elastography (SWE) for palpable breast mass. European Journal of Radiology. 2015;84:1943–1948. doi: 10.1016/j.ejrad.2015.06.020. [DOI] [PubMed] [Google Scholar]
- Pistolese et al. (2019).Pistolese CA, Tosti D, Citraro D, Ricci F, Di Stefano C, Lamacchia F, Ferrari D, Floris R. Probably benign breast nodular lesions (BI-RADS 3): correlation between ultrasound features and histologic findings. Ultrasound in Medicine and Biology. 2019;45:78–84. doi: 10.1016/j.ultrasmedbio.2018.09.004. [DOI] [PubMed] [Google Scholar]
- Siegel et al. (2022).Siegel RL, Miller KD, Fuchs HE, Jemal A. Cancer statistics 2022. CA: A Cancer Journal for Clinicians. 2022;72:7–33. doi: 10.3322/caac.21708. [DOI] [PubMed] [Google Scholar]
- Smith, Cokkinides & Brawley (2012).Smith RA, Cokkinides V, Brawley OW. Cancer screening in the United States, 2012: a review of current American Cancer Society guidelines and current issues in cancer screening. CA: A Cancer Journal for Clinicians. 2012;62:129–142. doi: 10.3322/caac.20143. [DOI] [PubMed] [Google Scholar]
- Sung et al. (2021).Sung H, Ferlay J, Siegel RL, Laversanne M, Soerjomataram I, Jemal A, Bray F. Global cancer statistics 2020: GLOBOCAN estimates of incidence and mortality worldwide for 36 cancers in 185 countries. CA: A Cancer Journal for Clinicians. 2021;71:209–249. doi: 10.3322/caac.21660. [DOI] [PubMed] [Google Scholar]
- von Elm et al. (2007).von Elm E, Altman DG, Egger M, Pocock SJ, Gotzsche PC, Vandenbroucke JP, Initiative S. The strengthening the reporting of observational studies in epidemiology (STROBE) statement: guidelines for reporting observational studies. Annals of Internal Medicine. 2007;147:573–577. doi: 10.7326/0003-4819-147-8-200710160-00010. [DOI] [PubMed] [Google Scholar]
- Wang et al. (2023).Wang B, Yang D, Zhang X, Gong X, Xu T, Han J, Ren Y, Zou S, Li L, Wang Y. The diagnostic value of contrast-enhanced ultrasonography in breast ductal abnormalities. Cancer Imaging. 2023;23:25. doi: 10.1186/s40644-023-00539-w. [DOI] [PMC free article] [PubMed] [Google Scholar]
- Welch et al. (2016).Welch HG, Prorok PC, O’Malley AJ, Kramer BS. Breast-cancer tumor size, overdiagnosis, and mammography screening effectiveness. New England Journal of Medicine. 2016;375:1438–1447. doi: 10.1056/NEJMoa1600249. [DOI] [PubMed] [Google Scholar]
- Wojcinski et al. (2012).Wojcinski S, Soliman AA, Schmidt J, Makowski L, Degenhardt F, Hillemanns P. Sonographic features of triple-negative and non-triple-negative breast cancer. Journal of Ultrasound in Medicine. 2012;31:1531–1541. doi: 10.7863/jum.2012.31.10.1531. [DOI] [PubMed] [Google Scholar]
- Xiang et al. (2017).Xiang LH, Yao MH, Xu G, Pu H, Liu H, Fang Y, Wu R. Diagnostic value of contrast-enhanced ultrasound and shear-wave elastography for breast lesions of sub-centimeter. Clinical Hemorheology and Microcirculation. 2017;67:69–80. doi: 10.3233/CH-170250. [DOI] [PubMed] [Google Scholar]
- Yeo et al. (2018).Yeo SH, Kim GR, Lee SH, Moon WK. Comparison of ultrasound elastography and color doppler ultrasonography for distinguishing small triple-negative breast cancer from fibroadenoma. Journal of Ultrasound in Medicine. 2018;37:2135–2146. doi: 10.1002/jum.14564. [DOI] [PubMed] [Google Scholar]
- Youk, Gweon & Son (2017).Youk JH, Gweon HM, Son EJ. Shear-wave elastography in breast ultrasonography: the state of the art. Ultrasonography. 2017;36:300–309. doi: 10.14366/usg.17024. [DOI] [PMC free article] [PubMed] [Google Scholar]
- Zhu et al. (2018).Zhu YC, Zhang Y, Deng SH, Jiang Q. Diagnostic performance of superb microvascular imaging (SMI) combined with shear-wave elastography in evaluating breast lesions. Medical Science Monitor. 2018;24:5935–5942. doi: 10.12659/MSM.910399. [DOI] [PMC free article] [PubMed] [Google Scholar]
Associated Data
This section collects any data citations, data availability statements, or supplementary materials included in this article.
Supplementary Materials
Data Availability Statement
The following information was supplied regarding data availability:
Raw data are available in the Supplemental Files.