Abstract
Background:
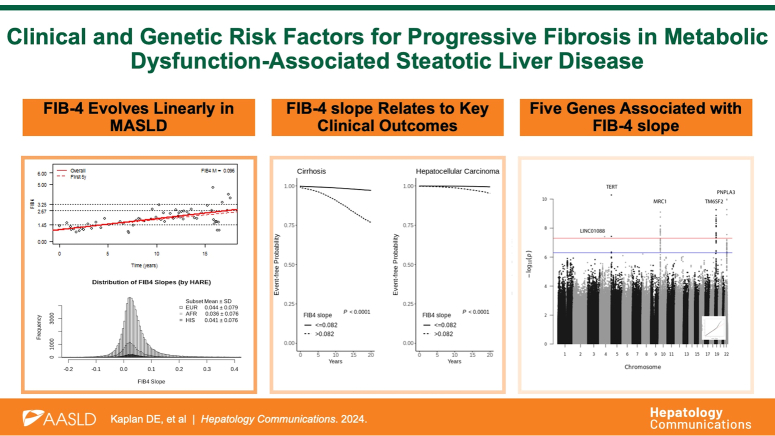
Fibrosis-4 (FIB4) is a recommended noninvasive test to assess hepatic fibrosis among patients with metabolic dysfunction–associated steatotic liver disease (MASLD). Here, we used FIB4 trajectory over time (ie, “slope” of FIB4) as a surrogate marker of liver fibrosis progression and examined if FIB4 slope is associated with clinical and genetic factors among individuals with clinically defined MASLD within the Million Veteran Program Cohort.
Methods:
In this retrospective cohort study, FIB4 slopes were estimated through linear regression for participants with clinically defined MASLD and FIB4 <2.67 at baseline. FIB4 slope was correlated with demographic parameters and clinical outcomes using logistic regression and Cox proportional hazard models. FIB4 slope as a quantitative phenotype was used in a genome-wide association analysis in ancestry-specific analysis and multiancestry meta-analysis using METAL.
Results:
FIB4 slopes, generated from 98,361 subjects with MASLD (16,045 African, 74,320 European, and 7996 Hispanic), showed significant associations with sex, ancestry, and cardiometabolic risk factors (p < 0.05). FIB4 slopes also correlated strongly with hepatic outcomes and were independently associated with time to cirrhosis. Five genetic loci showed genome-wide significant associations (p < 5 × 10⁻⁸) with FIB4 slope among European ancestry subjects, including 2 known (PNPLA3 and TM6SF2) and 3 novel loci (TERT 5.1 × 10⁻¹¹; LINC01088, 3.9 × 10⁻⁸; and MRC1, 2.9 × 10⁻⁹).
Conclusions:
Linear trajectories of FIB4 correlated significantly with time to progression to cirrhosis, with liver-related outcomes among individuals with MASLD and with known and novel genetic loci. FIB4 slope may be useful as a surrogate measure of fibrosis progression.
INTRODUCTION
Metabolic dysfunction–associated steatotic liver disease (MASLD), formerly NAFLD, is the most common liver disorder, affecting ~25% of the world’s population.1 MASLD is frequently identified in primary care practice from abnormal liver aminotransferase levels (AST and/or ALT) on routine blood tests or incidentally found hepatic steatosis on abdominal imaging. On histologic examination, ~80%–85% of patients with MASLD have simple hepatic steatosis without ballooning inflammation or fibrosis. These patients have a low risk of liver-related complications such as cirrhosis and HCC and die from cardiovascular disease, nonhepatic cancers, or other complications of diabetes mellitus, hypertension, and obesity at rates similar to the general population.2 By contrast, 15%–20% of individuals with metabolic dysfunction–associated steatohepatitis (MASH), formerly NASH, are at increased risk of developing progressive fibrosis, cirrhosis, hepatic decompensation, and HCC,2,3,4 although they also remain at high risk of cardiovascular morbidity. On average, patients with MASLD/MASH progress histologically by 1 Metavir fibrosis stage every 7–10 years, with about 20% of patients experiencing more rapid progression (Stage F0 to F3-4 over 5.9 ± 3.7 y of follow-up).5 Clinical factors associated with accelerated progression to advanced fibrosis in MASH include increased age, type 2 diabetes, and smoking.3,6 Because fibrosis progression precedes hepatic complications, early identification of patients most likely to progress would impact the need for and intensity of patient monitoring and potential intervention to prevent and/or minimize liver-related complications.
The gold standard for assessing liver fibrosis progression is liver biopsy; however, serial assessment by biopsy is neither practical nor acceptable. MRI-based and ultrasound-based elastography techniques are less invasive for the serial assessment of fibrosis in MASLD but are not universally available and entail significant costs; therefore, they are impractical for large-scale serial assessment. Fibrosis-4 (FIB4) calculation, which uses patient age, platelet counts, AST, and ALT in a simple formula ([age × AST]/[platelet × sqrt (ALT)]), is a low-cost, widely available method to estimate liver fibrosis. FIB4 scores below 1.30 indicate low risk for advanced fibrosis; scores between 1.30 and 2.67 indicate intermediate risk; and scores above 2.67 indicate high risk for advanced fibrosis.7 Within relatively small populations, research has demonstrated a correlation between baseline FIB4 values and future development of hepatic decompensation or HCC with a C-statistic >0.7–0.8,7,8,9,10 although FIB4 values are numerically less concordant with hepatic decompensation than vibration-controlled transient elastography.8 Two recent studies, including one in a US Veteran Affairs cohort, suggest that evaluating 2 FIB4 values over a several-year period improves the discrimination of individuals at higher risk of liver-related events when used to model annual change or to evaluate change from low risk to intermediate risk or high risk.11,12
Recently, we confirmed the association between genetic variants in APOE, PNPLA3, TM6SF2, MTARC1, and TRIB1 and the presence of MASLD-surrogate phenotypes in the Million Veteran Program (MVP),13 confirming results of smaller biopsy-based or imaging-based genome-wide association studies (GWASs).14,15,16 Several single nucleotide polymorphisms (SNPs) have been associated with progressive fibrosis and complications in MASLD, including PNPLA3 rs738409, TM6SF2 rs58542926, and MBOAT7 rs641738.6,15,16,17,18,19,20,21,22,23,24,25,26,27,28,29,30,31 However, most MASLD-related GWAS analyses are cross-sectional in nature and do not elucidate the relationship between genetic associations and the progression rate of fibrosis.
We aim to (1) evaluate the association of the rate of FIB4 change over time (FIB4 slope) with liver-related events in MASLD/MASH and (2) identify SNPs related to FIB4 slope in a well-characterized administrative cohort with MASLD/MASH.
METHODS
This study conforms to the STREGA reporting guidelines.
Million Veteran Program
The MVP biobank was launched in 2011 by the Veterans Health Administration (VHA) Office of Research and Development to develop a genetic repository of US Veterans linked with clinical information as described.13,32 The MVP received ethical and study protocol approval from the VA Central Institutional Review Board in accordance with the principles outlined in the Declaration of Helsinki.13,32 At the time of our analyses, ~650,000 MVP participants had genotype data available from a customized Affymetrix Axiom Biobank array (the MVP 1.0 Genotyping Array).13,32
MASLD analytic cohort definition
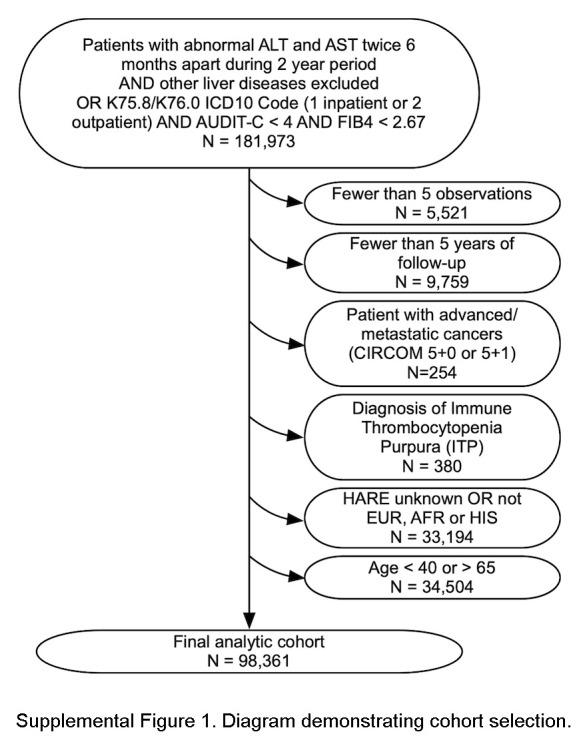
We identified MVP participants with MASLD using clinical parameters in the VA Corporate Data Warehouse (CDW) based on unexplained chronic elevation of serum ALT as described and confirmed in the MVP population with 89% positive predictive value for MASLD/MASH.13,33 We identified participants with at least 2 abnormal ALT measurements (>40 IU/mL in men and >30 IU/mL in women) at least 6 months apart over a 2-year period, excluding those with known alcohol use disorders determined by ICD9/10 diagnosis or alcohol use disorders identification test (AUDIT-C) ≥4, chronic viral hepatitis, genetic liver diseases, cholestatic liver diseases, or autoimmune hepatitis.34,35 We supplemented this population with participants with 1 inpatient or 2 outpatient ICD10 diagnoses of MASLD or MASH (K76.0 and K75.81) independent of abnormal ALT.
We further restricted the cohort to participants aged 40–65 years at the first available FIB4 measurement. Hence, the cohort was young enough to benefit from early intervention, with at least 5 FIB4 observations over at least 5 years of clinical follow-up to ensure sufficient FIB4 measurements to generate linear models. With baseline absence of advanced fibrosis (FIB4 <2.67), the cohort was at risk for but not exhibiting advanced fibrosis. We also excluded those with advanced/metastatic cancers (cirrhosis comorbidity score 5 + 0 or 5 + 1) (n = 254) or diagnosis of immune thrombocytopenic purpura (n = 380), which could alter the FIB4 score. We included participants with the 3 largest ancestries defined as European, African, or Hispanic by HARE (harmonized ancestry and race/ethnicity) categories36 as described (Supplemental Figure S1, http://links.lww.com/HC9/A962).
Generation of FIB4 slopes
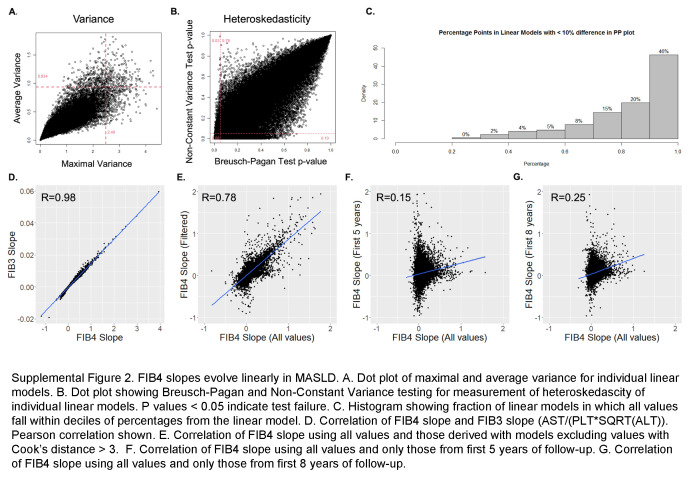
For each suitable participant, we collected every outpatient AST, ALT, and platelet count (in K/mm3) obtained in VA laboratories from January 2002 to November 2021. To eliminate dependency on platelet and ALT/AST values from identical days, median values in every 30-day window before and following patient enrollment in MVP were obtained, and FIB4 was calculated in time windows during which all 3 variables were present without imputation. From the first date that each patient met the case definition (t = 0) until the final date of follow-up, we generated individual linear models (dependent variable = FIB4 and independent variable = time) to obtain the regression slope and average annual rate of change of FIB4 (FIB4 slope). Linear models were evaluated for linearity by z-transformations, for heteroscedasticity by Breusch-Pagan and Non-Constant Variance testing, and for fit with Hosmer-Lemeshow goodness-of-fit tests. Slopes were also calculated, filtering for values >3 Cook’s distances from the linear estimation, using values only from the first 5 and first 8 years of data.
Covariates
Covariates obtained from the CDW upon first FIB4 determination included demographics (age and sex), BMI, race/ethnicity (HARE), cirrhosis comorbidity indices, component laboratory tests for Model for End-Stage Liver Disease-Sodium (MELD-Na) score (creatinine, bilirubin, international normalized ratio, and sodium), lipid profile, and serum alpha-fetoprotein. Missing laboratory data were imputed using R MICE with a random forest algorithm. Electronic Child-Turcotte-Pugh was determined using a validated algorithm.37 Exposures to the following classes of medications for ≥30 days were characterized as baseline exposure: lipid-lowering agents (statins and fibrates), diabetes medications (metformin, insulin, sulfonylureas, thiazolidenediones, dipeptidyl peptidase IV antagonists, glucagon-like peptide 1 receptor agonists, and sodium-glucose cotrasporter-2 inhibitors), oral anticoagulants (coumadin and direct oral anticoagulants), and antihypertensive medications (diuretics, angiotensin-converting enzyme inhibitors, angiotensin-2 receptor blockers, selective beta-blockers, nonselective beta-blockers, and calcium channel blockers).
Outcomes
Death was identified using the VA Vital Status File. The development of cirrhosis, HCC, ascites, acute myocardial infarction, ischemic stroke, coronary artery disease, and hepatic decompensation (including ascites, HE, spontaneous bacterial peritonitis, or hepatorenal syndrome) were identified by the presence of at least 1 inpatient or 2 outpatient ICD9/10 codes shown in Supplemental Table S1, http://links.lww.com/HC9/A964.
Association of FIB4 slope with clinical variables and outcomes
We constructed simple linear models to identify clinical covariates associated with FIB4 slope. Covariates with p value <0.1 were entered into multivariable models that were optimized using stepwise regression (stepAIC) in R.38 Optimal cut points for FIB4 slope discrimination were calculated using the Youden method. To confirm the association of FIB4 slope with clinical outcomes, we generated generalized linear models and Cox proportional hazard models to assess the association of FIB4 slope with the outcomes of death, HCC, hepatic decompensation, ascites, acute myocardial infarction, cerebrovascular accident, and coronary artery disease using a randomly selected 80% derivation subset. The performance of models was tested in a 20% validation subset. We also constructed Cox proportional hazard models evaluating time to clinical events with the competing risk of death to measure the subhazard ratio and contribution to overall model χ2 of individual covariates.
Genome-wide association analysis
We tested imputed SNPs that passed quality control (ie, HWE p > 1 × 10⁻¹⁰, imputation INFO Score >0.3) for association with FIB4 slope through linear regression, assuming an additive model of variants with MAF >1% in each HARE category using REGENIE software.39 Covariates included age at time t = 0, sex, AUDIT-C score at time t = 0, BMI quintiles, the number of FIB4 measurements in the medical record, and first 10 principal components, which estimates genetic distances among participants. We aggregated summary statistics from the ancestry-specific analyses and performed a multiancestry meta-analysis assuming a fixed-effects model with inverse-variance weighting of the effect estimates implemented in METAL.40 SNPs were considered statistically significant if they passed the genome-wide p value threshold of 5 × 10⁻⁸.
Secondary signal analysis
Independent signals at regions with multiple significant SNPs were evaluated per HARE ancestry group (with the meta-analysis using EA data) by individual-level mediation analysis by introducing the lead SNP in the genetic region (defined as a 500-kb flanking region of significant markers) as an additional covariate and reanalyzing the region. SNPs with p < 1 × 10⁻⁸ were considered independent signals.
Putative causal drivers
All imputed variants in MVP were annotated with ANNOVAR41 and RegulomeDB.34 We extracted all predicted loss-of-function and missense variants, as well as the RegulomeDB score for noncoding variants. RegulomeDB scores range from 1 (high probability of a regulatory effect) to 7 (no evidence of regulatory effect). We calculated the linkage disequilibrium (LD) with established variants through PLINK 2.039 for multiancestry, European, African, and Hispanic lead SNPs based on internal estimates using the MVP data set for the respective underlying population. For the multiancestry coding variants, we used the European panel for LD calculation. Coding variants or high-scoring noncoding variants that were in strong LD (r2 > 0.7) with lead SNPs and had a strong statistical association (p value <5 × 10⁻⁸) were considered the putative causal drivers of the observed association at the respective locus.
Phenome-wide association study of lead SNPs
We investigated significant SNPs from the meta-analysis in several external resources providing phenome-wide associations, including UKBiobank,35 HugeAMP (https://hugeamp.org), and FinnGen (data freeze 9).42
RESULTS
Identification and description of the MASLD cohorts in MVP
Within MVP, 181,973 participants met our surrogate MASLD phenotype definition.13,33 After applying exclusion criteria, the analytic cohort included 98,361 participants (Supplemental Figure S1, http://links.lww.com/HC9/A962). Consistent with the VA population, 90.2% were men, and 75.5% were of European ancestry by HARE (Table 1). Selected participants had a median of 19 FIB4 measurements over a median of 11.3 (IQR: 6.7–15.9) years of follow-up. The median age at cohort entry was 58 years (IQR: 52–63). Seventy-three percent had diabetes, the median BMI was 33.3, and 47.4% were on statin therapy. Reflecting our selection criteria, baseline FIB4 values were below 1.30 in most participants (72.9%), whereas 27.1% had “intermediate” baseline FIB4 values (1.30–2.67).
TABLE 1.
Patient characteristics
| Overall | European (EUR) | African (AFR) | Hispanic (HIS) | |
|---|---|---|---|---|
| N | 98,361 | 74,320 | 16,045 | 7996 |
| Duration of follow-up (median [IQR]) | 11.3 [6.7–15.9] | 11.4 [6.8–15.9] | 10.8 [6.2–16.0] | 11.3 [6.7–16.0] |
| Observations (median [IQR]) | 19 [12–29] | 19 [12–29] | 20 [13–30] | 18 [12–28] |
| Age at entry (median [IQR]) | 58.0 [52.0–63.0] | 58.0 [53.0–64.0] | 55.0 [49.0–60.0] | 55.0 [50.0–61.0] |
| FIB4 baseline <1.30, N (%) | 71,750 (72.9) | 53,675 (72.2) | 12,279 (76.5) | 5796 (72.5) |
| Gender = male, N (%) | 88,765 (90.2) | 67,559 (90.9) | 13,806 (86.0) | 7400 (92.5) |
| Body mass index (median [IQR]) | 33.3 [30.0–37.5] | 33.4 [30.0–37.7] | 33.1 [29.8–37.1] | 33.1 [29.9–36.8] |
| BMI class, N (%) | ||||
| Ideal | 3478 (3.6) | 2597 (3.5) | 637 (4.0) | 244 (3.1) |
| Underweight | 586 (0.6) | 410 (0.6) | 149 (0.9) | 27 (0.3) |
| Overweight | 42,466 (43.7) | 31,887 (43.4) | 7035 (44.3) | 3544 (44.8) |
| Class 1 obesity | 15,774 (16.2) | 11,715 (15.9) | 2635 (16.6) | 1424 (18.0) |
| Class 2 obesity | 20,333 (20.9) | 15,392 (20.9) | 3288 (20.7) | 1653 (20.9) |
| Class 3 obesity | 14,624 (15.0) | 11,470 (15.6) | 2127 (13.4) | 1027 (13.0) |
| Child-Turcotte-Pugh score (median [IQR]) | 5.0 [5.0–5.0] | 5.0 [5.0–5.0] | 5.0 [5.0–5.0] | 5.0 [5.0–5.0] |
| Child-Turcotte-Pugh class, N (%) | ||||
| A | 94,105 (95.7) | 70,958 (95.5) | 15,357 (95.7) | 7790 (97.4) |
| B | 4224 (4.3) | 3,338 (4.5) | 680 (4.2) | 206 (2.6) |
| C | 32 (0.0) | 24 (0.0) | 8 (0.0) | 0 (0.0) |
| AUDIT-C 1-3 (some alcohol use), N (%) | 49,648 (50.5) | 37,768 (50.8) | 7862 (49.0) | 4018 (50.3) |
| Ascites at baseline, N (%) | 142 (0.1) | 98 (0.1) | 33 (0.2) | 11 (0.1) |
| HE at baseline, N (%) | 219 (0.2) | 140 (0.2) | 57 (0.4) | 22 (0.3) |
| Baseline laboratory tests | ||||
| Serum AFP, ng/mL (median [IQR]) | 2.9 [2.0–4.2] | 2.9 [2.0–4.2] | 2.9 [2.0–4.2] | 2.9 [2.0–4.2] |
| Serum albumin, g/dL (median [IQR]) | 4.1 [3.9–4.4] | 4.1 [3.9–4.4] | 4.1 [3.8–4.3] | 4.2 [3.9–4.4] |
| Total bilirubin, mg/dL (median [IQR]) | 0.6 [0.4–0.8] | 0.6 [0.4–0.8] | 0.6 [0.4–0.8] | 0.6 [0.5–0.8] |
| Platelet count, k/μL (median [IQR]) | 227.0 [191.0–268.0] | 226.0 [190.0–267.0] | 232.5 [195.0–276.0] | 227.0 [191.0–268.0] |
| MELD-Na score (median [IQR]) | 6.0 [6.0–9.0] | 6.0 [6.0–8.0] | 6.0 [6.0–9.0] | 6.0 [6.0–8.0] |
| AST, U/mL (median [IQR]) | 31.0 [25.0–38.7] | 31.0 [25.0–38.0] | 32.0 [26.0–40.0] | 32.5 [26.7–41.0] |
| ALT U/mL (median [IQR]) | 44.5 [39.5–53.5] | 44.8 [40.0–53.5] | 43.7 [38.0–52.0] | 46.0 [40.0–57.0] |
| HBA1c, % (median [IQR]) | 6.1 [5.7–7.1] | 6.1 [5.6–7.1] | 6.2 [5.7–7.2] | 6.2 [5.7–7.3] |
| Total cholesterol, mg/dL (median [IQR]) | 175.0 [149.0–204.0] | 174.1 [148.5–203.0] | 176.5 [149.0–206.0] | 178.0 [151.5–206.0] |
| Serum triglycerides, mg/dL (median [IQR]) | 147.0 [102.0–217.5] | 152.0 [106.0–224.0] | 124.0 [87.0–181.0] | 154.0 [106.0–223.5] |
| Chronic kidney disease, N (%) | 4427 (4.5) | 3379 (4.5) | 811 (5.1) | 237 (3.0) |
| Coronary artery disease, N (%) | 21,570 (21.9) | 17,733 (23.9) | 2558 (15.9) | 1279 (16.0) |
| Diabetes, on entry, N (%) | 72,226 (73.4) | 54,244 (73.0) | 12,031 (75.0) | 5951 (74.4) |
| Metformin utilization on entry, N (%) | 17,156 (17.4) | 12,771 (17.2) | 2639 (16.4) | 1746 (21.8) |
| Insulin utilization on entry, N (%) | 7945 (8.1) | 5701 (7.7) | 1544 (9.6) | 700 (8.8) |
| Sulfonylurea utilization on entry, N (%) | 11,490 (11.7) | 8495 (11.4) | 1851 (11.5) | 1144 (14.3) |
| Thiazolidinediones utilization on entry, N (%) | 1402 (1.4) | 1092 (1.5) | 189 (1.2) | 121 (1.5) |
| SGLT2i utilization on entry, N (%) | 103 (0.1) | 76 (0.1) | 22 (0.1) | 5 (0.1) |
| GLP1RA utilization on entry, N (%) | 218 (0.2) | 169 (0.2) | 34 (0.2) | 15 (0.2) |
| DPP4 utilization on entry, N (%) | 446 (0.5) | 310 (0.4) | 96 (0.6) | 40 (0.5) |
| Statin utilization on entry (%) | 46,603 (47.4) | 36,612 (49.3) | 6746 (42.0) | 3245 (40.6) |
| Fibrate utilization on entry, N (%) | 5231 (5.3) | 4539 (6.1) | 310 (1.9) | 382 (4.8) |
Abbreviations: AFP, alfafetoprotein; AUDIT-C, Alcohol Use Disorders Identification Test; FIB4, Fibrosis-4; HBA1c, hemoglobin A1c; MELD-Na, Model for End-Stage Liver Disease-Sodium.
FIB4 slopes are linear and normally distributed
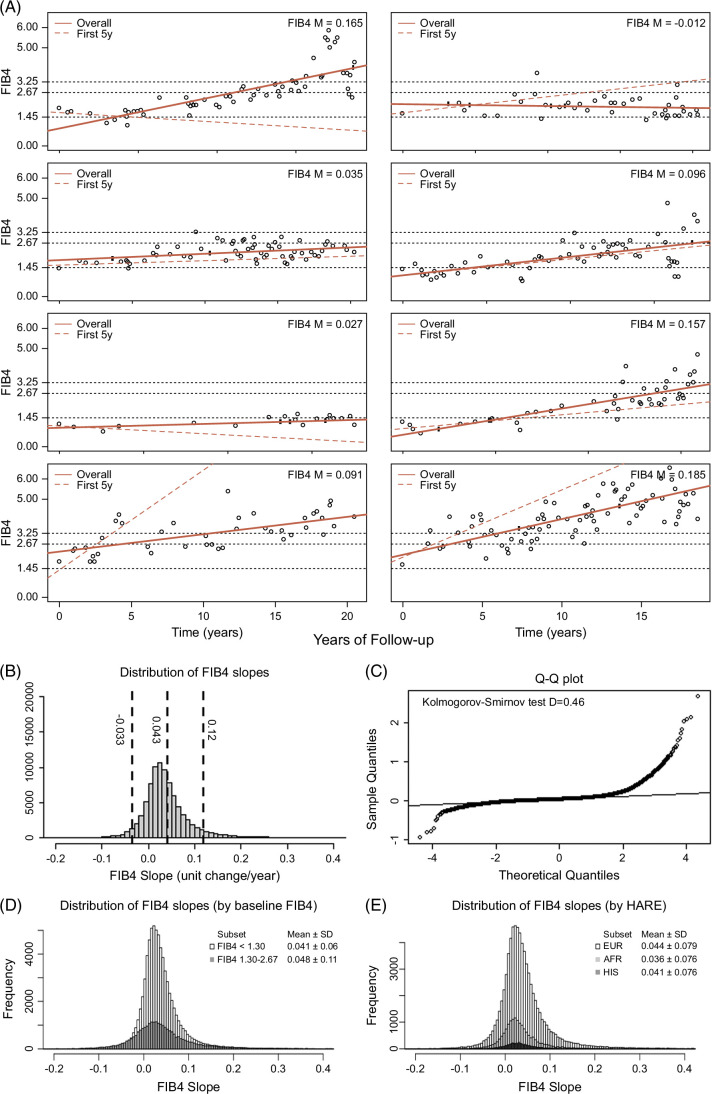
We visually represented FIB4 values over time in all members of the cohort with representative plots (Figure 1A). In most cases, the trend appeared linear even after the appropriateness of linear modeling was confirmed. (Supplemental Methods, Supplemental Figure S2, http://links.lww.com/HC9/A963). FIB4 slopes calculated from linear models were normally distributed with a mean FIB4 slope of 0.043 units/year (SD: 0.076) and normality confirmed by Q-Q plots and Kolmogorov-Smirnov test, D = 0.46 (Figures 1B, C). FIB4 slope was normally distributed among participants with low (<1.3) or intermediate (1.30–2.67) initial FIB4 values and with various genetic (HARE) ancestries (Figures 1D, E), with slightly higher mean slope identified among individuals entering the cohort at FIB4 1.30–2.67 and lower slopes among individuals of African ancestry.
FIGURE 1.
FIB4 slopes evolve linearly in MASLD. (A) Representative dot plots of FIB4 values over years of clinical follow-up. Slope values derived from linear models are represented by a solid red line and reported in the top right. FIB4 slopes using only first 5 years of data are shown in the red dotted lines. (B) Distribution of FIB4 slope values. (C) QQ plot for distribution showing normality. (D) Distribution of FIB4 slopes by FIB4 baseline <1.3 or 1.3–2.67. (E) Distribution of FIB4 slope values by genetic ancestry. Abbreviations: FIB4, Fibrosis-4; MASLD, metabolic dysfunction–associated steatotic liver disease.
In multivariable linear regression models (Table 2), FIB4 slope was associated with age at enrollment, baseline FIB4, male sex, African ancestry (lower compared to European ancestry), and diabetes mellitus. Among individuals with diabetes at entry, FIB4 slope increase was exacerbated by insulin use but partially attenuated by metformin or GLP1RAs. Tobacco use was not associated with the FIB4 slope. Paradoxically, obesity was associated with a modest reduction in FIB4 slope relative to ideal body weight. Overall, however, baseline clinical factors poorly predicted the FIB4 slope with a pseudo R2 of 0.053.
TABLE 2.
Predictors of FIB4 slope (per 0.01 slope unit)
| Simple | Multivariable | |||||
|---|---|---|---|---|---|---|
| b | SE | p | b | SE | p | |
| (Intercept) | 3.84 | 0.04 | <0.0001 | −0.65 | 0.25 | 0.01 |
| Baseline FIB4 per 0.1 increase | 0.10 | 0.01 | <0.0001 | 0.03 | 0.01 | <0.0001 |
| Age at entry, per year | 0.11 | 0.00 | <0.0001 | 0.09 | 0.00 | <0.0001 |
| Sex | ||||||
| Female | Reference | |||||
| Male | 1.05 | 0.08 | <0.0001 | 0.45 | 0.09 | <0.0001 |
| Genetic ancestry | ||||||
| European | Reference | |||||
| African | −0.82 | 0.07 | <0.0001 | −0.48 | 0.07 | <0.0001 |
| Hispanic | −0.29 | 0.09 | 0.0016 | −0.04 | 0.09 | 0.81 |
| BMI class | ||||||
| Ideal | Reference | |||||
| Underweight | −0.07 | 0.35 | 0.83 | 0.01 | 0.35 | 0.88 |
| Overweight | −0.77 | 0.14 | <0.0001 | −0.73 | 0.14 | <0.0001 |
| Class 1 obesity | −1.04 | 0.15 | <0.0001 | −0.99 | 0.15 | <0.0001 |
| Class 2 obesity | −0.83 | 0.14 | <0.0001 | −0.78 | 0.14 | <0.0001 |
| Class 3 obesity | −0.60 | 0.15 | 0.0001 | −0.50 | 0.15 | 0.0008 |
| Tobacco use | ||||||
| Nonsmoker | Reference | |||||
| Former | 0.12 | 0.38 | 0.03 | −0.06 | 0.06 | 0.32 |
| Current | 0.03 | 0.05 | 0.67 | 0.08 | 0.07 | 0.25 |
| Diabetes mellitus | ||||||
| Absent | Reference | |||||
| Present | 0.91 | 0.06 | <0.0001 | 0.58 | 0.06 | <0.0001 |
| Baseline use of metformin | ||||||
| Absent | Reference | |||||
| Present | −0.02 | 0.07 | 0.78 | −0.49 | 0.07 | <0.0001 |
| Baseline use of insulin | ||||||
| Absent | Reference | |||||
| Present | 0.85 | 0.09 | <0.0001 | 0.64 | 0.10 | <0.0001 |
| Baseline use of sulfonylurea | ||||||
| Absent | Reference | |||||
| Present | 0.25 | 0.08 | 0.0015 | 0.03 | 0.09 | 0.7696 |
| Baseline use of thiazolidinedione | ||||||
| Absent | Reference | |||||
| Present | 0.68 | 0.21 | 0.0012 | 0.39 | 0.22 | 0.07 |
| Baseline use of SGLT2i | ||||||
| Absent | Reference | |||||
| Present | −1.13 | 0.78 | 0.14 | −1.15 | 0.81 | 0.16 |
| Baseline use of GLP1RA | ||||||
| Absent | Reference | |||||
| Present | −0.68 | 0.54 | 0.20 | −1.10 | 0.56 | 0.048 |
| Baseline use of statin | ||||||
| Absent | Reference | |||||
| Present | 0.27 | 0.05 | <0.0001 | −0.14 | 0.05 | 0.0092 |
| Baseline use of fibrate | ||||||
| Absent | Reference | |||||
| Present | 0.80 | 0.11 | <0.0001 | 0.66 | 0.11 | <0.0001 |
Abbreviation: FIB4, Fibrosis-4.
FIB4 slope is associated with the development of cirrhosis, HCC, and liver decompensation
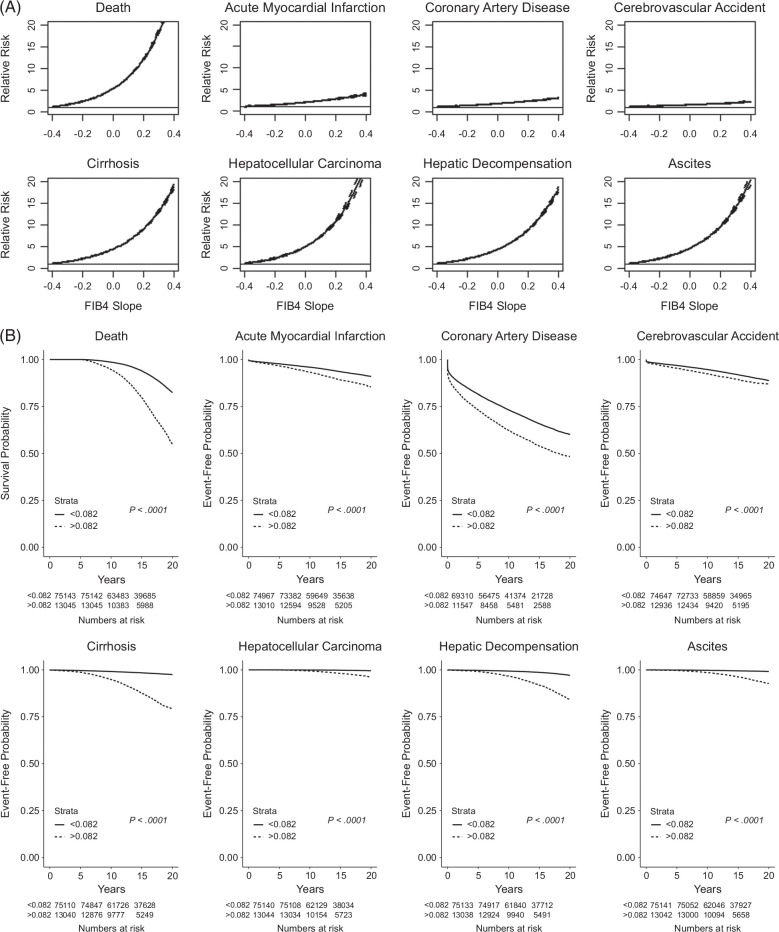
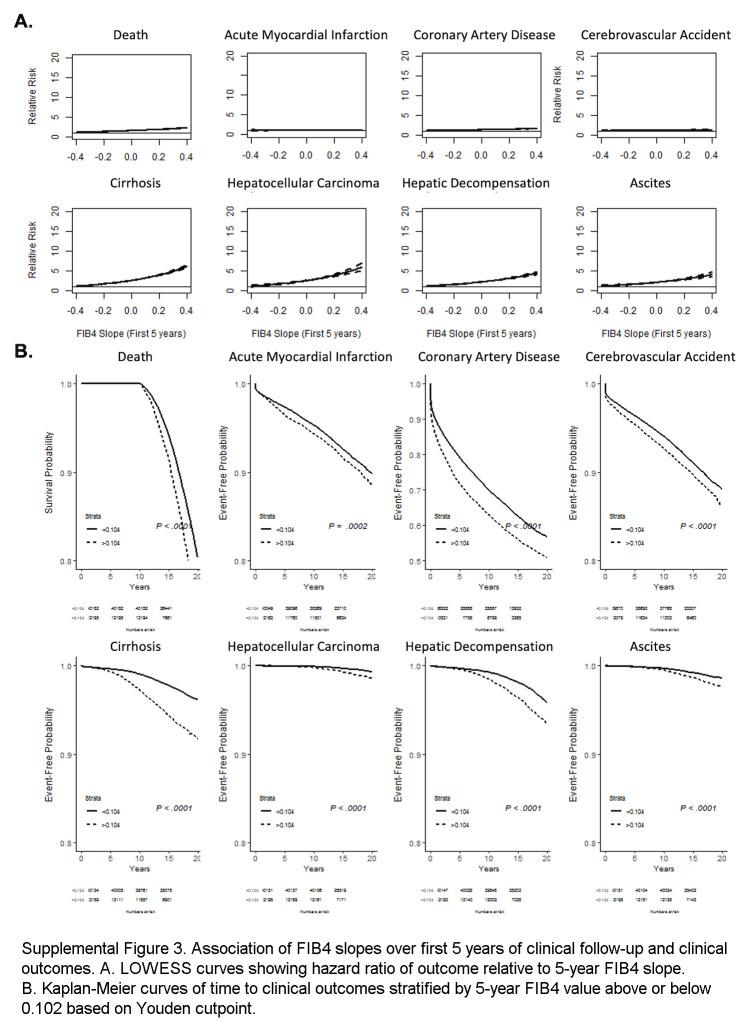
In competing-risk survival regression stratified by FIB4 slope for various clinical outcomes, increasing FIB4 slope was associated with marked and significant increases in relative risk for liver-related adverse outcomes (eg, cirrhosis, HCC, decompensation, and ascites) and death (Figure 2A), with significant but modest increases in relative risk for cardiovascular outcomes. Kaplan-Meier analysis demonstrated that steeper FIB4 slopes (>0.082 based on the Youden cutpoint) were associated with significantly shorter time to adverse liver-related and cardiovascular events and death (Figure 2B).
FIGURE 2.
Association of FIB4 slopes and clinical outcomes. (A) LOWESS curves showing HR of outcome relative to FIB4 slope. (B) Kaplan-Meier curves of time to clinical outcomes stratified by FIB4 value above or below 0.082 based on the Youden cutpoint. Abbreviation: FIB4, Fibrosis-4.
Additive value of FIB4 slope for prediction of clinical outcomes
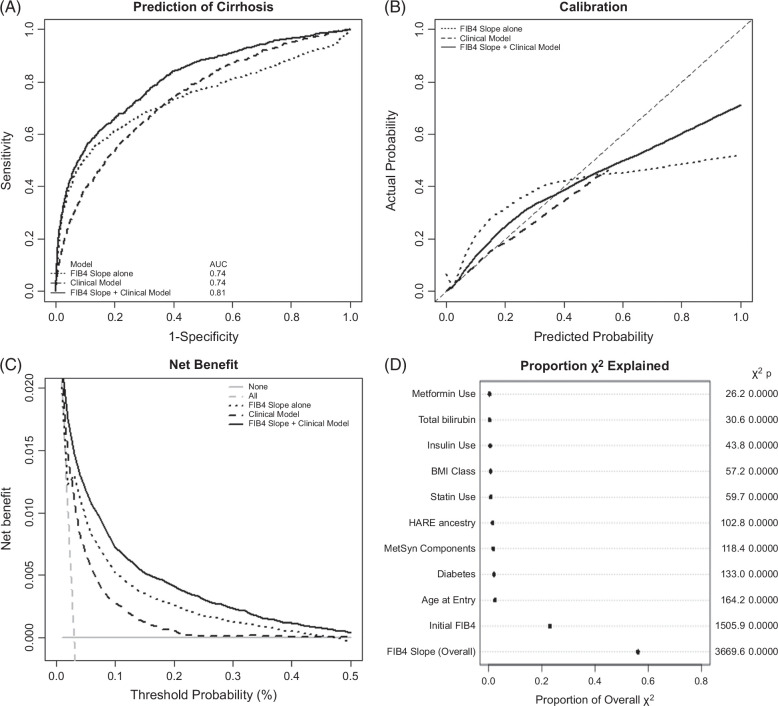
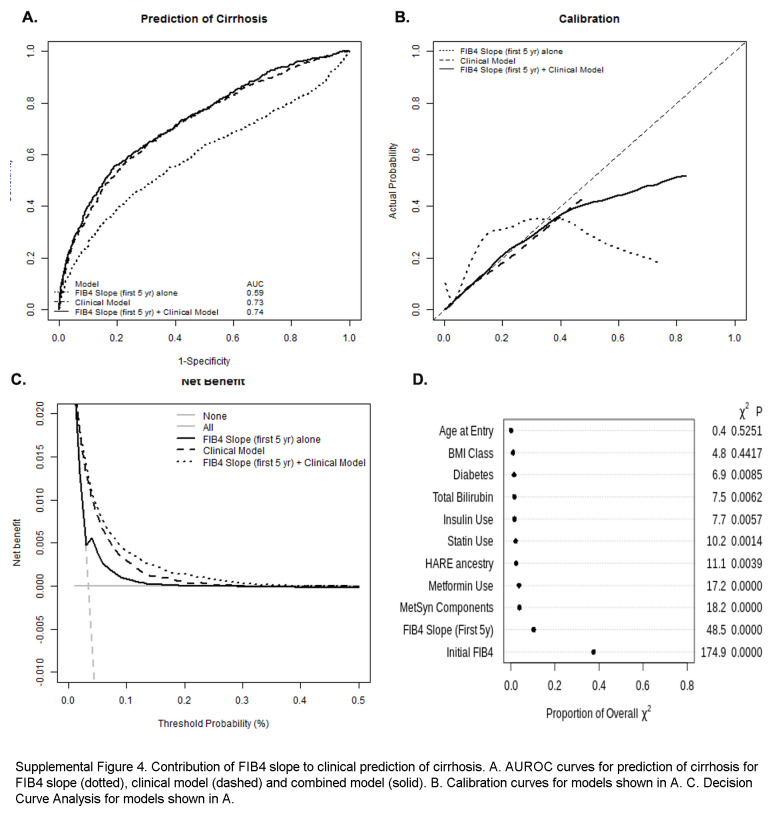
In competing-risk survival regression (time to diagnosis of cirrhosis with competing risk of death) and logistic regression model (cirrhosis occurrence up to 20 years of follow-up), the strongest baseline factors associated with cirrhosis diagnosis during follow-up included baseline FIB4, age at study enrollment, genetic ancestry (particularly Hispanic ancestry, conversely with protection in African ancestry), and diabetes (Supplemental Table S2, http://links.lww.com/HC9/A964). FIB4 slope was strongly associated with cirrhosis, with a 5% increased risk of developing cirrhosis associated with each 0.01 increase in FIB4 slope. It remained significant in multivariable models that included clinical covariates. In a multivariable analysis including clinical covariates and overall FIB4 slope, class 2-3 obesity was significantly associated with cirrhosis (subhazard ratio: 1.25–1.43), as was diabetes (subhazard ratio: 2.10; 95% CI: 1.84–2.40) and the associated use of metformin and/or insulin, while baseline statin use appeared protective (subhazard ratio: 0.72; 95% CI: 0.65–0.78). Similar results were found in models isolating individuals entering the cohort with low and intermediate FIB4 levels (Supplemental Table S3, http://links.lww.com/HC9/A964). There was also an expected significant interaction between age at entry and baseline FIB4 that did not impact the association of FIB4 slope and time to cirrhosis. In logistic regression, the AUCs for FIB4 slope or multivariable clinical model were each 0.74, while a model combining both had an AUC of 0.81 (Figure 3A). Calibration of the combined model was good up to a 50% predicted risk of cirrhosis (Figure 3B); the addition of FIB4 slope to clinical models improved clinical prediction for the development of cirrhosis over a range of probability of 0%–50% (Figure 3C). Similarly, adding FIB4 slope to Cox models predicting time to cirrhosis provides the greatest improvement of model fit (χ2) (Figure 3D).
FIGURE 3.
Contribution of FIB4 slope to the clinical prediction of cirrhosis. (A) AUROC curves for prediction of cirrhosis for FIB4 slope (dotted), clinical model (dashed), and combined model (solid). (B) Calibration curves for models shown in (A). (C) Decision curve analysis for models shown in (A). (D) Percentage of χ2 of Cox models explained by each predictive variable. Abbreviation: FIB4, Fibrosis-4.
FIB4 slopes from the first 5 years of observation modestly correlate with overall FIB4 slopes but remain predictive of clinical outcomes
57,964 individuals had at least 5 FIB4 values within the first 5 years of observation, allowing the calculation of linear slopes. Clinical covariates associated with FIB45y slope overall were similar to predictors of overall slope (Supplemental Table S3, http://links.lww.com/HC9/A964). FIB45y slope correlated modestly but significantly with the overall FIB4 slope (r2 = 0.15, p < 0.0001, Supplemental Figure S2F, http://links.lww.com/HC9/A963) and was predictive of clinical outcomes over up to 20 years of follow-up (Supplemental Figure S3, http://links.lww.com/HC9/A965). FIB4 slopes from the first 5 years remained associated with the development of cirrhosis in univariable and multivariable models, including clinical parameters (Supplemental Table S4, http://links.lww.com/HC9/A964, Supplemental Table S5, http://links.lww.com/HC9/A964) and marginally improved discrimination and net benefit of models predicting cirrhosis (Supplemental Figure S4, http://links.lww.com/HC9/A966).
A GWAS of FIB4-slope in the MVP MASLD cohort
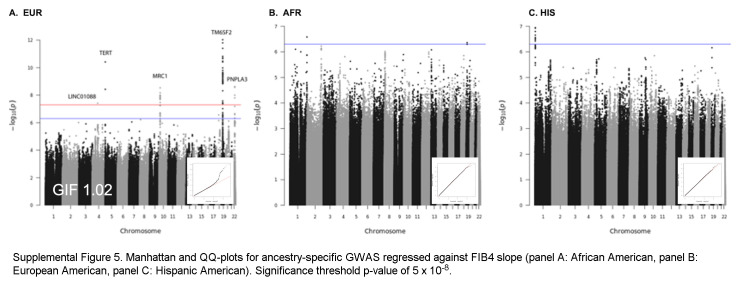
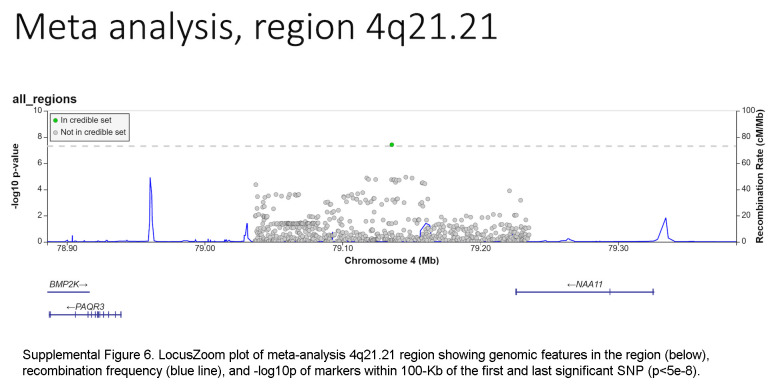
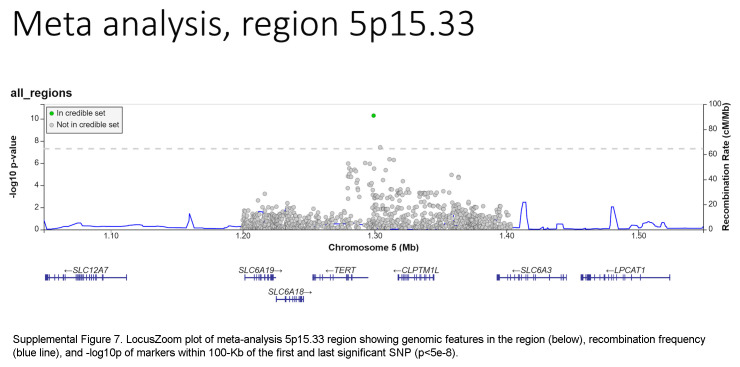
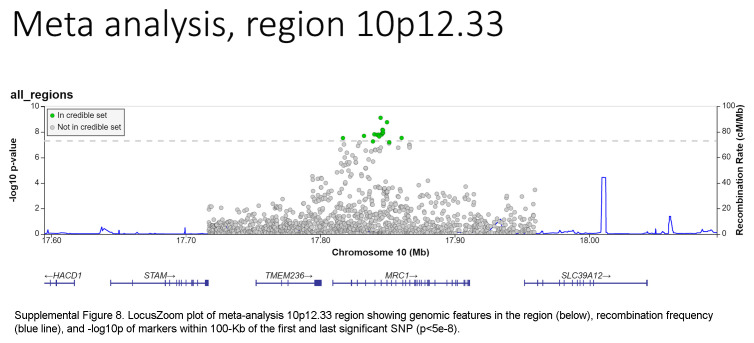
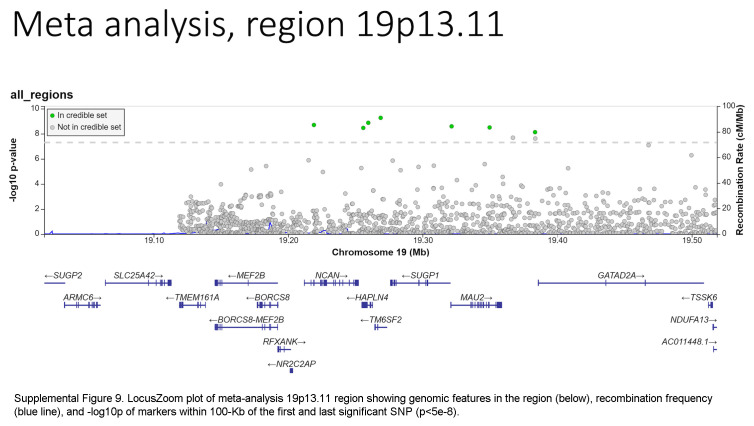
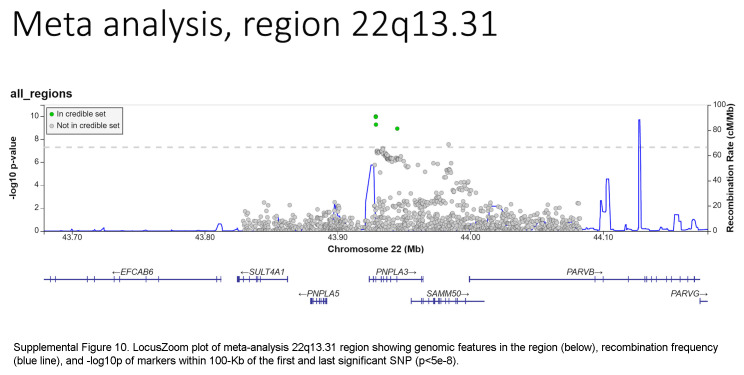
Based on the foregoing clinical correlations with FIB4 slope, we investigated genetic variants associated with fibrosis progression in MASLD. Across multiancestry meta-analysis and European-specific analysis, 5 loci exceeded genome-wide significance levels (Table 3, Figure 4, Supplemental Table S6, http://links.lww.com/HC9/A964, Supplemental Figure S5A, http://links.lww.com/HC9/A967), including 2 established loci associated with cirrhosis (PNPLA3 and TM6SF2) and 3 others: 4q21.21 (rs116429209, LINC01088), 5p15.33 (rs2735947, TERT), and 10p12.33 (rs370291803, MRC1). The GWAS of African and Hispanic ancestry did not return any genome-wide significant associations (genomic inflation factors = 1.01 and 0.97, respectively) (Supplemental Tables S7, S8, http://links.lww.com/HC9/A964, Supplemental Figures S5B, C, http://links.lww.com/HC9/A967). For the 5 regions with significant SNPs, we generated genomic regional plots by LocusZoom (Supplemental Figures S6–S10, http://links.lww.com/HC9/A968, http://links.lww.com/HC9/A969, http://links.lww.com/HC9/A970, http://links.lww.com/HC9/A971, http://links.lww.com/HC9/A972, respectively). Secondary signal analysis for lead SNPs at each region with significant markers in the European ancestry analysis did not identify additional independent SNPs at any region.
TABLE 3.
Polymorphisms associated with FIB4 slope in meta-analysis
| Chromosome | b38_position | rsID | Allele1 | Allele2 | A1 Frequency | β | SE | p | Directiona | Nearest gene |
|---|---|---|---|---|---|---|---|---|---|---|
| 4 | 79135759 | rs116429209 | A | G | 0.9892 | −0.1492 | 0.0271 | 3.89E−08 | ? − ? | LINC01088 |
| 5 | 1299277 | rs2735947 | A | G | 0.1319 | 0.0458 | 0.0070 | 5.11E−11 | − + + | TERT |
| 10 | 17844928 | rs691613 | A | G | 0.3624 | −0.0300 | 0.0049 | 7.75E−10 | − − − | MRC1 |
| 19 | 19268740 | rs58542926 | T | C | 0.0759 | 0.0527 | 0.0085 | 5.39E−10 | + + − | TM6SF2 |
| 22 | 43928847 | rs738409 | C | G | 0.7406 | −0.0329 | 0.0051 | 1.02E−10 | − − − | PNPLA3 |
Directionality of association in European-African-Hispanic ancestries.
Abbreviation: FIB4, Fibrosis-4.
FIGURE 4.
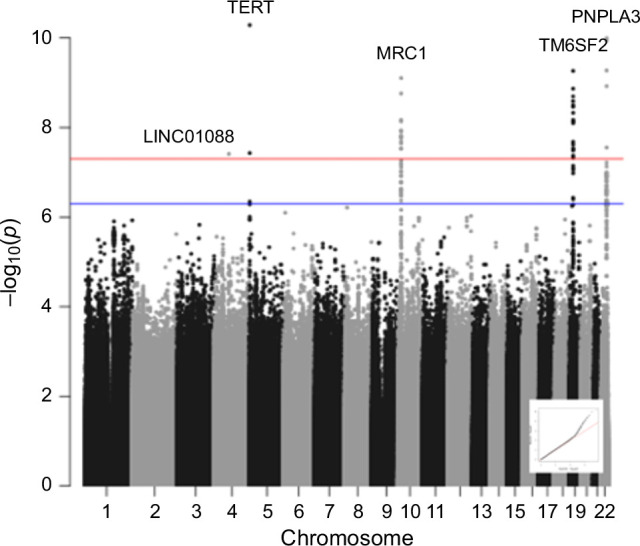
Manhattan plot for multiancestry GWAS meta-analysis of FIB4 slope in individuals with MASLD. Significant SNPs on chromosomes 4, 5, 10, 19, and 22 were observed at a threshold p value of 5 × 10⁻⁸. A QQ plot is embedded. Abbreviations: FIB4, Fibrosis-4; GWAS, genome-wide association study; MASLD, metabolic dysfunction–associated steatotic liver disease.
Coding variant mapping
The ANNOVAR and RegulomeDB query results for variants in LD with lead SNPs for the meta-analysis appear in Supplemental Table S9, http://links.lww.com/HC9/A964, along with R2 values between each SNP and the lead SNP per region. For the chromosome 4 region (LINC01088), the lead SNP is the putative causal variant. For the chromosome 5 region (TERT, intergenic), the SNP rs2735944 in high LD with the lead SNP (R2 = 0.7) has a RegulomeDB score of 3a and is a potential causal SNP. For the chromosome 10 region (MRC1), the nonsynonymous SNP rs606231248 (G396S), in high LD with the lead SNP (R2 = 0.92), is a putative causal variant. For the chromosome 19 region (TM6SF2), the lead SNP rs58542926 is a nonsynonymous coding variant (E167K) and is the putative causal variant. For the chromosome 22 region (PNPLA3), the lead SNP rs738409 is a nonsynonymous coding variant (I148M) and is the putative causal variant.
PheWAS
Briefly, lead SNPs in the chromosome 4 region (LINC01088), chromosome 5 region (TERT), and chromosome 10 region (MRC1) have not been previously associated with any MASLD-related phenotypes. The lead SNPs in the chromosome 19 (TM6SF2) and 22 (PNPLA3) regions have been strongly associated with lipid disorders, liver enzymes, and chronic liver disease (Supplemental Table S10, http://links.lww.com/HC9/A964).
Polygenic risk score
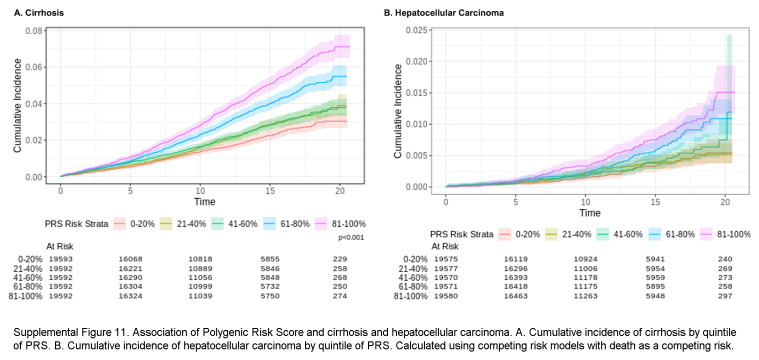
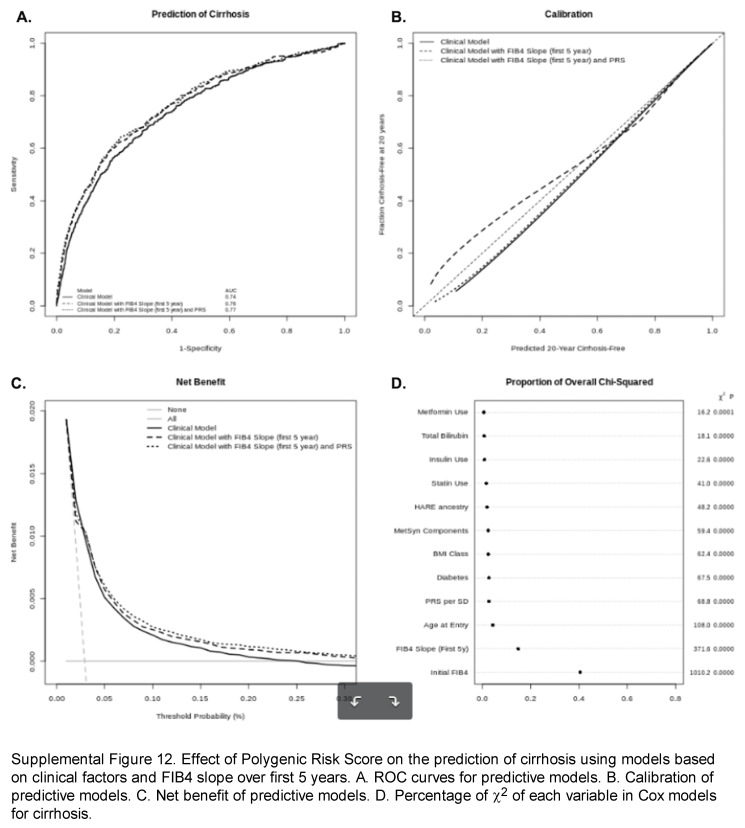
We explored the additive effect of a polygenic risk score (PRS) derived from the lead SNPs associated with FIB4 slope for a 20-year prediction of cirrhosis and HCC. Frequencies of the risk alleles included are shown in Supplemental Table S11, http://links.lww.com/HC9/A964. Two high-risk alleles, PNPLA3 G and MRC1 A, were most common in individuals of Hispanic ancestry, while TERT A and TM6SF2 were most common in individuals of European ancestry; all risk alleles were least common in individuals of African ancestry. Quintiles of PRS significantly discriminated risk of development of both cirrhosis and HCC (Supplemental Figure S11, http://links.lww.com/HC9/A973). Addition of PRS to Cox models for time to cirrhosis including FIB4 slope over the first 5 years nominally improved discrimination, calibration, and net benefit of these prediction models (Supplemental Figure S12A–C, http://links.lww.com/HC9/A974). Each standard deviation of PRS was associated with a 25% increased risk of development of cirrhosis (Supplemental Table S12, http://links.lww.com/HC9/A964). These data suggest the addition of PRS to FIB4 slope over the first 5 years improves the prediction of future cirrhosis and related complications.
DISCUSSION
In this large cohort of patients with MASLD, we show that FIB4, an estimate of liver fibrosis, increases in a linear fashion during follow-up of 5 or more years. The slope of FIB4 (an estimate of the change in FIB4 over time) was normally distributed in populations with European, African, and Hispanic ancestry. Male sex and baseline diabetes (particularly if receiving insulin, and partially mitigated by metformin) were independently associated with higher FIB4 slope (ie, more rapid progression of liver fibrosis); by contrast, African ancestry appeared protective. FIB4 slopes were strongly associated with the development of cirrhosis and liver-related decompensations and modestly associated with cardiovascular morbidity during follow-up, consistent with underlying cardiometabolic risk factors in MASLD. FIB4 slope during the entire duration of follow-up, and to a lesser extent during the first 5 years, was independently associated with the development of cirrhosis in multivariable models that included baseline FIB4 values and clinical and demographic factors such as ancestry, BMI, diabetes, need for diabetes medications, and statin use (protective).
Individual FIB4 measurements, originally derived as a laboratory-based predictor of histological cirrhosis, have been shown to correlate with future development of hepatic decompensation or HCC with a C-statistic >0.7–0.8.7,8,9,10 Recently, a study using data from the UK Biobank found that evaluating 2 FIB4 values over a 5-year period either when used to model annual change or when evaluating change from low risk to intermediate risk or high risk was associated with liver disease outcomes.11 This finding was expanded upon in a study using a VA cohort, which showed that categorical changes from low risk to high risk based on FIB4 over 3 years predicted clinical events such as cirrhosis and HCC.12
Our findings expand upon this prior research. First, we show that, in most individuals, FIB4 evolves linearly during prolonged clinical follow-up, allowing for greater extrapolation of outcomes from available clinical data points. Second, we identify a rate of FIB4 change that appears to discriminate individuals likely to develop cirrhosis or other hepatic events during extended follow-up. Third, we confirm and refine additional baseline clinical factors that impact the progression to cirrhosis, such as diabetes and class 2-3 obesity, ancestry, and medications. Similar to the findings from Cholankeril et al,12 we observed important effects of ancestry, particularly a harmful effect of Hispanic ancestry and a protective effect of African ancestry, on liver-related outcomes, despite not identifying any ancestry-specific genome-wide significant SNPs impacting FIB4 progression in those smaller subgroups, possibly due to low power. The ancestry-specific risk for cirrhosis development was eliminated in Hispanic ancestry and further reduced in African ancestry by including PNPLA3 G gene dose in these models (data not shown), suggesting that ancestry-specific risks largely reflect the frequency of PNPLA3 C>G.
In total, we identified 5 SNPs including rs116429209 (LINC01088), rs2735947 (TERT), rs691613 (MRC1), rs58542926 (TM6SF2), and rs738409 (PNPLA3) that were associated with FIB4 slope, and a PRS based on these genes was independently associated with progression to cirrhosis within this cohort. The finding of 2 well-known cirrhosis-associated genetic variants (PNPLA3 and TM6SF2) supports the validity of using FIB4 slope to monitor hepatic fibrosis progression. The PNPLA3 rs738409 I148M variant has been associated with progressive fibrosis and adverse clinical outcomes in alcohol-associated liver disease and chronic hepatitis C.17,18,21 In MASLD, PNPLA3 rs738409 has been associated with more severe inflammation, advanced fibrosis,16,19,20,22,23,24,26,28 progression to cirrhosis,6,15,24,27 HCC,20,25,26,27 and liver-related death27 in biopsy-defined and administrative cohorts. We also replicated the SNP in TM6SF2 that was associated with hepatic inflammation and perivenular fibrosis in a bariatric surgery cohort43 and confirmed in a European biopsy cohort.19 However, a multicenter German liver-biopsy–based study failed to replicate the effect of TM6SF2 rs58542926 on liver fibrosis after controlling for PNPLA3 rs738409 and MBOAT7 rs641738.23 We did not identify MBOAT7 rs641738 as significant (p = 0.32), although it was implicated in worsened inflammation, progressive fibrosis,22,28 and cirrhosis in alcohol-associated liver disease,29 chronic hepatitis B,31 chronic hepatitis C,30 and MASLD.15 Other SNPs that have been implicated in fibrosis or cirrhosis in MASLD/MASH include MERTK rs4374383,44 MTARC1 p.A165T,15 HSD17B13 rs72613567,15,16 HFE C282Y,15 SERPINA1 E366K,15 GCKR rs780094 (p = 0.0052 in our GWAS),16 LEPR,16 SUGP1,16 COL13A1, and rs343062 on chromosome 7,45 CPN-ERLIN1-CHUK,46 HLA-DQB1*06,47 and KLF6 rs3750861.48
The association of TERT, MRC1, and LINC01088;NIAA11;PAQR2 variants with FIB4 progression identified in this study are novel. TERT variants have been associated with pulmonary fibrosis49 and the development of HCC50 but not with fibrosis progression. As for rs69613, it is an intronic variant of MRC1 encoding the mannose receptor C-type 1, which is expressed in M2 macrophages and may mediate collagen internalization by macrophages with a profibrotic effect in mouse models of pancreatic cancer.36 Finally, rs116429209 is located within LINC01088 (long intergenic noncoding RNA 1088) but close to NAA11 (N-alpha-acetyltransferase 11, NatA catalytic subunit) and PAQR3 (progestin and adipoQ receptor family member 3). No liver phenotype has been associated with either rs69613 or rs116429209 to date. Further validation of these findings in other cohorts is critical.
From a clinical perspective, we found that linear models of FIB4 slope based on the first years of clinical follow-up correlated only moderately with long-term FIB4 slope due to greater effects of early variability in FIB4 values on linear models. Nonetheless, we define an FIB4 slope of 0.102 units/y that reasonably discriminates individuals at high risk of cirrhosis and liver-related complications in follow-up. The addition of PRS based on the 5 genes we identified provided independent and additive predictive ability. Once externally validated, this threshold, particularly when combined with other factors for progression, could be used for population health identification of high-risk individuals with baseline FIB4 <1.30 or <2.67 who may benefit from early lifestyle modification, medically supervised weight loss, or pharmacotherapy.
As with all VA studies, the preponderance of men may limit generalizability. To focus on the FIB4 slope in the population at risk for progression, we excluded 2% of the abnormal ALT cohort with baseline FIB4 ≥2.67 who would be predicted to have advanced fibrosis at entry and would likely have a high FIB4 slope before observation. Excluding this subset may have reduced our power to identify additional loci. We were also unable to differentiate MASH from MASLD in this cohort based on case identification. We also were unable to adjust slopes for “spurious” changes in FIB4 triggered by acute illnesses with carryover into the outpatient setting. Until the number of observations required and duration of follow-up required to calculate a stable FIB4 slope have been defined, application at an individual patient level should be approached cautiously, given random fluctuations that impact slope calculations.
In conclusion, FIB4 scores in MASLD follow a linear trajectory during long-term clinical follow-up and correlate strongly with the development of clinical outcomes. In addition to clinical factors, genetic polymorphisms in PNPLA3, TM6SF2, TERT, MRC1, and LINC01088 are associated with FIB4 slope and increased risk of cirrhosis development in MASLD. Refinement of the understanding of environmental and genetic risks for the development of liver-related complications may enhance the clinical identification of patients with MASLD who require more intensive therapeutic intervention.
Supplementary Material
Supplementary Material
DATA AVAILABILITY STATEMENT
The full summary-level association data from the multiancestry, European American, African American, Hispanic American, and Asian American meta-analysis from this report will be available through dbGAP (accession codes will be available before publication).
AUTHOR CONTRIBUTIONS
David E. Kaplan, Craig C. Teerlink, and Marijana Vujković: study concept and design; acquisition of data; analysis and interpretation of data; drafting of the manuscript; critical revision of the manuscript for important intellectual content; and statistical analysis. Tae-Hwi Schwantes-An: critical revision of the manuscript for important intellectual content and statistical analysis. Trina M. Norden-Krichmar, Scott L. DuVall, Timothy R. Morgan, and Benjamin F. Voight: critical revision of the manuscript for important intellectual content. Philip S. Tsao: critical revision of the manuscript for important intellectual content and obtained funding. Julie A. Lynch: acquisition of data; analysis and interpretation of data; critical revision of the manuscript for important intellectual content; statistical analysis; obtained funding; technical or material support; and study supervision. Kyong-Mi Chang: study concept and design; acquisition of data; analysis and interpretation of data; drafting of the manuscript; critical revision of the manuscript for important intellectual content; statistical analysis; obtained funding; technical or material support; and study supervision.
ACKNOWLEDGMENTS
Kathryn Pridgen, supported by the Million Veteran Program, provided writing support.
FUNDING INFORMATION
This research is based on analysis of data from the Million Veteran Program (MVP), Office of Research and Development, Veterans Health Administration and was supported by award no. MVP000. This research was supported by funding from the Department of Veterans Affairs Office of R&D awards I01-BX003362 entitled MVP003/028: “Genetics of Cardiometabolic Diseases in the VA Population” (Kyong-Mi Chang and Philip S. Tsao) and the VA Informatics and Computing Infrastructure (VINCI) VA HSR RES 130457 (Scott L. DuVall). Benjamin F. Voight acknowledges support for this work from the NIH/NIDDK (DK126194). Marijana Vujković acknowledges support from I01-BX003362 and NIH/NIDDK DK134575. Kyong-Mi Chang and Philip S. Tsao are supported by the VA Cooperative Studies Program. David E. Kaplan is supported by the Veterans Administration (I01 CX002010). The authors thank all MVP participants and research team members for their contributions. This publication does not represent the views of the Department of Veterans Affairs, the US Food and Drug Administration, or the US Government. The content is the responsibility of the authors alone and does not necessarily reflect the views of or imply endorsement by the US Government.
CONFLICTS OF INTEREST
Julie A. Lynch received grants from Alnylam, Astellas, AstraZeneca, Biodesix, Celgene, Cerner Enviza, GlaxoSmithKline, IQVIA, Janssen, Kantar Health, Myriad Genetic Laboratories, Novartis, and Parexel. Scott L. DuVall received grants from Alnylam, Astellas, AstraZeneca, Biodesix, Celgene, Cerner Enviza, GlaxoSmithKline, IQVIA, Janssen, Kantar Health, Myriad Genetic Laboratories, Novartis, and Parexel. David E. Kaplan advises and received grants from AstraZeneca and Roche Genentech. He received grants from Bausch, Exact, and Glycotest. Tae-Hwi Scwahtes-An consults for Target RWE. Kyong-Mi Chang consults for GlaxoSmithKline. He advises Virion. The remaining authors have no conflicts to report.
Footnotes
Abbreviations: AUDIT-C, Alcohol Use Disorders Identification Test; CDW, Corporate Data Warehouse; FIB4, Fibrosis-4; GWAS, genome-wide association study; LD, linkage disequilibrium; MASH, metabolic dysfunction–associated steatohepatitis; MASLD, metabolic dysfunction–associated steatotic liver disease; MELD-Na, Model for End-Stage Liver Disease-Sodium; MVP, Million Veteran Program; VA, Veterans Affairs; VHA, Veterans Health Administration.
Supplemental Digital Content is available for this article. Direct URL citations are provided in the HTML and PDF versions of this article on the journal's website, www.hepcommjournal.com.
Contributor Information
David E. Kaplan, Email: dakaplan@pennmedicine.upenn.edu.
Craig C. Teerlink, Email: craig.teerlink@va.gov.
Tae-Hwi Schwantes-An, Email: tlschwan@iu.edu.
Trina M. Norden-Krichmar, Email: Trina.Norden-Krichmar@va.gov.
Scott L. DuVall, Email: scott.duvall@va.gov.
Timothy R. Morgan, Email: timothy.morgan@va.gov.
Philip S. Tsao, Email: philip.tsao@va.gov.
Benjamin F. Voight, Email: bvoight@pennmedicine.upenn.edu.
Julie A. Lynch, Email: julie.lynch@va.gov.
Marijana Vujković, Email: vujkovic@pennmedicine.upenn.edu.
Kyong-Mi Chang, Email: kmchang@pennmedicine.upenn.edu.
REFERENCES
- 1. Younossi ZM, Koenig AB, Abdelatif D, Fazel Y, Henry L, Wymer M. Global epidemiology of nonalcoholic fatty liver disease—Meta-analytic assessment of prevalence, incidence, and outcomes. Hepatology. 2016;64:73–84. [DOI] [PubMed] [Google Scholar]
- 2. Musso G, Gambino R, Cassader M, Pagano G. Meta-analysis: Natural history of non-alcoholic fatty liver disease (NAFLD) and diagnostic accuracy of non-invasive tests for liver disease severity. Ann Med. 2011;43:617–649. [DOI] [PubMed] [Google Scholar]
- 3. Angulo P, Kleiner DE, Dam-Larsen S, Adams LA, Bjornsson ES, Charatcharoenwitthaya P, et al. Liver fibrosis, but no other histologic features, is associated with long-term outcomes of patients with nonalcoholic fatty liver disease. Gastroenterology. 2015;149:389–397.e10. [DOI] [PMC free article] [PubMed] [Google Scholar]
- 4. Simon TG, Roelstraete B, Sharma R, Khalili H, Hagström H, Ludvigsson JF. Cancer risk in patients with biopsy-confirmed nonalcoholic fatty liver disease: A population-based cohort study. Hepatology. 2021;74:2410–2423. [DOI] [PMC free article] [PubMed] [Google Scholar]
- 5. Singh S, Allen AM, Wang Z, Prokop LJ, Murad MH, Loomba R. Fibrosis progression in nonalcoholic fatty liver vs nonalcoholic steatohepatitis: A systematic review and meta-analysis of paired-biopsy studies. Clin Gastroenterol Hepatol. 2015;13:643–54; e1–e9; quiz e39–e40. [DOI] [PMC free article] [PubMed] [Google Scholar]
- 6. Chen VL, Oliveri A, Miller MJ, Wijarnpreecha K, Du X, Chen Y, et al. PNPLA3 genotype and diabetes identify patients with nonalcoholic fatty liver disease at high risk of incident cirrhosis. Gastroenterology. 2023;164:966–977.e17. [DOI] [PMC free article] [PubMed] [Google Scholar]
- 7. Shah AG, Lydecker A, Murray K, Tetri BN, Contos MJ, Sanyal AJ. Comparison of noninvasive markers of fibrosis in patients with nonalcoholic fatty liver disease. Clin Gastroenterol Hepatol. 2009;7:1104–1112. [DOI] [PMC free article] [PubMed] [Google Scholar]
- 8. Boursier J, Hagström H, Ekstedt M, Moreau C, Bonacci M, Cure S, et al. Non-invasive tests accurately stratify patients with NAFLD based on their risk of liver-related events. J Hepatol. 2022;76:1013–1020. [DOI] [PubMed] [Google Scholar]
- 9. Hagström H, Talbäck M, Andreasson A, Walldius G, Hammar N. Ability of noninvasive scoring systems to identify individuals in the population at risk for severe liver disease. Gastroenterology. 2020;158:200–214. [DOI] [PubMed] [Google Scholar]
- 10. Johnson AL, Hayward KL, Patel P, Horsfall LU, Cheah AEZ, Irvine KM, et al. Predicting liver-related outcomes in people with nonalcoholic fatty liver disease: The prognostic value of noninvasive fibrosis tests. Hepatol Commun. 2022;6:728–739. [DOI] [PMC free article] [PubMed] [Google Scholar]
- 11. Hagström H, Talbäck M, Andreasson A, Walldius G, Hammar N. Repeated FIB-4 measurements can help identify individuals at risk of severe liver disease. J Hepatol. 2020;73:1023–1029. [DOI] [PubMed] [Google Scholar]
- 12. Cholankeril G, Kramer JR, Chu J, Yu X, Balakrishnan M, Li L, et al. Longitudinal changes in fibrosis markers are associated with risk of cirrhosis and hepatocellular carcinoma in non-alcoholic fatty liver disease. J Hepatol. 2023;78:493–500. [DOI] [PMC free article] [PubMed] [Google Scholar]
- 13. Vujkovic M, Ramdas S, Lorenz KM, Guo X, Darlay R, Cordell HJ, et al. A multiancestry genome-wide association study of unexplained chronic ALT elevation as a proxy for nonalcoholic fatty liver disease with histological and radiological validation. Nat Genet. 2022;54:761–771. [DOI] [PMC free article] [PubMed] [Google Scholar]
- 14. Speliotes EK, Yerges-Armstrong LM, Wu J, Hernaez R, Kim LJ, Palmer CD, et al. Genome-wide association analysis identifies variants associated with nonalcoholic fatty liver disease that have distinct effects on metabolic traits. PLoS Genet. 2011;7:e1001324. [DOI] [PMC free article] [PubMed] [Google Scholar]
- 15. Emdin CA, Haas ME, Khera AV, Aragam K, Chaffin M, Klarin D, et al. A missense variant in Mitochondrial Amidoxime Reducing Component 1 gene and protection against liver disease. PLoS Genet. 2020;16:e1008629. [DOI] [PMC free article] [PubMed] [Google Scholar]
- 16. Anstee QM, Darlay R, Cockell S, Meroni M, Govaere O, Tiniakos D, et al. Genome-wide association study of non-alcoholic fatty liver and steatohepatitis in a histologically characterised cohort. J Hepatol. 2020;73:505–515. [DOI] [PubMed] [Google Scholar]
- 17. Trépo E, Pradat P, Potthoff A, Momozawa Y, Quertinmont E, Gustot T, et al. Impact of patatin-like phospholipase-3 (rs738409 C>G) polymorphism on fibrosis progression and steatosis in chronic hepatitis C. Hepatology. 2011;54:60–69. [DOI] [PubMed] [Google Scholar]
- 18. Nischalke HD, Berger C, Luda C, Berg T, Müller T, Grünhage F, et al. The PNPLA3 rs738409 148M/M genotype is a risk factor for liver cancer in alcoholic cirrhosis but shows no or weak association in hepatitis C cirrhosis. PLoS One. 2011;6:e27087. [DOI] [PMC free article] [PubMed] [Google Scholar]
- 19. Liu YL, Reeves HL, Burt AD, Tiniakos D, McPherson S, Leathart JBS, et al. TM6SF2 rs58542926 influences hepatic fibrosis progression in patients with non-alcoholic fatty liver disease. Nat Commun. 2014;5:4309. [DOI] [PMC free article] [PubMed] [Google Scholar]
- 20. Liu YL, Patman GL, Leathart JBS, Piguet AC, Burt AD, Dufour JF, et al. Carriage of the PNPLA3 rs738409 C >G polymorphism confers an increased risk of non-alcoholic fatty liver disease associated hepatocellular carcinoma. J Hepatol. 2014;61:75–81. [DOI] [PubMed] [Google Scholar]
- 21. Tamaki N, Kurosaki M, Higuchi M, Takada H, Nakakuki N, Yasui Y, et al. Genetic polymorphisms of IL28B and PNPLA3 are predictive for HCV related rapid fibrosis progression and identify patients who require urgent antiviral treatment with new regimens. PLoS One. 2015;10:e0137351. [DOI] [PMC free article] [PubMed] [Google Scholar]
- 22. Mancina RM, Dongiovanni P, Petta S, Pingitore P, Meroni M, Rametta R, et al. The MBOAT7-TMC4 variant rs641738 increases risk of nonalcoholic fatty liver disease in individuals of European descent. Gastroenterology. 2016;150:1219–1230 e6. [DOI] [PMC free article] [PubMed] [Google Scholar]
- 23. Krawczyk M, Rau M, Schattenberg JM, Bantel H, Pathil A, Demir M, et al. Combined effects of the PNPLA3 rs738409, TM6SF2 rs58542926, and MBOAT7 rs641738 variants on NAFLD severity: A multicenter biopsy-based study. J Lipid Res. 2017;58:247–255. [DOI] [PMC free article] [PubMed] [Google Scholar]
- 24. Kupcinskas J, Valantiene I, Varkalaitė G, Steponaitiene R, Skieceviciene J, Sumskiene J, et al. PNPLA3 and RNF7 gene variants are associated with the risk of developing liver fibrosis and cirrhosis in an eastern European population. J Gastrointestin Liver Dis. 2017;26:37–43. [DOI] [PubMed] [Google Scholar]
- 25. Donati B, Dongiovanni P, Romeo S, Meroni M, McCain M, Miele L, et al. MBOAT7 rs641738 variant and hepatocellular carcinoma in non-cirrhotic individuals. Sci Rep. 2017;7:4492. [DOI] [PMC free article] [PubMed] [Google Scholar]
- 26. Kawaguchi T, Shima T, Mizuno M, Mitsumoto Y, Umemura A, Kanbara Y, et al. Risk estimation model for nonalcoholic fatty liver disease in the Japanese using multiple genetic markers. PLoS One. 2018;13:e0185490. [DOI] [PMC free article] [PubMed] [Google Scholar]
- 27. Unalp‐Arida A, Ruhl CE. Patatin-like phospholipase domain-containing protein 3 I148M and liver fat and fibrosis scores predict liver disease mortality in the U.S. population. Hepatology. 2020;71:820–834. [DOI] [PubMed] [Google Scholar]
- 28. Teo K, Abeysekera KWM, Adams L, Aigner E, Anstee QM, Banales JM, et al. rs641738C>T near MBOAT7 is associated with liver fat, ALT and fibrosis in NAFLD: A meta-analysis. J Hepatol. 2021;74:20–30. [DOI] [PMC free article] [PubMed] [Google Scholar]
- 29. Buch S, Stickel F, Trépo E, Way M, Herrmann A, Nischalke HD, et al. A genome-wide association study confirms PNPLA3 and identifies TM6SF2 and MBOAT7 as risk loci for alcohol-related cirrhosis. Nat Genet. 2015;47:1443–1448. [DOI] [PubMed] [Google Scholar]
- 30. Thabet K, Asimakopoulos A, Shojaei M, Romero-Gomez M, Mangia A, Irving WL, et al. MBOAT7 rs641738 increases risk of liver inflammation and transition to fibrosis in chronic hepatitis C. Nat Commun. 2016;7:12757. [DOI] [PMC free article] [PubMed] [Google Scholar]
- 31. Thabet K, Chan HLY, Petta S, Mangia A, Berg T, Boonstra A, et al. The membrane-bound O-acyltransferase domain-containing 7 variant rs641738 increases inflammation and fibrosis in chronic hepatitis B. Hepatology. 2017;65:1840–1850. [DOI] [PubMed] [Google Scholar]
- 32. Gaziano JM, Concato J, Brophy M, Fiore L, Pyarajan S, Breeling J, et al. Million Veteran Program: A mega-biobank to study genetic influences on health and disease. J Clin Epidemiol. 2016;70:214–223. [DOI] [PubMed] [Google Scholar]
- 33. Serper M, Vujkovic M, Kaplan DE, Carr RM, Lee KM, Shao Q, et al. Validating a non-invasive, ALT-based non-alcoholic fatty liver phenotype in the million veteran program. PLoS One. 2020;15:e0237430. [DOI] [PMC free article] [PubMed] [Google Scholar]
- 34. Boyle AP, Hong EL, Hariharan M, Cheng Y, Schaub MA, Kasowski M, et al. Annotation of functional variation in personal genomes using RegulomeDB. Genome Res. 2012;22:1790–1797. [DOI] [PMC free article] [PubMed] [Google Scholar]
- 35. Gagliano Taliun SA, VandeHaar P, Boughton AP, Welch RP, Taliun D, Schmidt EM, et al. Exploring and visualizing large-scale genetic associations by using PheWeb. Nat Genet. 2020;52:550–552. [DOI] [PMC free article] [PubMed] [Google Scholar]
- 36. LaRue MM, Parker S, Puccini J, Cammer M, Kimmelman AC, Bar-Sagi D. Metabolic reprogramming of tumor-associated macrophages by collagen turnover promotes fibrosis in pancreatic cancer. Proc Natl Acad Sci USA. 2022;119:e2119168119. [DOI] [PMC free article] [PubMed] [Google Scholar]
- 37. Kaplan DE, Dai F, Aytaman A, Baytarian M, Fox R, Hunt K, et al. Development and performance of an algorithm to estimate the Child-Turcotte-Pugh score from a national electronic healthcare database. Clin Gastroenterol Hepatol. 2015;13:2333–2341 e6. [DOI] [PMC free article] [PubMed] [Google Scholar]
- 38. Venables WN, Ripley BD. Modern Applied Statistics With S, 4th ed. Springer; 2002. [Google Scholar]
- 39. Chang CC, Chow CC, Tellier LC, Vattikuti S, Purcell SM, Lee JJ. Second-generation PLINK: Rising to the challenge of larger and richer datasets. Gigascience. 2015;4:7. [DOI] [PMC free article] [PubMed] [Google Scholar]
- 40. Willer CJ, Li Y, Abecasis GR. METAL: Fast and efficient meta-analysis of genomewide association scans. Bioinformatics. 2010;26:2190–2191. [DOI] [PMC free article] [PubMed] [Google Scholar]
- 41. Wang K, Li M, Hakonarson H. ANNOVAR: Functional annotation of genetic variants from high-throughput sequencing data. Nucleic Acids Res. 2010;38:e164. [DOI] [PMC free article] [PubMed] [Google Scholar]
- 42. Kurki MI, Karjalainen J, Palta P, Sipilä TP, Kristiansson K, Donner KM, et al. FinnGen provides genetic insights from a well-phenotyped isolated population. Nature. 2023;613:508–518. [DOI] [PMC free article] [PubMed] [Google Scholar]
- 43. Gorden A, Yang R, Yerges-Armstrong LM, Ryan KA, Speliotes E, Borecki IB, et al. Genetic variation at NCAN locus is associated with inflammation and fibrosis in non-alcoholic fatty liver disease in morbid obesity. Hum Hered. 2013;75:34–43. [DOI] [PMC free article] [PubMed] [Google Scholar]
- 44. Petta S, Valenti L, Marra F, Grimaudo S, Tripodo C, Bugianesi E, et al. MERTK rs4374383 polymorphism affects the severity of fibrosis in non-alcoholic fatty liver disease. J Hepatol. 2016;64:682–690. [DOI] [PubMed] [Google Scholar]
- 45. Chalasani N, Guo X, Loomba R, Goodarzi MO, Haritunians T, Kwon S, et al. Genome-wide association study identifies variants associated with histologic features of nonalcoholic fatty liver disease. Gastroenterology. 2010;139:1567–76; e1–e6. [DOI] [PMC free article] [PubMed] [Google Scholar]
- 46. Feitosa MF, Wojczynski MK, North KE, Zhang Q, Province MA, Carr JJ, et al. The ERLIN1-CHUK-CWF19L1 gene cluster influences liver fat deposition and hepatic inflammation in the NHLBI Family Heart Study. Atherosclerosis. 2013;228:175–180. [DOI] [PMC free article] [PubMed] [Google Scholar]
- 47. Tan HL, Zain SM, Eng HS, Mohamed Z, Mahadeva S, Chan WK, et al. Allele HLA-DQB1*06 reduces fibrosis score in patients with non-alcoholic fatty liver disease. Hepatol Res. 2020;50:947–954. [DOI] [PubMed] [Google Scholar]
- 48. Miele L, Beale G, Patman G, Nobili V, Leathart J, Grieco A, et al. The Kruppel-like factor 6 genotype is associated with fibrosis in nonalcoholic fatty liver disease. Gastroenterology. 2008;135:282–291.e1. [DOI] [PMC free article] [PubMed] [Google Scholar]
- 49. Tirelli C, Pesenti C, Miozzo M, Mondoni M, Fontana L, Centanni S. The genetic and epigenetic footprint in idiopathic pulmonary fibrosis and familial pulmonary fibrosis: A state-of-the-art review. Diagnostics (Basel). 2022;12:3107. [DOI] [PMC free article] [PubMed] [Google Scholar]
- 50. Buch S, Innes H, Lutz PL, Nischalke HD, Marquardt JU, Fischer J, et al. Genetic variation in TERT modifies the risk of hepatocellular carcinoma in alcohol-related cirrhosis: Results from a genome-wide case-control study. Gut. 2023;72:381–91. [DOI] [PMC free article] [PubMed] [Google Scholar]
Associated Data
This section collects any data citations, data availability statements, or supplementary materials included in this article.


