

Abstract
Background and purpose
Primary lateral sclerosis (PLS) is a neurodegenerative disorder that primarily affects the central motor system. In rare cases, clinical features of PLS may overlap with those of progressive supranuclear palsy (PSP). We investigate neuroimaging features that can help distinguish PLS with overlapping features of PSP (PLS‐PSP) from PSP.
Methods
Six patients with PLS‐PSP were enrolled between 2019 and 2023. We compared their clinical and neuroimaging characteristics with 18 PSP–Richardson syndrome (PSP‐RS) patients and 20 healthy controls. Magnetic resonance imaging, 18F‐flortaucipir positron emission tomography (PET), quantitative susceptibility mapping, and diffusion tensor imaging tractography (DTI) were performed to evaluate eight brain regions of interest. Area under the receiver operating characteristic curve (AUROC) was calculated.
Results
Five of the six PLS‐PSP patients (83.3%) were male. Median age at symptom onset was 61.5 (52.5–63) years, and all had mixed features of PLS and PSP. Volumes of the pallidum, caudate, midbrain, and cerebellar dentate were smaller in PSP‐RS than PLS‐PSP, providing good discrimination (AUROC = 0.75 for all). The susceptibilities in pallidum, midbrain, and cerebellar dentate were greater in PSP‐RS compared to PLS‐PSP, providing excellent discrimination (AUROC ≥ 0.90 for all). On DTI, fractional anisotropy (FA) in the posterior limb of the internal capsule from the corticospinal tract was lower in PLS‐PSP compared to PSP‐RS (AUROC = 0.86), but FA in the superior cerebellar peduncle was lower in PSP‐RS (AUROC = 0.95). Pallidum flortaucipir PET uptake was greater in PSP‐RS compared to PLS‐PSP (AUROC = 0.74).
Conclusions
Regional brain volume, tractography, and magnetic susceptibility, but not tau‐PET, are useful in distinguishing PLS‐PSP from PSP.
Keywords: neurodegenerative disorders, primary lateral sclerosis, progressive supranuclear palsy, quantitative susceptibility mapping, tractography
INTRODUCTION
Primary lateral sclerosis (PLS) is a slowly progressive neurodegenerative disorder that primarily affects the central motor system [1]. Patients with PLS present with symptoms and signs of upper motor neuron dysfunction, which can affect the lower or upper extremities, and/or corticobulbar dysfunction [1]. The clinical presentation of PLS can overlap with other neurological disorders, which makes clinically differentiating it from these conditions challenging [1, 2, 3]. Notably, progressive supranuclear palsy (PSP) is one of the conditions with which PLS might share features early in PLS disease course [2]. The core clinical features of PSP are defined as ocular motor dysfunction, postural instability, akinesia, and subcortical cognitive dysfunction [4]. Routine neuroimaging evaluations, as well as postmortem studies, have shown that in classic forms of PLS there are motor cortex involvement and white matter tract degeneration of the corticospinal tract (CST) [1, 5]. In PSP, there is atrophy of the midbrain with white matter tract degeneration of the dentatorubrothalamic tract, including the superior cerebellar peduncle (SCP) [6, 7, 8, 9]. Patients with PSP also show increased susceptibility on quantitative susceptibility mapping (QSM) in pallidum, substantia nigra, red nucleus, and cerebellar dentate, and increased 18F‐flortaucipir uptake on positron emission tomography (PET) in striatum, globus pallidus, and thalamus [10, 11]. In rare cases whereby clinical features of PLS overlap with PSP, classic neuroimaging characteristics are not useful in distinguishing these conditions from each other [2].
The gold standard for differentiating PLS from PSP is with neuropathological evaluation. PLS is most often associated with transactive response DNA‐binding protein of 43 kDa (TDP‐43), whereas PSP is most often associated with 4‐repeat (4R) tau [12, 13]; both syndromes have also been infrequently associated with other rare pathologies such as globular glial tauopathy [14] and neuronal intermediate filament inclusion disease [15]. However, neuropathological evaluations can only be conducted postmortem. In a previous study, our group reported three patients with features of PLS and PSP (PLS‐PSP) and demonstrated on diffusion tensor imaging (DTI) that the CST was involved to a greater degree in PLS‐PSP [2].
In this present study, we aimed to describe the clinical features of six new patients with PLS‐PSP and investigate whether advanced neuroimaging techniques, including flortaucipir PET, QSM, and DTI tractography may further aid clinicians to differentiate PLS‐PSP from PSP. We hypothesized that regional differences in motor cortex, CST, and brainstem–cerebellar pathways would be able to differentiate PLS‐PSP from PSP.
MATERIALS AND METHODS
Patient recruitment
The Neurodegenerative Research Group (NRG) at Mayo Clinic in Minnesota enrolled and prospectively followed six patients who met the diagnostic criteria for PLS [1, 16] but also exhibited overlapping features with PSP (PLS‐PSP), between July 2019 and November 2023. To compare PLS‐PSP to PSP, we matched (3:1) 18 patients with classic PSP–Richardson syndrome (PSP‐RS) [4] for age, as well as compared both PLS‐PSP and PSP‐RS to 20 healthy controls. Patients with PSP‐RS were chosen from a group of 200 individuals diagnosed with possible or probable PSP, who had been enrolled and followed by the NRG from September 2009 until September 2023. Two neurologists who are experts in PSP (K.A.J. and F.A.) utilized the Movement Disorders Society (MDS)‐PSP diagnostic criteria to make the PSP diagnosis prospectively or retrospectively [4].
The study received approval from the Mayo Clinic Institutional Review Board, and informed consent was obtained from all participants.
Clinical evaluations
Demographics and clinical characteristics of all 44 participants were collected. The Montreal Cognitive Assessment (MoCA) was used to assess cognitive abilities [17]. The Cambridge Behavioral Inventory was employed to assess cognitive and behavioral control [18]. Frontal executive function was assessed using the Frontal Assessment Battery [18]. The Boston Naming Test was employed to assess visual confrontation naming [18]. The PSP Saccadic Impairment Scale (PSIS) was employed to assess abnormalities in ocular movement [6]. Disease severity was assessed with the Progressive Supranuclear Palsy Rating Scale in conjunction with its gait/midline subscale (G/M), which is focused on the assessment of impairments in gait and posture [19]. For evaluation of nonmotor experiences of daily living, the MDS‐sponsored revision of the Unified Parkinson's Disease Rating Scale (MDS‐UPDRS) part I was employed [20]. Motor experiences of daily living and motor severity were assessed using MDS‐UPDRS II and III, respectively [20].
Image acquisition
All participants completed a standardized magnetic resonance imaging (MRI) protocol using a 3.0‐T scanner (Magnetom Prisma, Siemens Healthineers). This protocol includes a magnetization prepared rapid gradient echo (MPRAGE) sequence (repetition time [TR] = 2300 ms, echo time [TE] = 3 ms, T1 = 945 ms, flip angle = 9°, 0.8 mm isotropic resolution), a three‐dimensional (3D) multiecho gradient echo sequence [10, 21] (TR = 28.0 ms, TE = 6.7, 10.6, 14.5, 18.4, and 22.4 ms, flip angle = 15°, field of view = 20 cm, in‐plane acquisition matrix = 384 × 269, slice number = 88; slice thickness = 1.8 mm, parallel imaging acceleration factor = 2), and a diffusion‐weighted MRI (dMRI) sequence based on a spin‐echo single shot echo planar imaging arrangement (TE = 71 ms, TR = 3400 ms, multishell set of four diffusion‐weighted values: b = 0, b = 500 s/mm2, b = 1000 s/mm2, and b = 2000 s/mm2, number of diffusion sampling directions = 6, 48, and 60, in‐plane resolution and slice thickness = 2 mm and resampled to 0.5 mm). All flortaucipir PET scans were obtained with a PET/computed tomography scanner. For flortaucipir PET, an intravenous bolus injection of approximately 370 MBq (range = 333–407 MBq) of 18F‐flortaucipir was administered to the patient and a 20‐min PET scan was acquired 80 minutes after the injection. All emission data for this study were reconstructed into a 256 × 256 matrix with 30‐cm field of view (pixel size = 1.0 mm, slice thickness = 1.96 mm).
Image analysis
Volumes and flortaucipir PET
The MRI gray matter volumes and flortaucipir uptake utilized in this study were measured for the following eight regions of interest (ROIs): superior frontal cortex, precentral cortex, globus pallidum, putamen, caudate, and thalamus using the Mayo Clinic Adult Lifespan Template atlas, and midbrain and cerebellar dentate with measurements determined using an atlas developed in‐house. These regions were selected given that they demonstrate atrophy and uptake on flortaucipir PET in patients with PSP [22], whereas the precentral cortex is linked to PLS [23]. The flortaucipir images were then coregistered to the MPRAGE images using 6 degrees of freedom registration in SPM12, the MPRAGE scans were segmented, and the atlases were propagated to MPRAGE space. For the flortaucipir PET, the regional uptake values in both the gray and white matter were divided by the uptake in the cerebellar crus gray matter, which was then used to calculate the standard uptake value ratios (SUVRs). All regional volumes were adjusted for total intracranial volume to account for the patients' head size.
Quantitative susceptibility mapping
To assess iron uptake, QSM images were reconstructed from the 3D multiecho gradient echo sequence using MATLAB and STI suite as previously described [24, 25]. The reconstructed QSM images were rigidly registered to the MPRAGE to apply brain atlases [24]. To calculate regional QSM values for the eight ROIs, we averaged the susceptibilities in the summed region of the gray and white matter masks in each ROI on the left and right sides [10]. Midbrain susceptibility was calculated using the average of the susceptibilities in the red nucleus and substantia nigra.
MRI tractography
The dMRI images were corrected for head motion, Eddy current, and susceptibility artifact distortions using standard algorithms [26]. The b‐table was proven by an automatic quality control routine to ensure accuracy [27]. Reliability of the diffusion files was checked by incorporated algorithms [28]. A DTI model was applied to each scan, and fractional anisotropy (FA) was estimated. White matter fiber reconstructions were shaped by a topographical anatomical atlas embedded in the DSI software (https://dsi‐studio.labsolver.org/). Anisotropy, angular threshold, and step size were automatically selected. Regions where FA was <0.2 were automatically removed. Whole‐brain deterministic fiber tracking algorithms with augmented tracking strategies to improve reproducibility were calculated [29]. Our evaluation was focused on two tracts: the SCP and the posterior limb of the internal capsule (PLIC) from the CST. An anatomical tractography atlas was applied to map the CST and the SCP, and seeding regions were placed using preestablished white matter probabilistic areas [2, 30]. To identify the PLIC, 5 million seeds were centered in the PLIC and bounded between 2 mm above and below the PLIC region (Figure 1). Finally, a distance voxel tolerance of 16 mm was applied, and distorted tract or false connections were automatically removed using a topology‐informed pruning algorithm [28]. FA was calculated for each tract.
FIGURE 1.
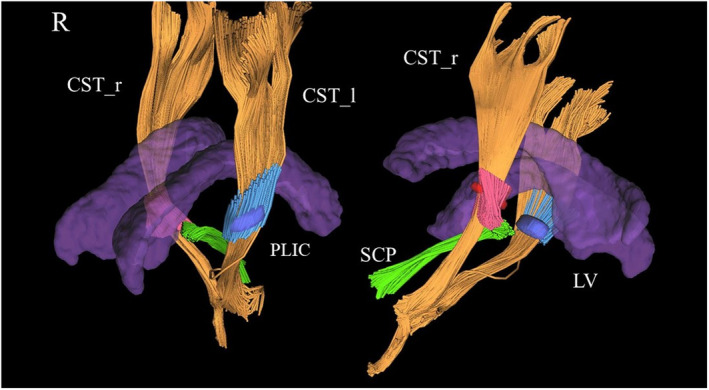
Partial tractography reconstructions from diffusion tensor imaging techniques. The corticospinal tracts (CSTs) in yellow were partially reconstructed and centered in a region representing the right (red) and left (blue) posterior limb of the internal capsule (PLIC). The superior cerebellar peduncle (SCP) was also reconstructed (green). The lateral ventricular system (LV) is represented as a topographical reference (purple). CST_l, left CST; CST_r, right CST; R, right.
Statistical analysis
We reported findings as median (first and third quartiles), and frequency (percent), where appropriate. Kruskal–Wallis test, Mann–Whitney U‐test, and chi‐squared test of independence/Fisher exact test were used to compare median and frequency between groups. Comparisons of neuroimaging data across three groups were adjusted for age and sex using linear regression. We considered a p‐value < 0.05 as statistically significant. To minimize the impact of sample size, area under the receiver operating characteristic curve (AUROC) was calculated as an effect size measure using logistic regression analysis. We did not adjust for multiple comparisons, as each imaging modality is independent with at most eight ROIs. All analyses used R statistical software version 4.3.2.
RESULTS
Demographics and general clinical characteristics
Demographics, clinical characteristics, and the results of neuropsychological tests are presented in Table 1. For PLS‐PSP, 83.3% of the patients were male, with a median age at symptom onset of 61.5 years (IQ1,IQ3 = 52.5,63). Patients with PLS‐PSP had a median score of 26 (IQ1,IQ3 = 23.75,26) on MoCA indicating preserved cognition, and a median score of 0.5 (IQ1,IQ3 = 0,1.75) on PSIS indicating normal/mildly impaired oculomotor saccades. Three of the six patients with PLS‐PSP exhibited spastic dysarthria, and all six had upper motor neuron signs at presentation. In the PSP‐RS group, 37.5% (6/16) had spastic dysarthria, and 33.3% (4/12) exhibited at least one upper motor neuron sign. Among the patients with PLS‐PSP, one underwent autopsy, which revealed the presence of TDP‐43 proteinopathy (Case 3).
TABLE 1.
Demographic and clinical characteristics of the PLS‐PSP, PSP‐RS, and control participants.
| Variables | PLS‐PSP, n = 6 | PSP‐RS, n = 18 | Controls, n = 20 | p |
|---|---|---|---|---|
| Gender, M | 5 (83.3%) | 9 (50%) | 6 (30%) | 0.06 |
| Education | 12 (12,14) | 14 (12,17.5) | 16 (16,16) | 0.03 |
| Age at onset | 61.5 (52.5,63) | 62 (59,65) | N/A | 0.34 |
| Age at encounter | 63.65 (56.05,65.62) | 68.30 (64.92,69.40) | 66.15 (62.57,67.12) | 0.09 |
| Time from onset to first neurological evaluation, years | 2.7 (1.6,5.1) | 3.9 (2.95,6.5) | N/A | 0.15 |
| MoCA | 26 (23.75,26) | 24 (16.5,26) | 28 (26.75,29) | 0.0006 |
| MDS‐UPDRS I | 20 (11.5,20) | 15 (6.5,20.25) | 0 (0,1) | 0.0001 |
| MDS‐UPDRS II | 21 (19,23) | 26.5 (13.75,29.25) | 0 (0,0) | <0.0001 |
| MDS‐UPDRS III | 26 (24.5,32.75) | 37.5 (30.25,59) | 2 (1,4) | <0.0001 |
| PSPRS | 32.5 (24.5,33.75) | 37.5 (31.25,49.75) | N/A | 0.07 |
| PSPRS‐G/M | 8.5 (4.75,12.25) | 13 (9.25,14.75) | N/A | 0.19 |
| PSIS | 0.5 (0,1.75) | 3 (3,4) | 0 (0,0) | <0.0001 |
| FAB | 17 (16,17) | 14 (9,15.75) | N/A | 0.02 |
| CBI | 20.5 (19.75,21.25) | 23 (18,55) | 3 (1,5) | <0.0001 |
| BNT | 13 (12,14) | 13 (12,14) | N/A | 0.60 |
| ApoE [presence of allele 4] | 1 (16.6%) | 5 (27.7%) | N/A | 0.99 |
| Spastic component in dysarthria | 3 (50%) | 6 (33.3%) | N/A | 0.08 |
| Upper motor neuron signs | 6 (100%) | 4 (22.2%) | N/A | 0.01 |
Note: Values are reported as median (first and third quartile) and frequency (percent) where appropriate. Probability values were calculated using Kruskal–Wallis test for three group comparisons and Mann–Whitney U‐test for two group comparisons. Chi‐squared test of independence or Fisher exact test was used for variables reported as frequency (percent).
Abbreviations: ApoE, apolipoprotein E; BNT, Boston Naming Test; CBI, Cambridge Behavioral Inventory; FAB, Frontal Assessment Battery; M, Male; MDS‐UPDRS, Movement Disorders Society‐sponsored revision of the Unified Parkinson's Disease Rating Scale; MoCA, Montreal Cognitive Assessment; N/A, not applicable; PLS, primary lateral sclerosis; PSIS, PSP Saccadic Impairment Scale; PSP, progressive supranuclear palsy; PSPRS, Progressive Supranuclear Palsy Rating Scale; PSPRS‐G/M, PSPRS–gait/midlines; RS, Richardson syndrome.
Summary of clinical characteristics of patients with PLS‐PSP during their first neurological evaluation
Case 1: A 49‐year‐old right‐handed woman presented with symptoms that had begun 6 years earlier with progressive speech difficulty, characterized by dragging out certain vowels. Over the years, she developed impairment of motor skills, imbalance, gagging, choking episodes, occasional involuntary movements of her face, urinary incontinence, and mild behavioral and personality changes. On neurological examination, her gait was slightly abnormal, and she stepped slightly high. She exhibited a vertical supranuclear gaze palsy and had a harsh speech. She had mildly brisk jaw reflex, and deep tendon reflexes were brisk throughout especially in the left lower extremity. She had mild rigidity in both the upper and lower extremities and exhibited moderate spasticity in the left lower extremity.
Case 2: A 65‐year‐old left‐handed man presented complaining of symptoms that had started 18 months earlier with difficulty with walking and arising from a seated position, imbalance, whole body stiffness, and personality and behavioral changes. Furthermore, he developed memory impairment, executive dysfunction, changes in handwriting, and choking episodes. On neurological examination, he exhibited a slightly wide‐based and unsteady gait, with characteristics of a spastic‐type gait. On the pull test, he took 8–10 steps backward. His vertical extraocular movements were slow, and saccadic eye movements were impaired. He exhibited some axial rigidity and mild spasticity in the right upper extremity. In the lower extremities, his reflexes were brisk, with a slight predominance on the right. Sustained clonus on the right side and some degree of clonus on the left side were observed.
Case 3: A 65‐year‐old left‐handed man presented for enrollment in a study on PSP. His symptoms had started 5 years earlier with frequent falls and imbalance. Furthermore, he developed calf muscle cramps and tightness, and his speech became affected. He reported left foot toe curling, slowness in the movements of the left upper and lower extremities associated with freezing, muscle twitching in the left arm, and festination. On neurological examination, he had spastic dysarthria and occasional spasmodic dysphonia. His extraocular movements were essentially normal, and he had mild facial hypomimia. During the motor examination, he exhibited a spastic tone throughout his body, more pronounced on the left side. He had a stiff gait and a spastic left leg that was held extended. He exhibited very brisk reflexes, including bilateral Hoffmann sign and bilateral extensor plantar responses. Pathologically brisk deep tendon reflexes throughout his body were observed. Rapid alternating movements were slow, and he displayed postural instability.
Case 4: A 54‐year‐old left‐handed man presented for enrollment in a study on PSP. His symptoms had started 3.5 years earlier with progressive changes in his speech, notably softer speech, and imbalance. He reported tremulous movements of the right leg and finger movements, where he would rub his thumb and index finger together, as well as changes in his handwriting. Furthermore, he began to experience falls, postural instability, and freezing episodes, and was unable to drive or work. He developed cognitive impairment, a tendency for excessive laughter, occasional apathy, and slowed thinking. On neurological examination, arising from a seated position was difficult, and he had a positive pull test. Gait was slow, arm swing was reduced on the right, and he had instability mainly at turns. A mild slowing of vertical saccades was observed, with the amplitude remaining normal. He exhibited slightly increased axial rigidity. His reflexes were slightly brisk, particularly in the lower extremities, with a Babinski sign on the left.
Case 5: A 62‐year‐old right‐handed man presented complaining of symptoms that had begun 2 years earlier, with progressive weakness in the right upper and lower extremities. Furthermore, he developed speech difficulties, limping, stiffness in the right leg, and falls. On neurological examination, he had difficulty with naming tasks. His extraocular movements were slow but relatively preserved. Muscle strength weakness in an upper motor neuron pattern in both upper and lower extremities was observed. He exhibited slowness in performing rapid alternating movements and had moderate bilateral spasticity. His reflexes were brisk in upper and lower extremities, particularly in the lower extremities, with sustained clonus in right and left lower extremities. He exhibited a wide‐based slightly ataxic gait. When walking with a walker, both legs appeared stiff and the right leg was slightly spastic. He was unable to arise from a seated position without pushing himself up. He had mild apraxia of speech, of the phonetic subtype.
Case 6: A 64‐year‐old right‐handed man presented complaining of symptoms that had begun 9 months earlier with speech difficulties and voice changes. He reported difficulty with movements of his left side, tightness and spasm, and postural instability leading to frequent falls and had urinary urgency with occasional incontinence. On neurological examination, apraxia of speech with mild hypophonia was observed. He had increased latency of saccadic eye movements that were both hypometric and hypokinetic. His upgaze was restricted and had vertical slowing. He exhibited spasticity in the upper and lower limbs on the left side, and brisk reflexes with pathological hyperreflexia were observed throughout, more pronounced on the left side. His gait was characterized by spasticity primarily in the left leg, with limited knee flexion and an absent heel strike. His left arm exhibited significantly reduced swing. Rapid alternating movements were slow on the left side.
Fluorodeoxyglucose PET scan showed hypometabolism in the motor cortex in four of six patients (Figure 2).
FIGURE 2.
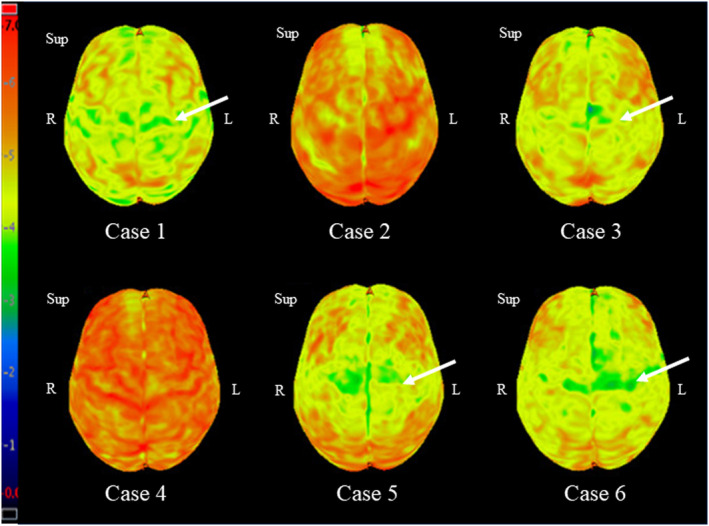
Fluorodeoxyglucose positron emission tomography scan of patients with primary lateral sclerosis with overlapping features of progressive supranuclear palsy. L, left; R, right; Sup, superior.
Neuroimaging studies
Comparison of total intracranial volume‐corrected MRI regional brain volumes among the three groups revealed statistically significant differences in all brain regions except the superior frontal cortex (all p < 0.05; Table 2). The PLS‐PSP group showed smaller volumes of precentral cortex, putamen, and midbrain compared to controls, with good (0.70–0.80) to excellent (0.80+) discrimination based on AUROCs (Table 3). The PSP‐RS group also showed smaller volumes of these regions, plus the pallidum, caudate, thalamus, and cerebellar dentate, compared to controls, with outstanding AUROCs (0.90+) observed for pallidum, midbrain, and cerebellar dentate. Smaller volumes of the pallidum, caudate, midbrain, and cerebellar dentate provided good discrimination of PSP‐RS from PLS‐PSP (Table 3). The flortaucipir SUVRs showed statistically significant differences among the three groups in the pallidum (p = 0.002), putamen (0.036), and cerebellar dentate (p = 0.050; Table 2), with greatest uptake observed in PSP‐RS. Pallidum SUVR was able to differentiate PSP‐RS from PLS‐PSP with an AUROC of 0.74 (Table 3).
TABLE 2.
TIV‐corrected magnetic resonance imaging regional brain volumes, regional flortaucipir SUVR, susceptibilities, and white matter tract fractional anisotropy in patients with PLS‐PSP and PSP‐RS and controls.
| Brain region | PLS‐PSP | PSP‐RS | Controls | p |
|---|---|---|---|---|
| TIV‐corrected regional brain volumes | ||||
| Sup frontal cortex | 0.54 (0.49, 0.54) | 0.54 (0.47, 0.58) | 0.57 (0.54, 0.63) | 0.110 |
| Precentral cortex | 0.53 (0.50, 0.65) | 0.61 (0.54, 0.64) | 0.66 (0.63, 0.71) | 0.026 |
| Pallidum | 0.08 (0.08, 0.10) | 0.08 (0.07, 0.08) | 0.10 (0.09, 0.10) | <0.001 |
| Putamen | 0.25 (0.24, 0.25) | 0.23 (0.23, 0.25) | 0.27 (0.25, 0.29) | 0.001 |
| Caudate | 0.21 (0.20, 0.24) | 0.18 (0.17, 0.20) | 0.21 (0.21, 0.23) | <0.001 |
| Thalamus | 0.17 (0.16, 0.20) | 0.18 (0.16, 0.19) | 0.20 (0.19, 0.21) | 0.048 |
| Midbrain | 0.55 (0.53, 0.56) | 0.46 (0.43, 0.54) | 0.59 (0.56, 0.64) | <0.0001 |
| Cerebellar dentate | 0.07 (0.06, 0.07) | 0.06 (0.05, 0.06) | 0.08 (0.07, 0.08) | <0.0001 |
| Regional flortaucipir SUVR | ||||
| Sup frontal cortex | 1.09 (1.03, 1.17) | 1.13 (1.06, 1.20) | 1.11 (1.05, 1.19) | 0.571 |
| Precentral cortex | 1.17 (1.08, 1.19) | 1.10 (1.04, 1.12) | 1.09 (1.01, 1.15) | 0.165 |
| Pallidum | 1.52 (1.36, 1.85) | 1.85 (1.62, 2.07) | 1.54 (1.41, 1.65) | 0.002 |
| Putamen | 1.36 (1.21, 1.47) | 1.46 (1.30, 1.59) | 1.35 (1.25, 1.47) | 0.036 |
| Caudate | 1.08 (1.01, 1.19) | 1.22 (1.08, 1.32) | 1.16 (1.08, 1.26) | 0.233 |
| Thalamus | 1.28 (1.12, 1.36) | 1.28 (1.22, 1.38) | 1.23 (1.11, 1.31) | 0.102 |
| Midbrain | 1.21 (1.15, 1.28) | 1.23 (1.11, 1.31) | 1.19 (1.11, 1.24) | 0.144 |
| Cerebellar dentate | 1.23 (1.08, 1.38) | 1.35 (1.22, 1.42) | 1.22 (1.14, 1.31) | 0.050 |
| Susceptibilities | ||||
| Sup frontal cortex | 0.001 (−0.001, 0.003) | 0.002 (0.001, 0.002) | 0.001 (0.00003, 0.002) | 0.687 |
| Precentral cortex | 0.005 (0.001, 0.007) | 0.003 (0.003, 0.004) | 0.002 (0.001, 0.003) | 0.012 |
| Pallidum | 0.09 (0.08, 0.10) | 0.13 (0.12, 0.16) | 0.09 (0.08, 0.09) | <0.0001 |
| Putamen | 0.02 (0.01, 0.02) | 0.02 (0.02, 0.03) | 0.02 (0.01, 0.02) | 0.332 |
| Caudate | 0.02 (0.02, 0.02) | 0.03 (0.02, 0.04) | 0.02 (0.02, 0.03) | 0.204 |
| Thalamus | −0.002 (−0.002, −0.002) | −0.003 (−0.005, −0.001) | −0.001 (−0.003, −0.0001) | 0.465 |
| Midbrain | 0.09 (0.08, 0.11) | 0.14 (0.12, 0.17) | 0.08 (0.07, 0.09) | <0.0001 |
| Cerebellar dentate | 0.02 (0.01, 0.03) | 0.08 (0.06, 0.09) | 0.03 (0.02, 0.05) | <0.001 |
| Fractional anisotropy | ||||
| PLIC | 0.59 (0.56, 0.60) | 0.65 (0.61, 0.66) | 0.64 (0.62, 0.68) | 0.015 |
| SCP | 0.42 (0.41, 0.42) | 0.39 (0.37, 0.39) | 0.44 (0.42, 0.45) | <0.0001 |
Note: Values are reported as median (first and third quartile). Probability values were calculated using linear regression with age at encounter and sex as covariates.
Abbreviations: PLIC, posterior limb of the internal capsule from the corticospinal tract; PLS, primary lateral sclerosis; PSP, progressive supranuclear palsy; RS, Richardson syndrome; SCP, superior cerebellar peduncle; Sup, superior; SUVR, standard uptake value ratio; TIV, total intracranial volume.
TABLE 3.
Area under the receiver operating characteristic curve values comparing MRI regional brain volumes, regional flortaucipir SUVR, susceptibility, and fractional anisotropy for two group comparisons.
| Brain region | PLS‐PSP vs. controls (reference) | PSP‐RS vs. controls (reference) | PLS‐PSP vs. PSP‐RS (reference) |
|---|---|---|---|
| MRI brain volumes | |||
| Sup frontal cortex | 0.69 | 0.65 | 0.50 |
| Precentral cortex | 0.77 | 0.75 | 0.56 |
| Pallidum | 0.71 | 0.90 | 0.75 |
| Putamen | 0.85 | 0.79 | 0.64 |
| Caudate | 0.55 | 0.82 | 0.75 |
| Thalamus | 0.69 | 0.74 | 0.50 |
| Midbrain | 0.79 | 0.90 | 0.75 |
| Cerebellar dentate | 0.71 | 0.91 | 0.75 |
| Flortaucipir SUVR | |||
| Sup frontal cortex | 0.55 | 0.51 | 0.54 |
| Precentral cortex | 0.69 | 0.50 | 0.66 |
| Pallidum | 0.54 | 0.81 | 0.74 |
| Putamen | 0.54 | 0.66 | 0.67 |
| Caudate | 0.64 | 0.59 | 0.71 |
| Thalamus | 0.57 | 0.63 | 0.58 |
| Midbrain | 0.62 | 0.59 | 0.50 |
| Cerebellar dentate | 0.52 | 0.70 | 0.62 |
| Susceptibility | |||
| Sup frontal cortex | 0.5 | 0.60 | 0.57 |
| Precentral cortex | 0.64 | 0.81 | 0.55 |
| Pallidum | 0.57 | 0.94 | 0.90 |
| Putamen | 0.53 | 0.69 | 0.67 |
| Caudate | 0.62 | 0.67 | 0.70 |
| Thalamus | 0.53 | 0.59 | 0.65 |
| Midbrain | 0.61 | 0.98 | 0.95 |
| Cerebellar dentate | 0.73 | 0.88 | 0.97 |
| Fractional anisotropy | |||
| PLIC | 0.90 | 0.56 | 0.86 |
| SCP | 0.75 | 0.97 | 0.95 |
Abbreviations: MRI, magnetic resonance imaging; PLIC, posterior limb of the internal capsule from the corticospinal tract; PLS, primary lateral sclerosis; PSP, progressive supranuclear palsy; RS, Richardson syndrome; SCP, superior cerebellar peduncle; Sup, superior; SUVR, standard uptake value ratio.
On QSM, comparison of susceptibilities between the three groups revealed statistically significant differences in precentral cortex (p = 0.012), pallidum (p < 0.001), midbrain (p < 0.001), and cerebellar dentate (p < 0.001). The susceptibilities in pallidum (AUROC = 0.90), midbrain (AUROC = 0.95), and cerebellar dentate (AUROC = 0.97) were greater in PSP‐RS compared to PLS‐PSP (Table 3). Individual QSM maps from example PSP‐RS and PLS‐PSP patients illustrating greater susceptibility in these three regions in PSP‐RS are shown in Figure 3.
FIGURE 3.
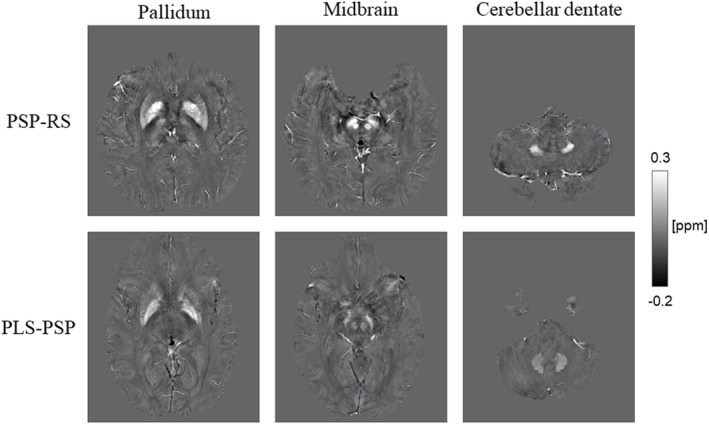
Quantitative susceptibility mapping images of representative progressive supranuclear palsy (PSP)–Richardson syndrome (PSP‐RS) and primary lateral sclerosis (PLS)‐PSP patients. The PSP‐RS patient has greater susceptibility signals than the PLS‐PSP patient in the pallidum, substantia nigra, red nucleus, and cerebellar dentate.
On DTI, comparison of FA between the three groups showed statistically significant differences in PLIC (p = 0.015) and SCP (p < 0.0001; Table 2). FA in PLIC was greater in PSP‐RS than PLS‐PSP (AUROC = 0.86), but FA in SCP was greater in PLS‐PSP than PSP‐RS (AUROC = 0.95; Table 3).
DISCUSSION
We presented the clinical and neuroimaging characteristics of six patients with PLS‐PSP and compared their features to patients with PSP‐RS and healthy controls. We identified neuroimaging features that were effective in differentiating PLS‐PSP from PSP‐RS.
Some of the clinical characteristics commonly shared between PLS and PSP include age of onset in the 60s, bulbar symptoms, symptoms of upper motor neuron disease, and extraocular abnormalities in the vertical plane [1, 2, 4]. Among our patients with PLS‐PSP, one exhibited supranuclear gaze palsy, and four showed some abnormalities in their extraocular movements. Moreover, although cognition is typically preserved in the early phase of PLS, patients may develop cognitive and behavioral abnormalities as the condition progresses, rendering it more similar to PSP [31]. In our study, four of six patients with PLS‐PSP developed some form of cognitive dysfunction or behavioral abnormalities over the course of their disease. Moreover, three fulfilled the MDS‐PSP diagnostic criteria [4] for possible or probable PSP‐RS, two fulfilled the diagnostic criteria for possible or suggestive of PSP–ocular motor dysfunction, and one fulfilled the diagnostic criteria for PSP–postural instability.
Regarding neuroimaging studies, we found that volumes of the pallidum, caudate, midbrain, and cerebellar dentate provided good differentiation of PLS‐PSP from PSP‐RS, with greater involvement of these regions in PSP‐RS. Interestingly, the two groups did not significantly differ in volume of the precentral cortex. Moreover, employing tractography, we observed greater degeneration of the PLIC component of the CST in PLS‐PSP compared to PSP‐RS, with PLIC FA providing excellent discrimination of these diseases. These findings concur with previous reports of CST involvement in PLS and in the few reported patients with PLS‐PSP [2, 5, 32]. Degeneration of the SCP is a characteristic feature of PSP‐RS and was observed in both PSP‐RS and PLS‐PSP, although to a greater extent in PSP‐RS. It is likely that the simultaneous and significant involvement of both the CST and SCP in a patient may lead to overlapping presentations between the two conditions [2, 32]. Hence, in these regions, FA, which serves as an indicator of microstructural integrity and is highly sensitive to microstructural alterations, can help to differentiate the two conditions from each other.
We found that QSM susceptibility in pallidum, midbrain, and cerebellar dentate was also highly effective in distinguishing PLS‐PSP from PSP‐RS, with greater abnormalities in these regions observed in PSP‐RS. QSM reflects the molecular composition and cellular architecture of the tissue and assesses iron deposition and blood byproducts [33]. In a recent study, we found that patients with PSP‐RS have greater susceptibility than healthy controls in the pallidum, substantia nigra, red nucleus, and cerebellar dentate [10]. Susceptibility in the motor cortex is reported to be greater in patients with PLS compared to healthy controls [34]. The PLS‐PSP patients in our cohort did have the greatest precentral susceptibilities, but this region did not perform well to differentiate PLS‐PSP from controls or PSP‐RS.
Pallidum, putamen, and cerebellar dentate showed differences across groups in flortaucipir PET, with PSP‐RS having the greatest uptake. Flortaucipir uptake in the pallidum has been shown to provide the best differentiation of PSP‐RS from other parkinsonian disorders in previous studies [35, 36]. However, we have shown that flortaucipir uptake in this region in PSP is partially explained by susceptibility, which may suggest that some of the signal reflects off‐target binding to iron [24]. Furthermore, pallidum flortaucipir uptake did not perform as well as QSM in differentiating PSP‐RS from PLS‐PSP, suggesting QSM would be a better biomarker in this regard.
To the best of our knowledge, this is the first study to report comprehensive neuroimaging characteristics of patients with overlapping features of PLS and PSP. A limitation to the present study is that only one patient has died with an autopsy confirming TDP‐43 pathology. Consequently, there is a possibility that some of the other five PLS‐PSP patients might have a different pathology, including a 4R tau such as globular glial tauopathy, instead of TDP‐43 [14]. Second, due to the rarity of PLS‐PSP, our study population was limited to only six patients over the 4‐year period.
CONCLUSIONS
In rare instances, PLS can present with overlapping features of PSP, and clinical characteristics alone might not be sufficient to differentiate between the two conditions early in the disease course. DTI tractography and QSM were the most clinically useful neuroimaging modalities to distinguish the two conditions, with SCP degeneration and increased susceptibility in pallidum, midbrain, and cerebellar dentate suggesting PSP‐RS, whereas degeneration of the CST suggests PLS‐PSP.
AUTHOR CONTRIBUTIONS
Negin Badihian: Investigation; writing – original draft; writing – review and editing; formal analysis; data curation; methodology; visualization; software; project administration; validation. Rodolfo G. Gatto: Investigation; methodology; validation; visualization; writing – review and editing; software; formal analysis; project administration; data curation. Ryota Satoh: Investigation; methodology; validation; visualization; writing – review and editing; software; formal analysis; project administration; data curation; writing – original draft. Farwa Ali: Data curation; supervision; project administration; writing – review and editing; visualization; validation; methodology; investigation. Heather M. Clark: Investigation; methodology; validation; visualization; writing – review and editing; data curation; supervision; project administration. Nha Trang Thu Pham: Software; methodology; visualization; validation; data curation; investigation. Jennifer L. Whitwell: Conceptualization; investigation; funding acquisition; writing – original draft; methodology; validation; visualization; writing – review and editing; software; formal analysis; project administration; data curation; supervision; resources. Keith A. Josephs: Conceptualization; investigation; funding acquisition; writing – original draft; methodology; validation; visualization; writing – review and editing; software; formal analysis; project administration; data curation; supervision; resources.
CONFLICT OF INTEREST STATEMENT
The authors declare no conflicts of interest.
ACKNOWLEDGMENTS
This study was funded by National Institutes of Health grant R01‐NS89757 (principal investigators K.A.J./J.L.W.).
Badihian N, Gatto RG, Satoh R, et al. Clinical and neuroimaging characteristics of primary lateral sclerosis with overlapping features of progressive supranuclear palsy. Eur J Neurol. 2024;31:e16320. doi: 10.1111/ene.16320
DATA AVAILABILITY STATEMENT
The data that support the findings of this study are available from the corresponding author upon reasonable request.
REFERENCES
- 1. Turner MR, Barohn RJ, Corcia P, et al. Primary lateral sclerosis: consensus diagnostic criteria. J Neurol Neurosurg Psychiatry. 2020;91(4):373‐377. doi: 10.1136/jnnp-2019-322,541 [DOI] [PMC free article] [PubMed] [Google Scholar]
- 2. Coon EA, Whitwell JL, Jack CR Jr, Josephs KA. Primary lateral sclerosis as progressive supranuclear palsy: diagnosis by diffusion tensor imaging. Mov Disord. 2012;27(7):903‐906. doi: 10.1002/mds.24990 [DOI] [PMC free article] [PubMed] [Google Scholar]
- 3. Vacchiano V, Bonan L, Liguori R, Rizzo G. Primary lateral sclerosis: an overview. J Clin Med. 2024;13(2):578. doi: 10.3390/jcm13020578 [DOI] [PMC free article] [PubMed] [Google Scholar]
- 4. Höglinger GU, Respondek G, Stamelou M, et al. Clinical diagnosis of progressive supranuclear palsy: the movement disorder society criteria. Mov Disord. 2017;32(6):853‐864. doi: 10.1002/mds.26987 [DOI] [PMC free article] [PubMed] [Google Scholar]
- 5. Iwata NK, Kwan JY, Danielian LE, et al. White matter alterations differ in primary lateral sclerosis and amyotrophic lateral sclerosis. Brain. 2011;134(Pt 9):2642‐2655. doi: 10.1093/brain/awr178 [DOI] [PMC free article] [PubMed] [Google Scholar]
- 6. Whitwell JL, Master AV, Avula R, et al. Clinical correlates of white matter tract degeneration in progressive Supranuclear palsy. Arch Neurol. 2011;68(6):753‐760. doi: 10.1001/archneurol.2011.107 [DOI] [PMC free article] [PubMed] [Google Scholar]
- 7. Whitwell JL, Avula R, Master A, et al. Disrupted thalamocortical connectivity in PSP: a resting‐state fMRI, DTI, and VBM study. Parkinsonism Relat Disord. 2011;17(8):599‐605. doi: 10.1016/j.parkreldis.2011.05.013 [DOI] [PMC free article] [PubMed] [Google Scholar]
- 8. Gatto RG, Martin PR, Ali F, et al. Diffusion tractography of superior cerebellar peduncle and dentatorubrothalamic tracts in two autopsy confirmed progressive supranuclear palsy variants: Richardson syndrome and the speech‐language variant. Neuroimage Clin. 2022;35:103030. doi: 10.1016/j.nicl.2022.103030 [DOI] [PMC free article] [PubMed] [Google Scholar]
- 9. Cosottini M, Ceravolo R, Faggioni L, et al. Assessment of midbrain atrophy in patients with progressive supranuclear palsy with routine magnetic resonance imaging. Acta Neurol Scand. 2007;116(1):37‐42. doi: 10.1111/j.1600-0404.2006.00767.x [DOI] [PubMed] [Google Scholar]
- 10. Satoh R, Weigand SD, Pham NTT, et al. Magnetic susceptibility in progressive supranuclear palsy variants, Parkinson's disease, and Corticobasal syndrome. Mov Disord. 2023;38(12):2282‐2290. doi: 10.1002/mds.29613 [DOI] [PMC free article] [PubMed] [Google Scholar]
- 11. Whitwell JL, Tosakulwong N, Botha H, et al. Brain volume and flortaucipir analysis of progressive supranuclear palsy clinical variants. Neuroimage Clin. 2020;25:102152. doi: 10.1016/j.nicl.2019.102152 [DOI] [PMC free article] [PubMed] [Google Scholar]
- 12. Dickson DW, Josephs KA, Amador‐Ortiz C. TDP‐43 in differential diagnosis of motor neuron disorders. Acta Neuropathol. 2007;114(1):71‐79. doi: 10.1007/s00401-007-0234-5 [DOI] [PubMed] [Google Scholar]
- 13. Dickson DW, Ahmed Z, Algom AA, Tsuboi Y, Josephs KA. Neuropathology of variants of progressive supranuclear palsy. Curr Opin Neurol. 2010;23(4):394‐400. doi: 10.1097/WCO.0b013e32833be924 [DOI] [PubMed] [Google Scholar]
- 14. Buciuc M, Koga S, Pham NTT, et al. The many faces of globular glial tauopathy: a clinical and imaging study. Eur J Neurol. 2023;30(2):321‐333. doi: 10.1111/ene.15603 [DOI] [PMC free article] [PubMed] [Google Scholar]
- 15. Bieniek KF, Josephs KA, Lin WL, Dickson DW. Neuronal intermediate filament inclusion disease may be incorrectly classified as a subtype of FTLD‐FUS. Free Neuropathol. 2020;1:1‐9. doi: 10.17879/freeneuropathology-2020-2639 [DOI] [PMC free article] [PubMed] [Google Scholar]
- 16. Pringle C, Hudson A, Munoz D, Kiernan J, Brown W, Ebers G. Primary lateral sclerosis: clinical features, neuropathology and diagnostic criteria. Brain. 1992;115(2):495‐520. [DOI] [PubMed] [Google Scholar]
- 17. Nasreddine ZS, Phillips NA, Bédirian V, et al. The Montreal cognitive assessment, MoCA: a brief screening tool for mild cognitive impairment. J Am Geriatr Soc. 2005;53(4):695‐699. [DOI] [PubMed] [Google Scholar]
- 18. Lezak MD, Howieson DB, Loring DW, Hannay HJ, Fischer JS. Neuropsychological assessment. 4th ed. Oxford University Press; 2004. xiv, 1016‐xiv, 1016. [Google Scholar]
- 19. Golbe LI, Ohman‐Strickland P, Beisser EB, Elghoul FT. A convenient prognostic tool and staging system for progressive Supranuclear palsy. Mov Disord Clin Pract. 2020;7(6):664‐671. doi: 10.1002/mdc3.13010 [DOI] [PMC free article] [PubMed] [Google Scholar]
- 20. Goetz CG, Fahn S, Martinez‐Martin P, et al. Movement Disorder Society‐sponsored revision of the unified Parkinson's disease rating scale (MDS‐UPDRS): process, format, and clinimetric testing plan. Mov Disord. 2007;22(1):41‐47. doi: 10.1002/mds.21198 [DOI] [PubMed] [Google Scholar]
- 21. Singh NA, Arani A, Graff‐Radford J, et al. Distinct brain iron profiles associated with logopenic progressive aphasia and posterior cortical atrophy. Neuroimage Clin. 2022;36:103161. doi: 10.1016/j.nicl.2022.103161 [DOI] [PMC free article] [PubMed] [Google Scholar]
- 22. Strobel J, Müller HP, Ludolph AC, Beer AJ, Sollmann N, Kassubek J. New perspectives in radiological and radiopharmaceutical hybrid imaging in progressive supranuclear palsy: a systematic review. Cells. 2023;12(24):2776. doi: 10.3390/cells12242776 [DOI] [PMC free article] [PubMed] [Google Scholar]
- 23. Statland JM, Barohn RJ, Dimachkie MM, Floeter MK, Mitsumoto H. Primary lateral sclerosis. Neurol Clin. 2015;33(4):749‐760. doi: 10.1016/j.ncl.2015.07.007 [DOI] [PMC free article] [PubMed] [Google Scholar]
- 24. Satoh R, Ali F, Botha H, Lowe VJ, Josephs KA, Whitwell JL. Direct comparison between (18)F‐Flortaucipir tau PET and quantitative susceptibility mapping in progressive supranuclear palsy. NeuroImage. 2024;286:120509. doi: 10.1016/j.neuroimage.2024.120509 [DOI] [PMC free article] [PubMed] [Google Scholar]
- 25. Li W, Wang N, Yu F, et al. A method for estimating and removing streaking artifacts in quantitative susceptibility mapping. NeuroImage. 2015;108:111‐122. doi: 10.1016/j.neuroimage.2014.12.043 [DOI] [PMC free article] [PubMed] [Google Scholar]
- 26. Andersson JLR, Graham MS, Drobnjak I, Zhang H, Campbell J. Susceptibility‐induced distortion that varies due to motion: correction in diffusion MR without acquiring additional data. NeuroImage. 2018;171:277‐295. doi: 10.1016/j.neuroimage.2017.12.040 [DOI] [PMC free article] [PubMed] [Google Scholar]
- 27. Schilling KG, Yeh FC, Nath V, et al. A fiber coherence index for quality control of B‐table orientation in diffusion MRI scans. Magn Reson Imaging. 2019;58:82‐89. doi: 10.1016/j.mri.2019.01.018 [DOI] [PMC free article] [PubMed] [Google Scholar]
- 28. Yeh FC, Panesar S, Barrios J, et al. Automatic removal of false connections in diffusion MRI Tractography using topology‐informed pruning (TIP). Neurotherapeutics. 2019;16(1):52‐58. doi: 10.1007/s13311-018-0663-y [DOI] [PMC free article] [PubMed] [Google Scholar]
- 29. Yeh FC, Verstynen TD, Wang Y, Fernández‐Miranda JC, Tseng WY. Deterministic diffusion fiber tracking improved by quantitative anisotropy. PLoS One. 2013;8(11):e80713. doi: 10.1371/journal.pone.0080713 [DOI] [PMC free article] [PubMed] [Google Scholar]
- 30. Yeh FC, Panesar S, Fernandes D, et al. Population‐averaged atlas of the macroscale human structural connectome and its network topology. NeuroImage. 2018;178:57‐68. doi: 10.1016/j.neuroimage.2018.05.027 [DOI] [PMC free article] [PubMed] [Google Scholar]
- 31. de Vries BS, Rustemeijer LMM, Bakker LA, et al. Cognitive and behavioural changes in PLS and PMA:challenging the concept of restricted phenotypes. J Neurol Neurosurg Psychiatry. 2019;90(2):141‐147. doi: 10.1136/jnnp-2018-318,788 [DOI] [PubMed] [Google Scholar]
- 32. Josephs KA, Katsuse O, Beccano‐Kelly DA, et al. Atypical progressive supranuclear palsy with corticospinal tract degeneration. J Neuropathol Exp Neurol. 2006;65(4):396‐405. doi: 10.1097/01.jnen.0000218446.38158.61 [DOI] [PubMed] [Google Scholar]
- 33. Liu C, Wei H, Gong NJ, Cronin M, Dibb R, Decker K. Quantitative susceptibility mapping: contrast mechanisms and clinical applications. Tomography. 2015;1(1):3‐17. doi: 10.18383/j.tom.2015.00136 [DOI] [PMC free article] [PubMed] [Google Scholar]
- 34. Schweitzer AD, Liu T, Gupta A, et al. Quantitative susceptibility mapping of the motor cortex in amyotrophic lateral sclerosis and primary lateral sclerosis. AJR Am J Roentgenol. 2015;204(5):1086‐1092. doi: 10.2214/ajr.14.13459 [DOI] [PMC free article] [PubMed] [Google Scholar]
- 35. Cho H, Choi JY, Hwang MS, et al. Subcortical (18) F‐AV‐1451 binding patterns in progressive supranuclear palsy. Mov Disord. 2017;32(1):134‐140. doi: 10.1002/mds.26844 [DOI] [PubMed] [Google Scholar]
- 36. Schonhaut DR, McMillan CT, Spina S, et al. (18) F‐flortaucipir tau positron emission tomography distinguishes established progressive supranuclear palsy from controls and Parkinson disease: a multicenter study. Ann Neurol. 2017;82(4):622‐634. doi: 10.1002/ana.25060 [DOI] [PMC free article] [PubMed] [Google Scholar]
Associated Data
This section collects any data citations, data availability statements, or supplementary materials included in this article.
Data Availability Statement
The data that support the findings of this study are available from the corresponding author upon reasonable request.