The way in which information is presented affects both how health professionals introduce it and how patients use it
The “information age” has profound implications for the way we work. The volume of information derives from biomedical and clinical evaluative sciences and is increasingly available to clinicians and patients through the world wide web.1 We need to process information, derive knowledge, and disseminate the knowledge into clinical practice. This is particularly challenging for doctors in the context of the consultation. Information often highlights uncertainties, including collective professional uncertainty, which we address with more and better research; individual professional uncertainty, which we address with professional education and support for decisions; and stochastic uncertainty (the irreducible element of chance), which we address with effective risk communication about the harms and benefits of different options for treatment or care.
In this article we discuss whether the shift towards a greater use of information in consultations is helpful and summarise the current literature on risk communication. We also explore how information can be used without losing the benefits that are traditionally associated with the art, rather than the science, of medicine.
Summary points
Patients often desire more information than is currently provided
Communicating about risks should be a two way process in which professionals and patients exchange information and opinions about those risks
Professionals need to support patients in making choices by turning raw data into information that is more helpful to the discussions than the data
“Framing” manipulations of information, such as using information about relative risk in isolation of base rates, to achieve professionally determined goals should be avoided
“Decision aids” can be useful as they often include visual presentations of risk information and relate the information to more familiar risks
Methods
This paper draws on systematic reviews and other key literature in the field.2–7 We reviewed literature addressing shared decision making for communicating risks, supporting patients' decisions, and the specific issue of risk communication about cancer.4–7 We also appraised key reviews outside the healthcare setting.8–10
Definition of risk communication
Risk communication is defined as the open two way exchange of information and opinion about risk, leading to better understanding and better decisions about clinical management.2–11 This definition moves away from notions that information is communicated only from clinician to patient, and that acceptability (or not) of the risk is communicated back. The two way exchange about information and opinion is important if decisions about treatment are to reflect the attitudes to risk of the people who will live with the outcomes.
The problems of risk language
Terms such as probable, unlikely, rare, and so on have been shown to convey “elastic” concepts.12,13 One person's understanding of “likely” may be a chance of 1 in 10, whereas another may think that it means a chance of 1 in 2. Any one person may also interpret the term differently in different contexts—a “rare” outcome is a different prospect in the context of genetic or antenatal tests than, for example, in the context of antibiotic treatment for tonsillitis.
Interpretation of numerical information is problematic. For example, Yamagishi found that death rates of 1286 out of 10 000 were rated as more risky than rates of 24.14 out of 100.14 In addition, the interpretation of the probabilistic elements of risk cannot be divorced from the importance of the harm, which includes the meaning of the harm and its implications for lifestyle and health (such as the threat of cancer). But people's interpretations of a condition and its burden also vary—for example, a stroke may mean different things to people according to their personal experience. The context of the risk is also important.15 Risks may be voluntary or imposed; they may be familiar or unknown, which may affect the degree of dread; and they may be concentrated or dispersed over time. These characteristics affect the way people interpret information on risk, and the way they discount the risks (or not) over time affects their responses to them.
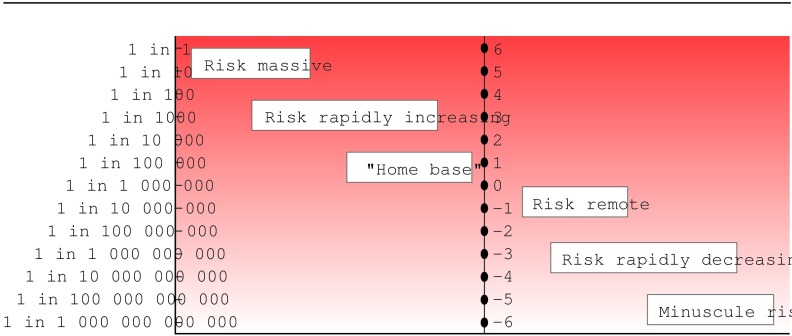
Proposals have been made to standardise the language of risk. Calman suggested a scale with standardised terms for specified frequencies (for example, “high” for risks 1 in less than 100 and “moderate” for between 1 in 100 and 1 in 1000).16 Professionals and the public could become familiar with these standards, and this could promote a more accurate perception of risk. Paling made a similar proposal, a derivation of which is shown in fig 1. He developed this theme further, comparing pictorial representations of risk with everyday more familiar risks.17 The pictorial representation of risk could have many advantages, but language evolves and is not static. Patients would probably not interpret such standardised terms consistently.
Figure 1.
Risk language proposal, derived from Paling17
Framing effects
Further problems in communicating risks result from the effects of different information frames. Framing manipulations are defined as the description of logically equivalent choice situations in different ways, such as advising patients about prognosis by using either survival or mortality data.8 Box B1 summarises the effects of various framing manipulations.
Box 1.
The effects of framing and other manipulations3
We can be persuasive with information. Pharmaceutical companies use persuasive techniques to present effects of their drugs to professionals. A survey of publicity of mammography for patients also found that, to encourage uptake, only information on relative risk was presented, undoubtedly because this information is “effective.”18 Perhaps this is justifiable in some situations to achieve the greatest public health gain. But without the whole truth, presenting information in such a way is not consistent with truly informed decision making.6 We note the US National Research Council's recommendation to seek strictly to inform, unless conditions clearly warrant use of influencing techniques. Such conditions occur only rarely in clinical encounters.
Principles for future communication of risks
Information on risk must be presented in a balanced manner. Information on relative risk should not be presented in isolation. Some writers advocate presenting information just on absolute risk.19 This can take the form of percentage terms or be converted into integers (such as a chance of 1 in 10). Other formats include the number needed to treat (NNT) and the number needed to harm (NNH). Further derivations of this concept include the number needed to screen, the number needed to test, and the number (of tablets) needed to take (NTNT) to prevent an adverse outcome.19 Empirical data on the value of these terms in discussions with patients are sparse.
It seems most justifiable to use both absolute and relative risk formats. A sense of scale is difficult when risks decrease beyond the commonplace, such as 1 in 100, 1 in 1000, or beyond. A comparative frame of reference (as data on relative risk provide) makes it easier to judge levels of risk. People can make good use of information that is presented simply and effectively.20
Risk information relevant to individuals is more valuable than average population data.2 For example, an individual's risk of future coronary heart disease can be calculated by using information on risk factors (such as age, hypertension, cholesterol, smoking status, or diabetes) from readily available charts.21 The Gail formula for breast cancer risk is another example, but other conditions in which such calculations are readily feasible are limited.22
Information must be presented clearly. Sometimes numerical data alone may suffice. The visual presentation of risk information has also been explored. Some empirical studies suggest that many patients prefer simple bar charts to other formats such as thermometer scales, crowd figures (for example, showing how many of 100 people are affected), survival curves, or pie charts; other studies have found that people may prefer presentations that lead them to less accurate perceptions of risk.23,24
Care is required to avoid an overload of information. Most patients, when asked, express a strong desire for information.25 But people's ability to assimilate information varies. It may sometimes be possible to provide and discuss information over several consultations.
Putting principles into practice
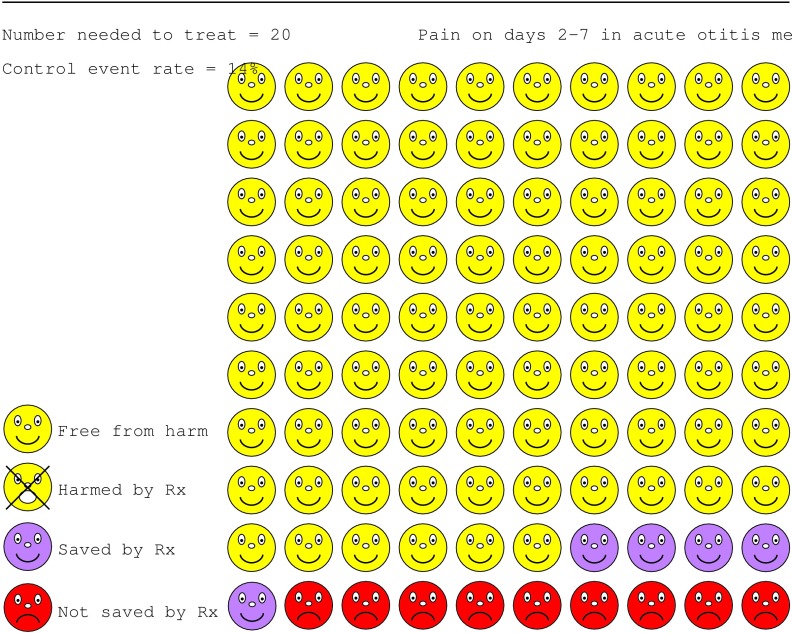
Putting these principles into practice is within reach, provided that professionals are aware of the pitfalls (for example, framing effects). Decision aids include booklets, tapes, videodiscs, interactive computer programs, or paper based charts, to help presentation and discussion of risk information with patients.7 Websites portray the harms or benefits associated with treatment options. An example is the treatment of otitis media with antibiotics (www.nntonline.net) (fig 2).
Figure 2.
Portrayal of risks and benefits of treatment with antibiotics for otitis media designed with Visual Rx, a program that calculates numbers needed to treat from the pooled results of a meta-analysis and produce a graphical display of the result
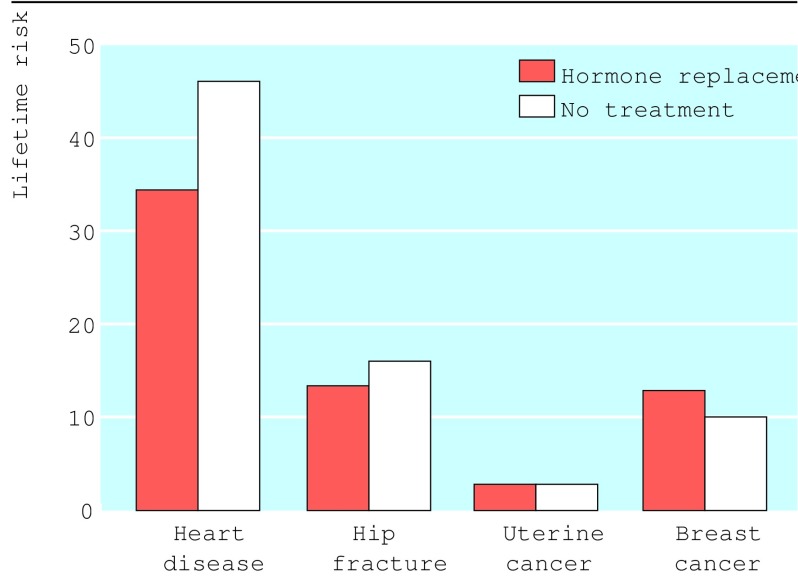
Alternatively, paper based graphs can be used to support discussions with patients (fig 3).26 Booklets, tapes, and other materials may often not be necessary but could be available if patients wish. Patients could also be referred to reference sources such as the Database of Individual Patient Experiences, the UK National electronic Library for Health, and Health Crossroads (box B2). Health Crossroads explores multiple decision points at different times in the patient's “career.” Opportunities are provided to explore scenarios—for example, the harms and benefits of a treatment option alongside the converse harms and benefits from not choosing it.
Figure 3.
Portrayal of the risks and benefits of hormone replacement taken for five years26
Box 2.
Examples of patients' reference points
Time remains a problem in the short term. External sources may enable much of the information gathering to occur outside consultations. Discussions will still be required, but an investment of time at the decision making stage may result in more succinct discussions in the future—and then save time.
Is this the direction we wish to take?
The developments in how information is presented offer opportunities to put substance into commonplace healthcare discussions. But does this swing the balance away from the art of medicine? Will it become less of a “high touch” discipline, in which professionals try to support patients through episodes of illness, and more of a “high tech” one, in which reductionist approaches see pathways of illness as a series of dilemmas that can be “solved”? There may be intangible, even mysterious, value in the softer art of medicine—is this being endangered?
In answer to this, developments in risk communication are not necessarily opposed to these values (although we should beware). It may be helpful to discuss the frequencies of outcomes but still leave room to explore uncertainties that persist. In some scenarios, tests may genuinely increase uncertainty.27 For example, discussion of the pros and cons of testing for prostate specific antigen may increase uncertainty in patients once they are aware of the test's false positive and false negative rates.
The importance of the risks to patients also varies. As patients live through the risk, or the condition if it occurs, they may value the supportive or caring contribution from the same healthcare professionals who have shared information with them.28 Also, we should not assume that decisions are always made on a rational basis.29 Descriptive decision theory says that people regularly make decisions that are not compatible with maximising expected utility. Most of the data available also entail uncertainties. Honesty about this may enhance the role of and respect for professionals, not diminish them. A healthcare professional in the 21st century may be able to be supportive (at times an “agent” for the patient30) but also be an “enabler” and someone to facilitate informed choices.
Conclusions
Certain recommendations for designing materials informing about risk can already be implemented (box B3). The information should be simple and balanced. Comparison with “everyday risks” with which people are familiar may help to present risk data.17 We need to synthesise the current evidence on patients' preferences for different information formats and assess the effects of various formats. Epidemiological work is required to enable calculation of individualised risk estimates across a wide range of clinical conditions. Then further practical decision aids (including digital and interactive ones) can be developed that professionals could have available in their consultations. Evaluation of how patients use these and how professionals can advise their patients alongside this information will be needed.
Box 3.
Design of risk information formats for patients
Acknowledgments
We thank John Paling and Chris Cates for permission to use their material in the figures.
Footnotes
Competing interests: AM has received consulting fees and salary support from the Foundation for Informed Medical Decision Making, and has a royalty agreement with the foundation.
References
- 1.Eysenbach G. Recent advances: consumer health informatics. BMJ. 2000;320:1713–1716. doi: 10.1136/bmj.320.7251.1713. [DOI] [PMC free article] [PubMed] [Google Scholar]
- 2.Edwards AGK, Hood K, Matthews EJ, Russell D, Russell IT, Barker J, et al. The effectiveness of one-to-one risk communication interventions in health care: a systematic review. Med Decis Making. 2000;20:290–297. doi: 10.1177/0272989X0002000305. [DOI] [PubMed] [Google Scholar]
- 3.Edwards AGK, Elwyn G, Mathews E, Pill R. Presenting risk information—a review of the effects of “framing” and other manipulations on patient outcomes. J Health Commun. 2001;6:61–82. doi: 10.1080/10810730150501413. [DOI] [PubMed] [Google Scholar]
- 4.Schwartz L, Woloshin S, Welch G. Risk communication in clinical practice: putting cancer in context. J Natl Cancer Inst Monogr. 1999;25:124–133. doi: 10.1093/oxfordjournals.jncimonographs.a024187. [DOI] [PubMed] [Google Scholar]
- 5.Mazur DJ. Shared decision making in the patient-physician relationship. Tampa, FL: American College of Physician Executives; 2001. [Google Scholar]
- 6.Elwyn G, Edwards AGK. Evidence-based patient choice? In: Edwards AGK, Elwyn G, editors. Evidence-based patient choice—inevitable or impossible? Oxford: Oxford University Press; 2001. pp. 3–18. [Google Scholar]
- 7.O'Connor A, Fiset V, Rosto A, Tetroe J, Entwistle V, Llewellyn-Thomas H, et al. Decision aids for people facing health treatment or screening decisions. Cochrane Library. Issue 1. Oxford: Update Software 2002.
- 8.Wilson DK, Purdon SE, Wallston KA. Compliance to health recommendations: a theoretical overview of message framing. Health Educ Res. 1988;3:161–171. [Google Scholar]
- 9.Kuhberger A. The influence of framing on risky decisions: a meta-analysis. Organ Behav Hum Decis Process. 1998;75:23–55. doi: 10.1006/obhd.1998.2781. [DOI] [PubMed] [Google Scholar]
- 10.Ahl AS, Acree JA, Gipson PS, McDowell RM, Miller L, McElvaine MD. Standardisation of nomenclature for animal health risk analysis. Rev Sci Tech. 1993;12:1045–1053. doi: 10.20506/rst.12.4.744. [DOI] [PubMed] [Google Scholar]
- 11.Glanz K. Communicating about risk of infectious diseases. JAMA. 1996;275:253–256. [PubMed] [Google Scholar]
- 12.Budescu DV, Weinberg S, Wallsten TS. Decisions based on numerically and verbally expressed uncertainties. J Exp Psychol Gen. 1988;14:281–294. [Google Scholar]
- 13.Cohn LD, Schydlower M, Foley J, Copeland RL. Adolescents' misinterpretation of health risk probability expressions. Pediatrics. 1995;95:713–716. [PubMed] [Google Scholar]
- 14.Yamagishi K. When a 12.86% mortality is more dangerous than 24.14%: implications for risk communication. Appl Cogn Psychol. 1997;11:495–506. [Google Scholar]
- 15.Vlek C. Risk assessment, risk perception and decision making about courses of action involving genetic risk: an overview of concepts and methods. Birth Defects Orig Artic Ser. 1987;23:171–207. [PubMed] [Google Scholar]
- 16.Calman K, Royston G. Risk language and dialects. BMJ. 1997;315:939–942. doi: 10.1136/bmj.315.7113.939. [DOI] [PMC free article] [PubMed] [Google Scholar]
- 17.Paling J. Up to your armpits in alligators: how to sort out what risks are worth worrying about. Gainesville, FL: Risk Communication and Environmental Institute; 1997. [Google Scholar]
- 18.Slater E. How risks of breast cancer and benefits of screening are communicated to women: analysis of 58 pamphlets. BMJ. 1998;317:263–264. doi: 10.1136/bmj.317.7153.263. [DOI] [PMC free article] [PubMed] [Google Scholar]
- 19.Skolbekken JA. Communicating the risk reduction achieved by cholesterol reducing drugs. BMJ. 1998;316:1956–1958. doi: 10.1136/bmj.316.7149.1956. [DOI] [PMC free article] [PubMed] [Google Scholar]
- 20.Cosmides L, Tooby J. Are humans good intuitive statisticians after all? Rethinking some conclusions from the literature on judgment under uncertainty. Cognition. 1996;58:1–73. [Google Scholar]
- 21.Wood D, Durrington P, Poulter N, McInnes G. Joint British recommendations on prevention of coronary heart disease in clinical practice. Heart. 1999;80(suppl 2):S1–29. [Google Scholar]
- 22.Gail MH, Brinton LA, Byar DP, Corle DK, Green SB, Schairer C, et al. Projecting individualised probabilities of developing breast cancer for white females who are being examined annually. J Natl Cancer Inst. 1989;81:1879–1886. doi: 10.1093/jnci/81.24.1879. [DOI] [PubMed] [Google Scholar]
- 23.Lipkus IM, Hollands JG. The visual communication of risk. J Natl Cancer Inst Monogr. 1999;25:149–162. doi: 10.1093/oxfordjournals.jncimonographs.a024191. [DOI] [PubMed] [Google Scholar]
- 24.Fortin J, Hirota L, Bond B, O'Connor A, Col N. Identifying patient preferences for communicating risk estimates: a descriptive pilot study. BMC Med Inform Decis Mak 2001;1. www.biomedcentral.com/1472-6947/1/2 (accessed 19 Mar 2002). [DOI] [PMC free article] [PubMed]
- 25.Ende J, Kazis LE, Ash A, Moskowitz M. Measuring patients' desire for autonomy. J Gen Intern Med. 1989;4:23–30. doi: 10.1007/BF02596485. [DOI] [PubMed] [Google Scholar]
- 26.Edwards AGK, Elwyn GJ, Gwyn R. General practice registrar responses to the use of different risk communication tools in simulated consultations: a focus group study. BMJ. 1999;319:749–752. doi: 10.1136/bmj.319.7212.749. [DOI] [PMC free article] [PubMed] [Google Scholar]
- 27.Peshkin B, DeMarco T, Brogan B, Lerman C, Isaacs C. BRCA1/2 testing: complex themes in result interpretation. J Clin Oncol. 2001;19:2555–2565. doi: 10.1200/JCO.2001.19.9.2555. [DOI] [PubMed] [Google Scholar]
- 28.Tudor Hart J, Dieppe P. Caring effects. Lancet. 1996;347:1606–1608. doi: 10.1016/s0140-6736(96)91083-1. [DOI] [PubMed] [Google Scholar]
- 29.Dowding K, Hindmoor A. The usual suspects: rational choice, socialism and political theory. New Political Economy. 1997;2:451–463. [Google Scholar]
- 30.Gafni A, Charles C, Whelan T. The patient physician encounter: the physician as a perfect agent for the patient versus the informed treatment decision-making model. Soc Sci Med. 1998;47:347–354. doi: 10.1016/s0277-9536(98)00091-4. [DOI] [PubMed] [Google Scholar]


