Abstract
Spinal cord circuits play crucial roles in transmitting pain, but the underlying activity patterns within and across spinal segments in behaving mice have remained elusive. We developed a wearable widefield macroscope with a 7.9-mm2 field of view, ~3- to 4-μm lateral resolution, 2.7-mm working distance and <10-g overall weight and show that highly localized painful mechanical stimuli evoke widespread, coordinated astrocyte excitation across multiple spinal segments.
Spinal cord circuits are indispensable for sensory information processing and controlling reflexive and adaptive behaviors, such as those driven by pain and itch, as demonstrated by genetic, anatomical, electrophysiological, pharmacological and behavioral methods1. However, these approaches lack the spatiotemporal resolution, resilience against tissue movement or cell-type specificity necessary to interrogate the activity patterns of genetically defined cell types in behaving animals. In vivo fluorescence imaging overcomes many of these barriers by permitting high-speed, stable measurement of neuronal and non-neuronal activity in the spinal cord2.
Sensory stimuli can recruit cellular networks distributed across multiple spinal segments2,3 (each ~1–1.5 mm in rostrocaudal length in mice4). The optical properties of current fluorescence microscopes hamper the high-speed measurement of such distributed activity. While cellular-resolution devices typically offer small fields of view (FOVs) covering less than one vertebra, large-FOV microscopes (‘macroscopes’) provide limited spatiotemporal resolution, sensitivity and contrast or are incompatible with use in freely moving mice2,5,6. Wearable widefield macroscopes with millimeter-sized FOVs have recently been developed7-10. Still, none offer the combined cellular resolution, frame rates, sensitivity and weights necessary for spinal cord imaging in mice. These technical limitations hamper our ability to decipher how broadly dispersed cellular networks contribute to somatosensory processing in behaving animals. Of particular interest, astrocytes are emerging as essential regulators of pain signaling in the spinal dorsal horn11-14.
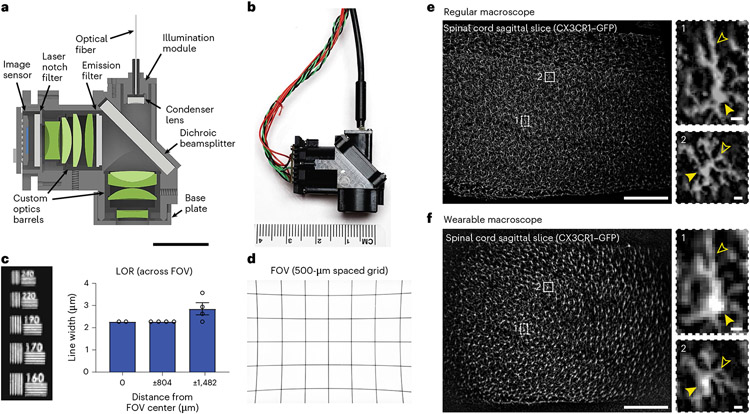
To address these challenges, we developed a wearable macroscope with custom compound microlenses that allows high-resolution, high-speed activity measurements from genetically defined cell types across multiple spinal segments (FOV of 7.9 mm2) in behaving animals. The design goals for this optical system included a FOV of ~3.2 × 2.5 mm, high spatial resolution and contrast across the FOV (~3 μm), a long working distance (WD, >2 mm) and broad achromatic range (450–570 nm). To provide flexibility in the type and the number of light sources that can be coupled (for example, diode-pumped solid-state (DPSS) lasers and light-emitting diodes (LEDs)), a flexible multimode fiber (MMF) was chosen for excitation light delivery (Fig. 1a,b). Additional design parameters included a numerical aperture (NA) of ~0.4, a magnification of ~×1.4 and a track length of 36 mm. To ensure that mice can comfortably wear the macroscope on their backs, we aimed for an overall weight of <10 g. To minimize torque on the animal, we also opted for a folded imaging path, thereby lowering the integrated device’s center of gravity.
Fig. 1 ∣. Wearable macroscopes with custom compound microlenses for millimeter-scale, high-resolution measurements in behaving mice.
a, Cross-section of the wearable macroscope and its custom compound microoptics (green); scale bar, 10 mm. b, Photo of the fabricated device. c, LOR across the FOV. Displayed values are averages across the horizontal and vertical line target results from comparable positions to the left and right of the FOV center. Spatial frequencies were converted to line widths. d, Image of a 500-μm spacing grid target acquired with the integrated device demonstrating its FOV of ~3.2 × 2.5 mm. e, Left, fluorescence image of a 20-μm-thick sagittal spinal cord section from a CX3CR1–GFP mouse with labeled microglia acquired with a commercial benchtop macroscope. Right, zoom-in images of the two subregions indicated on the left showing individual microglial cell bodies and processes (closed and open arrowheads, respectively); scale bars, 500 μm (left) and 10 μm (right). f, Left, fluorescence image of the same spinal cord section as in e acquired with the wearable macroscope. Right, zoom-in images of the subregions indicated on the left. Over 1,000 individual microglial cells are visible. Cells near the right FOV edge look stretched, likely due to sample tilt; scale bars, 500 μm (left) and 10 μm (right). The data in c are from n = 2 and n = 4 measurements at 0 μm and ±804 and ±1,482 μm, respectively. The bar plot is presented as mean ±s.e.m. The error bars at 0 and ±804 μm are too small to be visible. All images are representative of one sample. Images with similar properties were obtained across multiple independent samples. For in vivo data, see Extended Data Fig. 7 and Supplementary Video 2.
Our optical design included eight custom microlenses from five different glass materials (Supplementary Table 1). All glasses were high index (n = 1.76–1.92) to increase optical power while maintaining device compactness (Fig. 1a,b). Zemax modeling was used to optimize the radii of curvature of the lens surfaces, the distance between surfaces and glass types. We included a number 0 coverslip in our design to minimize optical aberrations when imaging through a live animal implanted glass window. Additionally, we accounted for optical filters placed in the collimated space between the lenses required for fluorescence imaging. Following optical modeling, simulation and tolerancing analysis (Extended Data Fig. 1 and Supplementary Tables 1-3), the lenses and brass spacers were fabricated and assembled into two custom-made barrel holders minimized in size and weight (Fig. 1a,b). Each assembled barrel weighed <2.05 g.
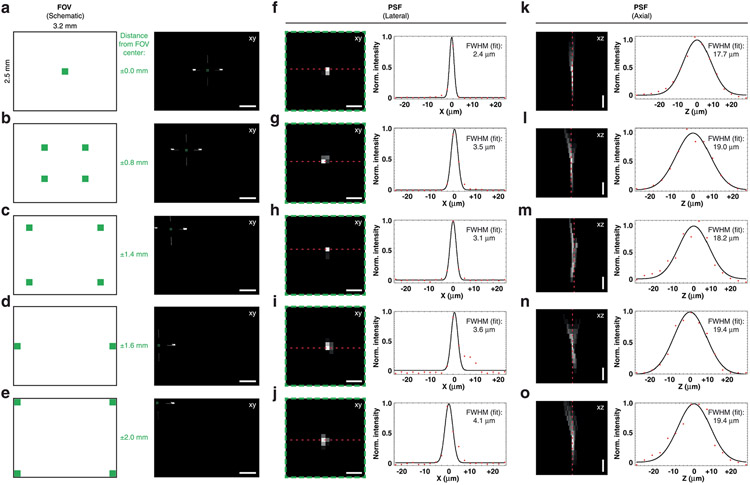
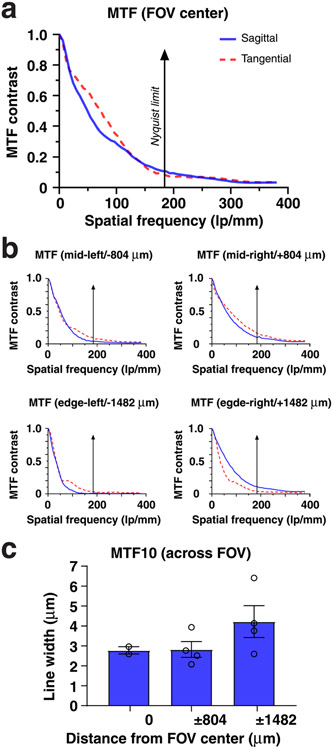
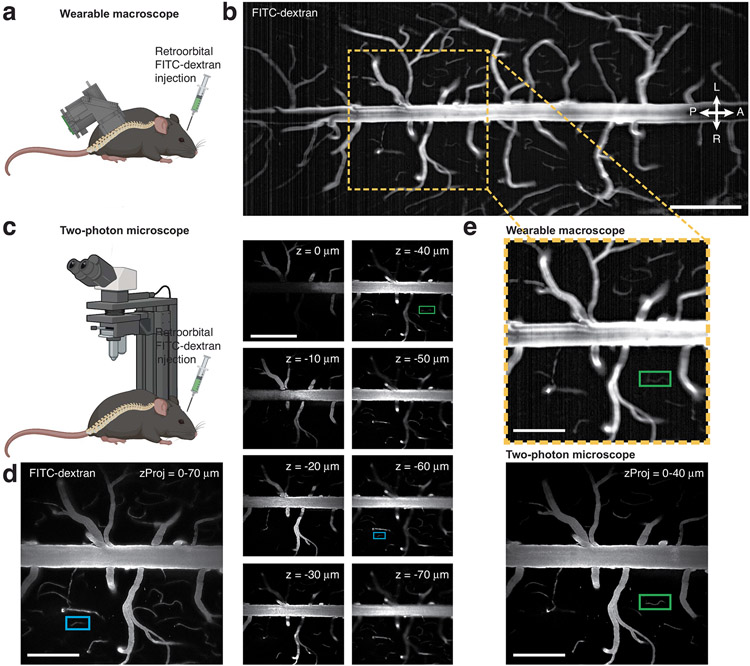
Next, we characterized our integrated system’s optical performance by determining its limit of resolution (LOR) and point spread function (PSF) across the FOV. For the LOR, we measured 2.27 μm in the center and halfway toward the edges of the FOV and 2.85 μm at the FOV edges (Fig. 1c). The lateral and axial PSFs of our integrated system ranged between 2.4 and 4.1 μm and 17.7 and 19.4 μm, respectively, measured as full width at half maximum (FWHM; Extended Data Fig. 2). Because the ability to retrieve image information can be limited by contrast, independent of resolution, we quantified our macroscope’s modulation transfer function (MTF). Our integrated system’s MTF10 (that is, contrast at 10%; Methods) was 169 lp mm−1 tangential (2.96-μm linewidth) and 193 lp mm−1 sagittal (2.59-μm linewidth) in the FOV center (Extended Data Fig. 3). The ability to obtain measurements with sufficient contrast becomes especially important in densely labeled tissue (Figs. 1e,f and 2a,b,d). Notably, our macroscope performs well even at the FOV edges (Extended Data Figs. 1, 2, 4 and 7) allowing video-rate (45 frames per second (fps)) blood flow recordings across spinal segments in anesthetized mice (Supplementary Video 1 and Methods). Sequential macroscope and two-photon imaging in these mice also revealed that our integrated device offers an ~40-μm depth of field (Extended Data Fig. 4), promoting stable recordings from dynamic or curved tissues, such as the spinal cord.
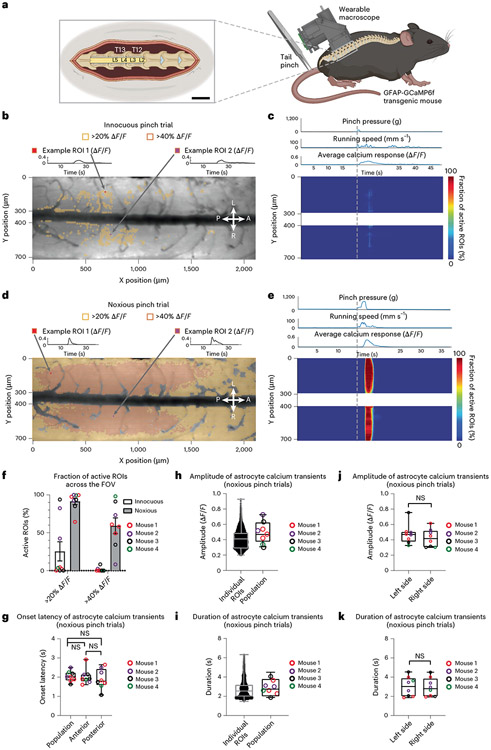
Fig. 2 ∣. High-speed trans-segmental imaging of sensory-evoked calcium activity in behaving GFAP-GCaMP6f mice.
a, Schematic of the experimental approach. A laminectomy was performed over the lumbar spinal cord of GFAP-GCaMP6f mice (N = 4). The wearable macroscope was mounted above it. Pinch stimuli of different intensities and set duration (1.5 s ± 0.5 s) were delivered to the awake animal’s proximal tail. Running speed was recorded by placing the animal on a spherical treadmill under focal restraint (for open field data, see Extended Data Fig. 10 and Supplementary Video 8); scale bar (left inset), 1,400 μm. b, Average intensity projection image from a time-lapse recording taken at a focal depth of ~50 μm below the pia overlaid with ~10 μm × 10 μm ROIs. Only ROIs with at least 20% (yellow) and 40% ΔF/F (orange) in response to an innocuous pinch (p < 200 g) are shown. Innocuous stimuli evoked only sparse astrocyte activity on the left (L) and right (R) sides of the spinal cord and across anterior (A) and posterior (P) lumbar spinal segments (Supplementary Video 6). The calcium transients of two example ROIs are shown above the activity map (for all transients, see Supplementary Fig. 2a-c (left column)). c, Heat map of innocuous tail pinch-evoked activity for the example recording shown in b. Each row depicts the percentage of active ROIs (>20% ΔF/F) across a given mediolateral (Y) position. The corresponding pressure stimulus, locomotor activity and average calcium transient across the FOV are shown above the activity heat map. d, Activity map from the same animal and focal depth as in b for a noxious pinch trial (p > 500 g). Noxious stimuli evoked widespread, bilateral astrocyte excitation across spinal segments (Supplementary Video 7). Two example ROI calcium transients are shown above the activity map (for all transients, see Supplementary Fig. 2a-c (right column)). e, Heat map of noxious tail pinch-evoked astrocyte activity for the recording shown in d. Each row depicts the percentage of active ROIs (>20% ΔF/F) across a given mediolateral (Y) position. Pressure stimulus amplitude, locomotor activity and average calcium signal across the FOV are shown above the activity heat map. f, Population data showing the percentage of active ROIs with at least 20 or 40% ΔF/F for innocuous and noxious stimulus trials. g, Population data showing the average calcium transient onset latency for noxious pinch trials across all, anterior or posterior regions (Methods); NS, not significant. h,i, Population data showing the individual ROI and average calcium response amplitude (h) and duration (i) for noxious pinch trials. j,k, Population data showing the average calcium transient amplitude (j) and duration (k) on the left and right sides of the spinal cord for noxious pinch trials. The data in f are from nine innocuous and eight noxious pinch trials in four mice. The data in h and i (left) are from 67,696 ROIs with ΔF/F of >20%, eight recordings and four mice. The data in g, h and i (right) and j and k are from eight recordings and four mice. Paired two-sided t-tests determined P values (g: 0.5953, 0.8364 and 0.4787; j: 0.2956; k: 0.5852), and all bar plots are presented as mean ± s.e.m. The box and whisker plots mark the median and the 25th and 75th percentiles, and the whiskers cover the minimum and maximum of the data.
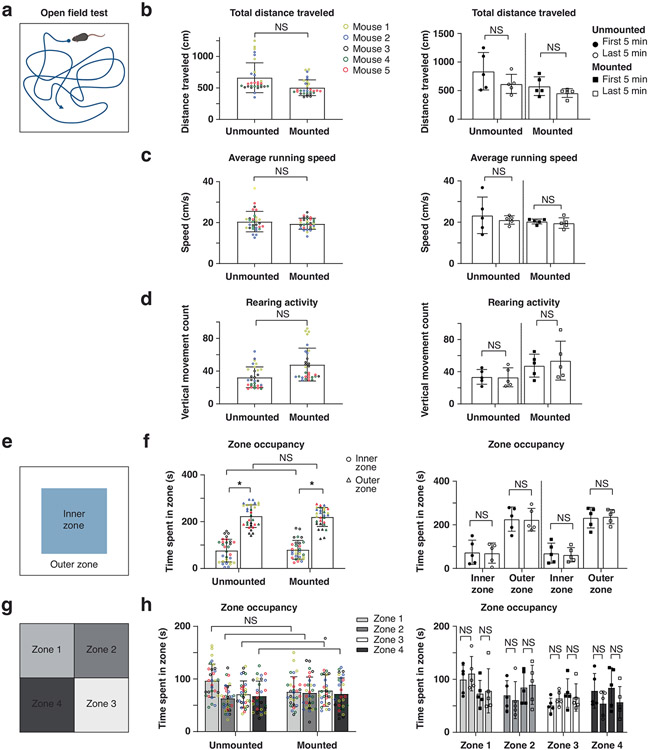
Using a precision differential actuator and regularly spaced grid target with 500-μm spacing, we found that our wearable device had a FOV of 3.215 × 2.465 mm (Fig. 1d) and a WD of 2.727 mm (Methods). This long WD enables imaging through implantable microoptics, such as microprisms (Extended Data Fig. 5). Our fully assembled device measured ~14 × 26 × 29 mm (4.423-cm3 volume) and weighed 9.8 g. Remarkably, 8- to 16-week-old mice could carry the device on their backs without extensive training (30 min of habituation to the macroscope’s weight and positioning; Supplementary Video 2). Three to 5 days (d) of habituation further improved locomotor performance. Open field and linear treadmill measurements in these trained mice confirmed that general locomotor activity (total distance traveled, average running velocity, rearing activity, inner versus outer zone and occupancy in quadrants 1–4) were largely unaffected (Extended Data Fig. 6 and Supplementary Video 3).
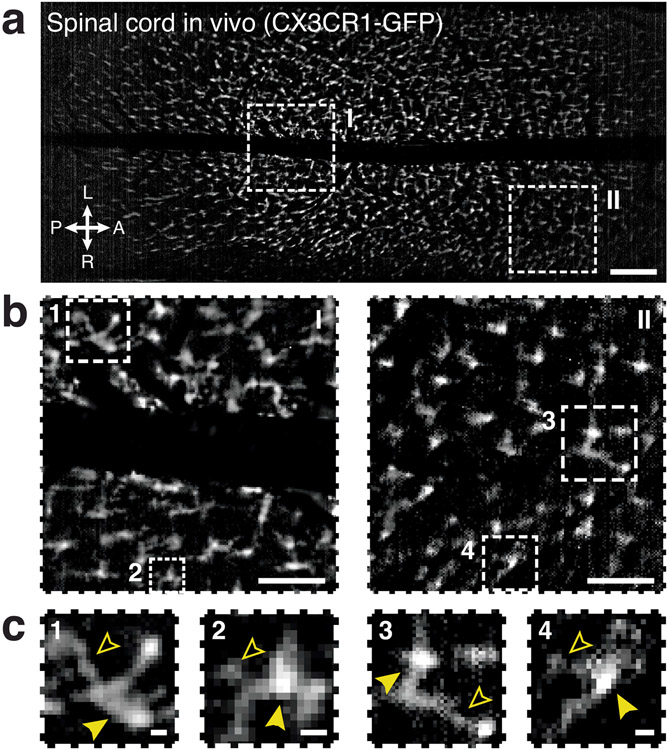
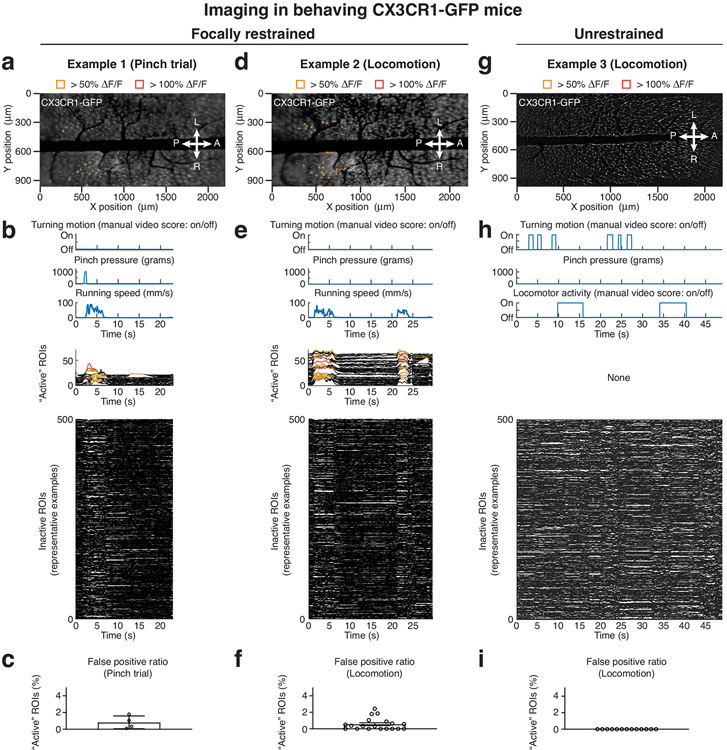
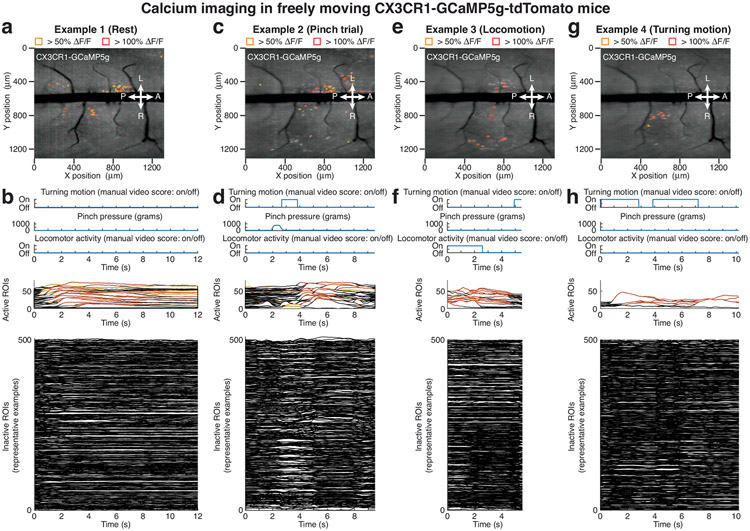
To demonstrate our macroscope’s resolution and contrast across the millimeter-scale FOV, we performed imaging in CX3CR1–green fluorescent protein (CX3CR1–GFP) mice with labeled microglia. Individual cell bodies and processes (typical diameters of 6–8 μm and 1–2 μm, respectively15) were readily visible in sagittal spinal cord sections, as demonstrated by comparing wearable and regular macroscope images of the same tissue region (Fig. 1e,f). Microglial cell bodies and processes were also visible in anesthetized mice (Extended Data Fig. 7) and could be stably imaged in behaving animals (Extended Data Fig. 8 and Supplementary Videos 2 and 4). To demonstrate activity measurements in freely moving animals, we performed calcium imaging in CX3CR1-GCaMP5g-tdTomato mice, revealing spontaneous calcium transients in individual and groups of microglial cell bodies (Extended Data Fig. 9, Supplementary Fig. 1 and Supplementary Video 5). Notably, fluorescence transients of similar onset, offset or plateau kinetics were not seen in behaving CX3CR1–GFP mice, which lack functional indicator expression (Extended Data Fig. 8 and Supplementary Videos 2 and 4).
To further demonstrate the feasibility of high-speed, trans-segmental measurements with our wearable macroscopes, we performed imaging in glial fibrillary acidic protein (GFAP)-GCaMP6f mice with constitutive green fluorescent calcium indicator GCaMP6f expression in astrocytes. Dorsal horn astrocytes can exhibit noxious stimulus-evoked activity across large tissue regions (>500 μm rostrocaudal extent, limited by FOV)11,12, and this activity has been suggested to serve pain modulatory functions12-14. However, its spatial extent and temporal dynamics across spinal segments remain unknown. Determining the spatiotemporal properties of astrocyte excitation is crucial to help define its functional role, underlying mechanisms and interventions to control it16. Using a rodent pincher system, we applied quantifiable and repeatable pressure stimuli to the animal’s proximal tail (duration, 1.5 ± 0.5 s; pressure range, 50–1,100 g; Methods) while imaging astrocyte calcium excitation across lumbar spinal segments L2–L5 at focal depths of 25–75 μm (Fig. 2, Extended Data Fig. 10 and Supplementary Fig. 2).
To facilitate the precise readout of mouse locomotor activity and sensory stimulus application, we first placed the mice on a spherical treadmill during imaging. To quantify sensory-evoked astrocyte responses comprehensively, we tiled the FOV with equally sized (~10 μm × 10 μm) regions of interest (ROIs), excluding major blood vessel regions (Methods). Innocuous tail pinch stimuli (p < 200 g) led to only sparse, low-amplitude transients (most <20% change in fluorescence intensity (ΔF/F)) along the length of the >2,000-μm laminectomy (Fig. 2b,c and Supplementary Video 6). By contrast, noxious tail pinch (p > 500 g) evoked widespread coordinated calcium transients bilaterally and across spinal segments, with many transients exceeding 40% ΔF/F (Fig. 2d-f and Supplementary Video 7). While noxious stimulus application often evoked locomotor activity, running in the absence of tail pinch did not evoke comparable population activity (Fig. 2c,e, Extended Data Fig. 10c and Supplementary Videos 6 and 8), consistent with previous work11. Calcium transients evoked by noxious pinch had an onset latency of 2.04 ± 0.07 s (population average; Fig. 2g), an amplitude of 0.43 ± 0.01 ΔF/F (individual ROIs) and 0.49 ± 0.14 ΔF/F (population average; Fig. 2h) and a duration of 2.72 ± 0.01 s (individual ROIs) and 2.88 ± 0.97 s (population average; Fig. 2i). The amplitude and duration of population transients were comparable on the left and right sides of the spinal cord (Fig. 2j,k and Methods). Based on onset latency, the activity originated in central gray matter regions of each hemisphere (Fig. 2e) and occurred near-simultaneously across spinal segments (Fig. 2g).
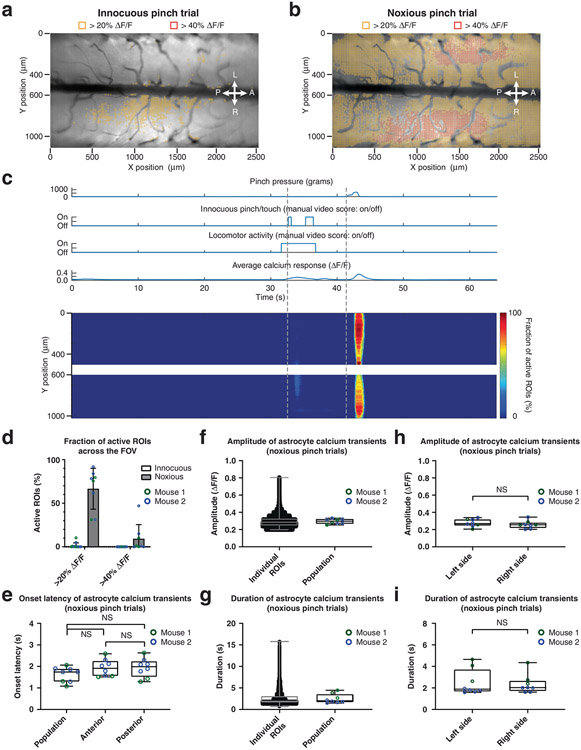
To confirm that similar sensory-evoked responses are detectable in freely moving mice, we repeated the above measurements in an open field (Extended Data Fig. 10 and Supplementary Video 8). Noxious tail pinch (p > 500 g) evoked bilateral large-amplitude calcium transients across spinal segments, while innocuous tail touch and running alone did not (Extended Data Fig. 10a-d). The onset latencies (1.62 ± 0.12 s; population average), amplitudes (individual ROIs: 0.29 ± 0.06 ΔF/F; population average: 0.30 ± 0.03 ΔF/F) and durations (individual ROIs: 2.60 ± 0.01 s; population average: 2.50 ± 0.39 s) of corresponding calcium transients were comparable to those under focal restraint (Extended Data Fig. 10e-i).
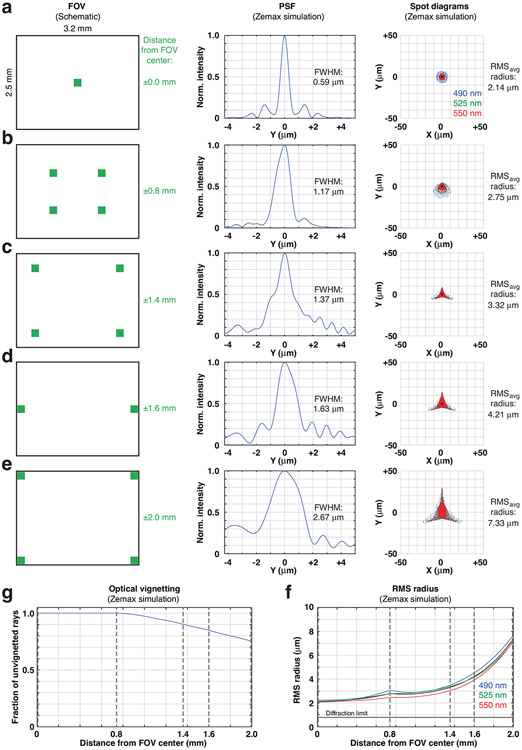
Together, these data demonstrate that our wearable macroscopes are capable of high-speed, high-resolution, bilateral and trans-segmental measurement of sensory-evoked activity in genetically defined cells of behaving mice. The technical capability of our wearable macroscopes for millimeter-scale, high-resolution measurements was enabled by custom compound microlenses (Fig. 1a,c,d,f and Extended Data Fig. 7). These custom optics have a theoretical lateral PSF of ~2.1–4.2 μm across most of the FOV based on Zemax calculations (Extended Data Fig. 1a-e). Our experimentally measured lateral PSF of ~2.4–4.1 μm (Extended Data Fig. 2f-j) suggests that lens fabrication, assembly and device integration introduced only minor errors. This resolution supports measurements from cell bodies and major processes but may miss low-amplitude transients in small cell compartments (for example, astrocyte microdomains around individual synapses). The macroscope’s axial PSF of ~17.7–19.4 μm promotes stable recordings from cell populations in behaving animals and curved tissues, such as the spinal cord (Extended Data Fig. 8 and Supplementary Videos 2 and 4). Depending on labeled cell density or population activity levels, single-cell resolution can be achieved (Extended Data Fig. 9 and Supplementary Videos 5-7). Dense staining with high activity levels may require dedicated computational methods for accurate signal source separation from spatially overlapping cells17,18. Device upgrades (for example, higher sensitivity or frame rate complementary metal oxide semiconductor (CMOS) sensors) are facilitated by our modular design (Methods). Lighter-weight housing materials and thinner or lattice-like housing walls may allow device weight reductions.
Our wearable macroscope can perform high-speed, high-sensitivity functional measurements from genetically defined cells, including astrocytes and microglia, across multiple spinal segments (Fig. 2, Extended Data Figs. 9 and 10, Supplementary Fig. 2 and Supplementary Videos 5-8). The properties of tail pinch- and running-evoked calcium transients in GFAP-GCaMP6f mice were consistent with previous studies2,11. The substantially larger FOV allowed us to reveal that even focally delivered sensory stimuli could evoke remarkably widespread, trans-segmental calcium excitation in dorsal horn astrocytes, while isolated running bouts did not. Future studies will need to determine the full extent (in rostrocaudal and dorsoventral directions), underlying mechanisms (for example, descending noradrenergic, local glutamatergic signaling and gap junction involvement), behavioral dependencies (for example, motor activity) and modulatory effects of this widespread astrocyte activity on spinal neural circuits and behavior (for example, trans-segmental sensitization). Innocuous pinch evoked only sparse activity in isolated ROI clusters (Fig. 2b and Extended Data Fig. 10a). The location of these clusters may provide clues about regional differences in spinal sensory processing and serves as a reminder that data from small FOVs can introduce sampling bias.
The repeatable and quantifiable stimuli used in our study should facilitate comparative measurements in other transgenic mouse lines, such as recordings in genetically defined neuronal subpopulations to reveal their activity patterns in relation to astrocytes. Simultaneous measurement of the activity patterns of multiple cell types should be feasible given our macroscopes’ 450- to 570-nm achromatic range but will require custom multiband filters optimized for large incidence angles (Methods). By allowing measurements from large tissue areas and distributed cell networks in behaving animals, our macroscopes may find applications in various disease settings (for example, functional regeneration after spinal cord injury19) and larger experimental models (for example, transgenic rats7 and marmosets20). Our macroscope’s long WD combined with implantable optics, such as microprisms (Extended Data Fig. 5), should enable high-speed translaminar measurement of sensorimotor activity from and across spinal laminae. Imaging during standard mouse behavioral assays should be feasible given the minimal mobility impediment mice showed during the open field and linear treadmill tests (Extended Data Fig. 6 and Supplementary Videos 2, 3, 5 and 8). Altogether, we expect end-users of our macroscopes to achieve real-time, high-resolution visualization of cellular activity patterns across large FOVs in a multitude of behavioral and disease contexts.
Methods
Miniature macroscope design
Our wearable macroscope includes six major components: the custom optics barrels (including eight microlenses), fluorescence filters, main body, image sensor module, illumination module and base plate (Fig. 1a).
Optical design.
The optical design was generated de novo using Zemax optical modeling software (Zemax v12 R2 2012) and manual calculations. The final design form resembled a double Petzval-type short-conjugate relay. This fairly unique configuration allows for simultaneously large NA and FOV while maintaining a reasonable principal ray angle (<15° half-cone incident on the dichroic and emission filters). Each half of the optical system included a negative element, fitting the Petzval-type description, which acts both as a field flattener and to shorten the physical length of the optical system, akin to a telephoto configuration. During the design phase, geometric distortion was deliberately allowed to increase to 8.1% to gain improvement across the other Seidel aberrations (spherical, coma, astigmatism and field curvature). The final optical design, which involved extensive global optimization, used eight lens elements made from five different glass materials (Supplementary Table 1) housed in two separate custom mechanical housings/barrels for easy assembly (Optics Technology). Both halves of the optical train were optimized together rather than independently, with each half compensating for the aberrations of the other to ensure high performance. To achieve near-uniform optical performance across the FOV, we incorporated a small field aperture at the plane of the primary emission filter, which allowed for an ~37% improvement in resolution at the FOV edges while reducing light collection by only ~11% (based on Zemax calculations; Extended Data Fig. 1). Light collection and resolution in the central FOV (~2 mm in diameter) were unaffected by this aperture. Based on Zemax calculation, the NA of our wearable macroscopes is 0.39.
Optical design tolerances and analysis.
The lens design tolerancing process involves defining tolerances for different design parameters such that the lens system can be fabricated with reasonable precision while still maintaining acceptable performance. Briefly, a list of tolerance operands is defined in Zemax for every surface and tolerance of interest. Then, a Monte Carlo tolerance analysis is performed, and the results are analyzed. A tolerance operand can be, for example, a radius of curvature or glass thickness on a given surface. An acceptable deviation range from the nominal value, or tolerance, is then defined. For example, Supplementary Table 2 shows that the acceptable deviation in the glass thickness of the first lens element on surface 2 is ±5 μm from the nominal thickness (1.600 mm; Supplementary Table 1). The Monte Carlo analysis consists of adding deviations to the lens parameters specified by the tolerance operands, with the deviation (positive or negative) being a random value within the minimum/maximum range defined by that operand. Once all the deviations are added, the performance criterion of the lens system is calculated, typically as root-mean-square (RMS) spot size across the FOV (as in our analysis) or RMS wavefront error across the FOV (for systems close to the diffraction limit). This analysis is then repeated thousands of times (10,000 trials in our analysis), and percentile statistics are calculated to obtain yield. As shown in Supplementary Table 3, at 50% yield, one expects a 2.72-μm RMS spot size in the first field position (that is, the FOV center). This means that if the tolerances on each lens element and surface are followed, one expects the assembled lens system to have an RMS spot radius worse than 2.72 μm in the FOV center for 50% of the fabricated lenses. As such, the assessment of what constitutes acceptable performance was based on lens design experience. The tolerance values were chosen based on feedback from our lens fabricators (Optics Technology) about their capabilities and the ‘Worst Offenders’ output of the Monte Carlo analysis, which lists the tolerance operands individually producing the largest impact on the performance criterion. For example, glass thickness tolerance on surface 2 is ±5 μm, while glass thickness tolerance on surface 4 is ±25 μm. This is because the system’s performance is much more sensitive to deviations in glass thickness at surface 2 than at surface 4.
Optical filters.
Our macroscope uses a short-pass dichroic beamsplitter (FF496, Semrock) and primary (ET525/50m, Chroma Technology) and secondary emission filters (FF01-496/LP, Semrock). These filters were chosen to maximize the emission signal from the green fluorescent genetically encoded calcium indicator GCaMP, a calcium reporter in widespread use. No excitation filter was necessary because we used a 473-nm DPSS laser as the excitation light source (MBL-FN-473, CNI Optoelectronics Technology).
Note that standard interference-type filters are designed for a particular angle of incidence (45° for dichroic beamsplitters and 0° for emission filters), with a tolerance of around ±5–7°. To achieve a large FOV while maintaining reasonable device dimensions, we deliberately allowed a larger than usual principal ray incidence angle on the filters (±15°). Increasing the incidence angle widens the passband of interference filters while shifting it toward shorter wavelengths. In particular, for the 45° dichroic beamsplitter, placed in the center of the optical train, light on the side closer to the image sensor reflects at a larger angle than on the opposite side (60° and 30° incidence angles, respectively). This feature results in the dichroic beamsplitter’s spectral edge shifting by as much as ±25 nm around its nominal edge of λ = 491 nm (at 45° incidence). On the side closer to the image sensor, the beamsplitter’s spectral edge shifts to λ = 516 nm, rejecting more of the fluorescence signal, causing the corresponding image region to get darker. On the opposite side, the spectral edge shifts to λ = 466 nm, accepting more stray excitation light, causing a brighter image region with lower contrast. For emission filters, the increased incidence angle results in the acceptance of more stray excitation light. We solved the stray light problem by placing a secondary emission filter in front of the image sensor, blocking most stray excitation light. The primary and secondary emission filters are approximately located at conjugate planes and, therefore, complement each other in angular performance.
Optical fibers.
The excitation light was delivered to the macroscope using a flexible MMF with a 200-μm core and 0.22-NA (FG200UEA, Thorlabs; Sub-Miniature version A (SMA) connector on one end and 1.25-mm (LC) stainless steel ferrule on the other end connecting to the illumination module). To reduce laser speckle, we used a square-core fiber (FP150QMT, Thorlabs) and a device that generates time-dependent mode mixing within the MMF on a fast time scale through induced fiber bending (quick relative to the image acquisition speed). A square-core fiber was chosen because of its high degree of inherent mode mixing and near-isotropic mixing of modes over a large range of fiber-bend radii. A precision optical spacer and condenser lens (84–377, Edmund Optics) were used to collimate the illumination light. Note that optical fibers were chosen because they provide flexibility in coupling different light sources (for example, DPSS lasers and LEDs), providing unique opportunities for future all-optical interrogations of cellular activity in behaving animals.
Optomechanical design.
The macroscope housing was designed using CAD software (Autodesk Inventor Professional 2018) and included four modules (main body, sensor mount, illumination module and base plate). The main body houses the imaging optics and fluorescence filters, and the illumination module delivers the excitation light. The image sensor module mounts and provides heat dissipation for the CMOS sensor. The detachable base plate allows reproducible mounting, facilitating chronic imaging experiments. This modular design allows for modification of individual components without affecting the rest of the device (for example, to upgrade the image sensor, incorporate an integrated LED instead of a fiber-coupled laser or modify the base plate to pursue an alternative mounting strategy).
The individual lens elements and primary emission filter were assembled inside two barrels to ensure light tightness. All fluorescence filters were edge blackened (Sharpie paint pen). The dichroic cover, which also mounts the illumination module, was coated with highly absorptive black paint (Avian Black-S) to reduce reflections of back-scattered stray light.
Most of the housing was fabricated from light-weight black polyether ether ketone, a thermoplastic opaque to visible and infrared (IR) light (near-IR light with an emission peak of around 850 nm was used to illuminate the behavioral setup during video recordings). The sensor mount was machined from aluminum to help dissipate heat generated by the image sensor, thereby reducing sensor noise. The housing was optimized over several iterations such that the fully assembled device weighed <10 g, ensuring that the animals could comfortably carry the macroscope on their back with training (Extended Data Fig. 6 and Supplementary Videos 3 and 8). We used a folded imaging path to lower the device’s center of gravity and minimize torque on the animal (that is, the short-pass dichroic beamsplitter reflected fluorescence emission and transmitted excitation light). Five-axis computer numerical control milling was selected for ease of fabrication. This technique influenced the design process, as the complex geometry needed to be confined to dimensions accessible to the computer numerical control mill.
Electronic design.
Fluorescence emission was detected with a CMOS sensor (MT9M024IX3STC, Aptina Imaging), which was chosen for its high-sensitivity (5.48 and 6.7 V lux s−1 for the red–green–blue (RGB) and monochrome versions, respectively), resolution (1,280 × 960 pixels; 3.75-μm pixel spacing, corresponding to 2.63 μm at the object plane) and frame rate (45 fps at full resolution). Note that high frame rates are essential for spinal cord recordings given the rapid, large-amplitude, non-uniform tissue displacements in this region during animal behavior11.
While the image sensor can record data at 14 bits (linear gamma), all data were recorded at a 12-bit depth. The sensor was mounted on a custom miniature printed circuit board (Axelsys), interfaced with an Aptina data acquisition board (AGB1N0CS-GEVK) and controlled using the Aptina DevWare software package (v4.5.18).
Macroscope characterization.
The macroscope’s optical performance (resolution and contrast) was determined by quantifying the device’s LOR (Fig. 1c), PSF (Extended Data Fig. 2) and MTF (Extended Data Fig. 3) before any software-based enhancements. The LOR (spatial frequency limit) was defined by the bar set where at least 5% contrast can be observed (the minimal contrast needed for detection by the human eye) and measured with the ‘Find Peaks’ ImageJ plugin and custom ImageJ scripts. For PSF measurements, a point source was generated using a 1-μm pinhole (TC-RT01, Technologie Manufaktur), green fluorescence reference slide (2273, Ted Pella) and blue LED excitation source (M470L3, Thorlabs), and image z stacks were acquired at each FOV position (0 mm, 0.8 mm, 1.4 mm, 1.6 mm and 2.0 mm from the center). The lateral and axial FWHMs of the measured PSFs were determined using Gaussian curve fits. The difference in our lateral LOR and PSF values is likely due to the practical limitations in measuring the PSF (which is the convolution of the optics’ impulse responses with the source wavefront, generated by the pinhole aperture) and test target characteristics (hard- and soft-edge targets used for LOR and PSF measurements, respectively). Note that while the LOR test allows efficient optical performance quantifications across the FOV, it does not allow axial resolution measurements. To measure the MTF, we used the slanted edge test. Corresponding data analysis was performed using the ‘Slanted Edge MTF’ ImageJ plugin, Excel and GraphPad Prism. To quantify our device’s contrast limit, we chose the MTF10 metric (that is, contrast at 10%). Although MTF is frequently reported at 0%, in our experience, MTF values below 10% are affected by sensor noise limits and optical phase reversal. Note that the slanted edge test allows for accurate measurements at spatial frequencies up to twice the Nyquist limit. Our MTF results with line widths less than the size of a single pixel (~2.63 μm at the object plane) are well above measurement error. Line widths are equal to one-half the spatial period.
To characterize the macroscope’s FOV, we used a precision differential actuator (DRV3, Thorlabs) to image a grid target printed directly on the surface of a microscope slide (500-μm grid spacing; Fig. 1d). While our current illumination module was designed to provide a flat illumination field, we observed moderate vignetting (that is, image brightness reduction at the FOV edges; Fig. 1f). Apart from the vignetting common to large FOV imaging systems, additional vignetting resulted from a field stop we deliberately introduced to improve image quality at the FOV edges (Extended Data Fig. 1). To compensate for this synthetic vignetting and enhance the signal-to-noise ratio at the FOV edges, an illumination module with a non-flat illumination field will need to be designed. This non-trivial engineering task may involve using multiple optical elements, non-imaging type optics or miniature LEDs directly attached to the underside of the macroscope or base plate. Currently, we correct for vignetting with postacquisition software. While this introduces digital noise (due to the effectively reduced dynamic range and sensor bit depth at the FOV edges), this noise was not prominent in our in vivo recordings because of the large ΔF/F signals we typically observed in live animals (Fig. 2d-f, Extended Data Figs. 9 and 10, Supplementary Fig. 2 and Supplementary Videos 5-8).
The macroscope’s WD was measured by placing the device in contact with a grid target (R1L3S3P, Thorlabs) and then translating it upward until the image came into focus by using a precision differential actuator (DRV3, Thorlabs). Note that the WD depends on the cover glass thickness. We used a number 0 cover glass (~100 μm thick) for our experiments.
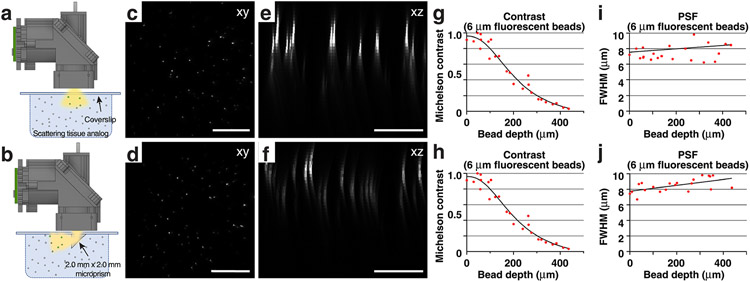
Tissue analogs were used to demonstrate the wearable macroscopes’ long WD and estimate contrast and PSF FWHM degradation with imaging depth (Extended Data Fig. 5). These tissue phantoms consisted of 0.5% (by weight) agarose, 11% (by volume) scattering bead solution (1.00-μm Polybead Microspheres, 07310-15, Polysciences) and 5% (by volume) fluorescent bead solution (6-μm FocalCheck microspheres, F14807, Thermo Fisher Scientific), prepared using deionized water. Contrast and PSF FWHM in Extended Data Fig. 5g-j were measured without background subtraction using the ImageJ plugin MetroloJ. Note that Michelson contrast is defined as (peak − background)/(peak + background) and is, therefore, unitless.
For depth-of-field measurements, we acquired z stacks in anesthetized wild-type mice retroorbitally injected with the green fluorescent dye fluorescein-dextran (FITC-dextran; 2% (wt/vol); Extended Data Fig. 4). Two-photon z stacks were acquired with a 1-μm axial step size from 250 μm to 0 μm below the pia. One-photon recordings used a 5-μm step size across the same depth range. We produced maximum-intensity projections from the two-photon z stacks across several depth ranges (for example, 0–40 μm or 0–70 μm below the pia) for comparison with the one-photon images. Based on these measurements, we estimate that our macroscope has a ~40-μm depth of field in vivo, promoting stable recordings from dynamic curved tissues, such as the spinal cord (Extended Data Fig. 8 and Supplementary Videos 2 and 4).
The integrated device weight was determined by weighing the individual components and the assembled system (including all optics, optomechanical components and electronics). We did not include the sensor cabling wires or optical fiber in the measurement, as the weight of these is typically supported by external mounts or a commutator.
Experimental model and animal details
All procedures were performed following the National Institutes of Health (NIH) guidelines and were approved by the Institutional Animal Care and Use Committee at the Salk Institute under protocol number 13-00022. Mouse strains used in this study included wild-type (RRID: IMSR_JAX:000664), GFAP-Cre (RRID: IMSR_JAX:012886), Ai95(RCL-GCaMP6f)-D (RRID: IMSR_JAX:024105), CX3CR1-Cre/ERT2 (RRID: IMSR_EM:06350), Polr2a(CAG-GCaMP5g-tdTomato) (RRID: IMSR_JAX:024477) and heterozygous CX3CR1–GFP mice (RRID: IMSR_JAX:005582). All mice were on a C57BL/6J background. Mice were group housed, provided with bedding and nesting material and maintained on a 12-h light/12-h dark cycle in a temperature- (22 ± 1 °C) and humidity-controlled (45–65%) environment. The in vivo imaging and behavioral and immunostaining experiments involved one 9-week-old female wild-type mouse, eight 8- to 12-week-old heterozygous male and female GFAP-GCaMP6f mice, two 15- to 16-week-old male and female CX3CR1-GCaMP5g-tdTomato mice and three 10- to 12-week-old male and female CX3CR1–GFP mice. Cre-mediated DNA recombination in Cre/ERT2 mice was induced following established protocols21. Briefly, tamoxifen (T5648, Sigma-Aldrich) was diluted in corn oil (C8267, Sigma-Aldrich) and injected intraperitoneally at 100 mg per kg (body weight) once a day for 5 consecutive d, followed by imaging ~3–5 weeks after the final injection. Experimental mice used in individual experiments typically originated from different litters. Mice had marks for unique identification. No criteria were applied to allocate mice to experimental groups.
Live animal preparation
For awake imaging, GFAP-GCaMP6f, CX3CR1–GFP and CX3CR1-GCaMP5g-tdTomato animals were implanted with a spinal and head plate under general anesthesia approximately 1 week before laminectomy, as previously described11. Buprenorphine (sustained release; 0.5 mg kg−1) was given to minimize postoperative pain. For anesthetized imaging, wild-type and CX3CR1–GFP animals were implanted with a spinal plate, prepared with a laminectomy and imaged immediately after optical window preparation.
The laminectomy (typically 2 mm wide and 4 mm long) was performed at the T12-T13 vertebra level, corresponding to spinal segments L2–L5 (ref. 4). The dura mater overlying the spinal cord was kept intact, and a custom-cut number 0 coverslip was used to seal the laminectomy, creating an optical imaging window. CX3CR1–GFP and CX3CR1-GCaMP5g-tdTomato mice were imaged immediately after recovery from anesthesia (>1 h). GFAP-GCaMP6f mice were imaged 4–7 d after window preparation. If necessary, the coverslip was replaced before the imaging session to improve optical clarity following established procedures22. Briefly, fine forceps were used to carefully remove tissue glue around the coverslip edges, lift the coverslip off the bone and peel away any connective tissue that could interfere with new coverslip placement or imaging. A new coverslip was then positioned and glued in place.
For blood vessel/flow imaging in wild-type mice (Extended Data Fig. 4), blood plasma was stained using a 75- to 125-μl retroorbital injection of 2% (wt/vol) FITC-dextran (2,000,000 molecular weight; D7137, Life Technologies).
Immunofluorescence
Tissue sections for immunostaining were prepared as previously described11. Briefly, mice were killed in their home cage using CO2 asphyxiation (30–70% fill rate) in accordance with Institutional Animal Care and Use Committee guidelines. Animals were then transcardially perfused with 10% sucrose followed by 4% paraformaldehyde. Spinal cord tissue was carefully extracted and incubated in 4% paraformaldehyde overnight at 8 °C. Fixed tissue was thoroughly washed on a plate shaker with 1× PBS three times over ~1 h. Perfused and PBS-washed tissue was then sectioned at 50 μm using a vibratome (VT1000s, Leica). Immunostaining was performed on floating tissue sections using standard techniques. Primary antibodies included Iba1 (1:200; Wako, 019-19741; RRID: AB_839504). Secondary antibodies (1:100) included Alexa Fluor 405 goat anti-rabbit (Thermo Fisher Scientific, A-31556; RRID: AB_221605).
Fluorescence imaging
In vivo imaging through a dorsal optical window.
Data in behaving mice were acquired following previously established protocols11. A fiber-coupled 473-nm DPSS laser was used for GCaMP6f, GCaMP5g and GFP excitation. Approximately 10–20 recordings were taken per imaging session, with each recording lasting around 1–5 min. Time-lapse recordings were acquired at a focal depth of between 25 and 75 μm below the pia. The typical average power for a given recording was <105 μW mm−2. No signs of phototoxicity, such as a gradual increase in baseline fluorescence, lasting changes in activity rate or blebbing of labeled cells were apparent in our recordings. All in vivo data were acquired at the image sensor’s full resolution (1,280 × 960 pixels) and a frame rate of 45 Hz, except Supplementary Videos 2 and 4, which were recorded at 23 fps (by accident; no technical limitation).
In vivo two-photon imaging through a dorsal optical window.
To estimate the depth of field of our wearable macroscopes (Extended Data Fig. 4), we acquired two-photon z stacks in wild-type mice retroorbitally injected with FITC-dextran. Briefly, a Sutter movable objective microscope equipped with MPScope software (v1.1), a pulsed femtosecond Ti:Sapphire laser (Chameleon Ultra II, Coherent) and two fluorescence detection channels were used for imaging (dichroic beamsplitter: T565LPXR (Chroma); green emission filter: ET525/70M (Chroma); red emission filter: ET605/70M (Chroma); photomultiplier tubes: H7422-40 GaAsP (Hamamatsu)). The laser excitation wavelength was set to 920 nm. The average laser power used for imaging was <10–15 mW at the tissue surface and was adjusted with depth as needed to compensate for signal loss due to scattering and absorption. A Nikon ×16/0.8-NA water immersion objective was used for light delivery and collection. Z stacks included up to 250 images acquired at an axial step size of 1μm and used a two-frame average and resolution of 512 × 512 pixels and a ×1.0 zoom (corresponding to a ~970-μm FOV).
In vitro imaging through implanted microprisms.
To demonstrate the wearable macroscopes’ long WD and translaminar imaging capability, we implanted microprisms (2.0 mm × 2.0 mm × 2.0 mm (width × depth × height)) with a reflective, enhanced aluminum coating on the hypotenuse (Tower Optical Corporation, 4531-0024) in scattering tissue phantoms with embedded fluorescent beads 6 μm in diameter (Extended Data Fig. 5). The miniature macroscope’s millimeter-scale FOV allowed imaging of the entire microprism face. Recordings were taken at different focal depths from the vertical microprism–tissue phantom interface, where 0 μm was defined as the point when fluorescent beads first came into focus. A fiber-coupled 473-nm DPSS laser was used for fluorescence excitation. Note that imaging through intermediary microoptics can introduce vignetting with the amount depending on light cone clipping at the edges (that is, microprism size).
Widefield imaging of tissue sections.
To benchmark our wearable macroscope’s imaging performance, we used a commercial benchtop macroscope with similar FOV (Fig. 1e,f). This macroscope was equipped with a wide-FOV objective (XL Fluor4x/340, Olympus) and a high-resolution image sensor (ORCA-Flash4.0 V3, Hamamatsu Photonics K.K.). Images were acquired at a resolution of 2,048 × 1,620 pixels (no binning or averaging) using Hamamatsu’s HCImageLive software (v4.4.0.26). Despite being orders of magnitude smaller and lighter, our wearable macroscopes provided comparable resolution and contrast and two-times better light collection due to their higher NA of 0.39 than the commercial system (NA of 0.28).
Confocal imaging of tissue sections.
Immunostained tissue sections were imaged using a Zeiss LSM 710 confocal microscope and ZEN Black software (2011). Two-channel tiled z stacks were acquired to produce images of whole tissue sections (laser lines: 405 nm, 633 nm). Image size was 1,024 × 1,024 pixels stitched into 5–8 × 5–8 tiles (frame scanning; pixel dwell time, 1.58 μs; average, two frames). Images were acquired with an Olympus ×20/0.8-NA air-matched objective.
Sensory stimuli and behavioral tests
Sensory stimuli during in vivo imaging.
Each imaging session consisted of up to 20 recordings. Mechanical stimuli were delivered to the animal’s tail using a rodent pincher system (2450, IITC Life Science). Pinch pressures were applied in the dorsoventral direction at approximately 6 mm from the base of the animal’s tail. Each pinch stimulus (typically one per recording) lasted around 1–2 s. Subsequent trials were delivered at least 1.5–2 min apart to minimize response adaptation. The order in which stimuli of different amplitudes were delivered was randomized. Fig. 2, Extended Data Figs. 8-10 and Supplementary Fig. 2 show data from mechanical stimuli of p < 200 g and p > 500 g.
Open field test.
To quantify how the ~9.8-g macroscope mounted on the animal’s back (lumbar spinal cord) might affect general locomotor activity, we used the open field test with IR tracking (ENV-510; software: Activity Monitor v6.05, Med Associates; Extended Data Fig. 6). Animals (~8- to 12-week-old female and male GFAP-GCaMP6f mice with an implanted spinal plate) habituated to carrying the macroscope for 3–5 d were acclimated to the testing environment by placing their home cage in the testing room ~60 min before the recordings. Mice were then transferred to individual testing chambers and were always placed in the lower lefthand corner facing the center of the apparatus. Thirty-five- to 40-min recordings were collected for each animal (N = 5) with the experimenter outside the room. The mice were then removed from the apparatus, the wearable macroscope was mounted, and mice were placed back in their respective chambers using the same starting orientation. Another set of 35- to 40-min recordings was acquired with the experimenter outside the room. Total distance traveled (centimeters), average running speed (centimeters per second), rearing activity (vertical movement count), time spent in inner and outer zones (seconds) and time spent in each quadrant (seconds) were analyzed. Individual data points are plotted per animal as well as the first and last five recording minutes per animal (Extended Data Fig. 6b-d,f,h, left and right columns, respectively). Recordings of a given animal were averaged before averaging across animals.
Linear treadmill test.
Mice habituated to carrying the macroscope for 5 d were placed on a custom linear treadmill. Videos of mouse gait were acquired at 200 fps using a Basler acA1440-220uM camera and Basler Pylon v6.2.0 software. Mice were recorded for two 10-min periods with and without the mounted macroscope (Supplementary Video 3) for a total of four sessions per animal (N = 2) following 10-min habituation periods.
Image data processing and analysis
In vivo imaging data.
We used a custom MATLAB script to convert the image sensor’s raw files from 12 to 16 bit and adjust their pixel range. The data were then further processed in ImageJ/Fiji (SciJava v2.0.0c). We converted the image data to TIFF, cropped the time-lapse recordings to the laser-on period and fluorescently labeled central areas of the FOV, followed by computational illumination correction. Data from animals from the same experimental group or strain were processed similarly. Any image adjustments (for example, brightness and contrast changes) were applied across the entire image or stack. No nonlinear adjustments (that is, gamma changes) were made to calcium imaging data from GFAP-GCaMP6f (Fig. 2, Extended Data Fig. 10 and Supplementary Videos 6-8) or CX3CR1-GCaMP5g-tdTomato mice (Extended Data Fig. 9 and Supplementary Video 5). Data analysis was performed on illumination-corrected images from GFAP-GCaMP6f mice and illumination- and background-subtracted images from CX3CR1–GFP and CX3CR1-GCaMP5g-tdTomato mice (tdTomato is rejected by our macroscope’s ET525/50m emission filter). For display purposes only, imaging data from CX3CR1–GFP mice (Supplementary Videos 2 and 4) were processed using Fiji’s ‘Gamma…’ and ‘Subtract Background…’ functions (gamma value: 1.82; the same gamma value and Fiji’s ‘Enhance Local Contrast (CLAHE)’ feature were applied to the tissue section images in Fig. 1e,f). Full-frame image motion was reduced using Moco23 (image displacements were determined from background-subtracted images and applied to raw images before analysis). Image edge artifacts introduced by motion correction were cropped. Within-frame distortions were typically small at the 45 fps sampling rate and were therefore not corrected. Recordings for which motion correction failed (for example, some vigorous runs >100 mm s−1) were excluded from data analysis.
Motion-corrected calcium imaging data were analyzed using custom ImageJ and MATLAB software. We used an unbiased tiling approach to quantify calcium activity across the FOV, similar to our previous work24 (Fig. 2, Extended Data Figs. 8-10 and Supplementary Fig. 2). Each tile corresponded to a 4 × 4-pixel ROI (equivalent to ~10 μm × 10 μm). We defined three ROI classes: over, near and distant from blood vessels. First, we calculated the mean and standard deviation (s.d.) of the recording’s maximum-intensity image. Second, we determined the average intensity values (A) of the ROIs. If A < mean − 1 s.d., it was considered a blood vessel ROI. If A ≥ mean + (1 + x) × s.d. (with x indicating ∈ [0–3] depending on the data set (for example, blood vessel size/pattern and tissue staining)), it was classified as distant from blood vessels. ROIs with in-between values were considered near blood vessel ROIs. ROIs over and near blood vessels were excluded from data analysis. Note that this approach may not exclude all ROIs over small (<10–15 μm) or out-of-focus blood vessels. However, as described below, several stringent computational criteria were applied to minimize the number of false-positive ‘active’ ROIs (Extended Data Fig. 8).
For all qualifying (that is, considered distant from blood vessels) ROIs, we calculated their average fluorescence intensity over time. Corresponding activity traces were temporally smoothed using a 0.5-s sliding average. MATLAB’s ‘findpeaks’ function identified local maxima within the traces. The fluorescence baseline and noise level (in s.d.) of a given trace were calculated using a 2-s period before sensory stimulus or behavioral activity (locomotion and turning) onset. Local maxima were considered evoked activity if fluorescence intensity values surrounding the peak were at least 6 s.d. above baseline for ≥2 s. Calcium transient onset was defined as the point at which the fluorescence intensity trace immediately before the peak crossed a 2-s.d. threshold above baseline. Calcium transient duration was defined as the trace’s FWHM. Traces that showed (1) activity within 2 s after recording onset (that is, before stimulus onset), (2) fluorescence decreases faster than the indicator’s unbinding kinetics (≥50% signal drop within ≤250 ms) or (3) a 6-s.d. drop below fluorescence baseline after transient onset for ≥3 s were considered artifactual (for example, caused by tissue motion) and were excluded from further analysis. For multipeak transients, the largest peak’s value was used for FWHM calculation. If the intensity values between peaks fell below the half-maximum value for ≥250 ms, the half-maximum point closest to the largest peak was used for FWHM calculation. If the trace’s amplitude fell below 2 s.d. above baseline for ≥400 ms, the corresponding transients were considered separate calcium spikes.
To distinguish spontaneous from evoked glial calcium activity, we applied additional criteria. A glial calcium transient was considered evoked if its onset occurred within 5 s after stimulus onset. For all activity traces that passed the filters mentioned above, we calculated ΔF(t)/F0(t). F0 was determined with MATLAB’s mode function using a 15-bin width. Traces that showed abrupt intensity changes (≥0.5 ΔF/F within ≤65 ms) were removed from the analysis.
To quantify potential differences in the amplitude or duration of sensory-evoked calcium activity on the left and right sides of the spinal cord (Fig. 2j,k and Extended Data Fig. 10h,i), we focused our analysis on 100-μm-wide gray matter regions (±150–250 μm from the central vein). To quantify potential differences in the onset latency of sensory-evoked activity on the rostral and caudal ends of the FOV, we focused our analysis on 100-μm-wide regions (≥1,500 μm from one another; Fig. 2g and Extended Data Fig. 10e).
Confocal imaging data.
To quantify immunostained tissue images, we used Imaris’ creation wizard to classify cells as ‘Spots’ and quantify the number of Iba1+ compared to tdTomato+ cells (Supplementary Fig. 1).
Analog and video data processing and analysis
All analog data were synchronously recorded at 1 kHz using DAQExpress 2.0 software (National Instruments) and processed using custom MATLAB routines. Analog data included the pressure sensor output from the rodent pincher system, on–off Transistor-Transistor-Logic (TTL) signal of the miniaturized macroscope’s light source and treadmill speed, depending on the experiment. Pinch application and mouse behavior were also recorded on a video camera (≥20 Hz; software: AVT SmartView 1.11, Allied Vision Technologies or Samsung’s Camera app v12.0.01.2). Videos of mouse gait were acquired at 200 fps using a Basler acA1440-220uM camera and Pylon v6.2.0 software. To synchronize imaging with video data, we placed a near-IR LED within the video camera’s FOV, triggered from the wearable macroscope’s light source drive signal (TTL pulse). Imaging and analog data were synchronized by recording the on–off TTL signal of the macroscope’s light source together with all other analog data.
The video data were cropped to the LED-on period and scored manually regarding pinch onset and offset and mouse open field (for example, run onset/offset, turning motion; Extended Data Figs. 8g-i, 9 and 10 and Supplementary Videos 2, 5 and 8) or spherical treadmill behavior (Fig. 2, Extended Data Fig. 8a-f and Supplementary Videos 4, 6 and 7). Calcium transient latency was calculated based on these scorings because video recordings provided the highest temporal resolution (that is, higher than the pincher traces).
To relate the animal’s locomotor activity more closely to the imaging data, we focally restrained animals on a spherical treadmill equipped with an optical encoder (E7PD-720-118, US Digital), allowing precise readout of running speed (Fig. 2 and Extended Data Fig. 8a-f). The pincher and encoder traces were first cropped to the light source-on period. Pressure traces were quantified with respect to stimulus amplitude and duration. Encoder traces were smoothed using a sliding average (window size: 0.4 s). Locomotion onset or offset was defined as the point at which the smoothed running speed exceeded or fell below 10 mm s−1. Encoder traces were analyzed concerning running speed, duration and frequency. If the running speed fell below the 10 mm s−1 threshold for ≥750 ms, the local maxima were considered separate running bouts.
For population analysis, data were computationally sorted using custom MATLAB routines. Only trials with pinch durations of 1.5 ± 0.5 s were included in the analysis. All figures and supplementary videos were created using Adobe Illustrator and Premier (2022), respectively.
Statistical analysis
All data were analyzed and plotted using ImageJ/Fiji (SciJava, v2.0.0c), MATLAB (MathWorks, R2012b and R2019b), Microsoft Excel (2013), IMARIS (version 9.2, Oxford Instruments) or GraphPad Prism (v8.4.3) software. Paired two-sided t-tests were used to evaluate potential calcium activity differences on the left and right sides (Fig. 2j,k and Extended Data Fig. 10h,i) and anterior and posterior regions of the spinal cord (Fig. 2g and Extended Data Fig. 10e) and changes in the animal’s general locomotor activity (Extended Data Fig. 6). All data are represented as mean ± s.e.m (standard error of the mean). Group sample sizes were chosen based on power analysis or previous studies. The following convention was used to indicate P values: NS, P > 0.05; *, 0.01 < P ≤ 0.05; **, 0.001 < P ≤ 0.01; ***, 0.0001 < P ≤ 0.001; ****, P ≤ 0.0001.
Extended Data
Extended Data Fig. 1 ∣. Wearable macroscopes with custom-compound microlenses have a predicted ~3–4 μm lateral resolution across a millimeter-scale FOV based on Zemax simulations.
a–e, Zemax simulations showing the optical system’s PSF (center) and spot diagrams (right) at different FOV positions (left), including 0 mm (a), 0.8 mm (b), 1.4 mm (c), 1.6 mm (d), and 2.0 mm (e) from the center. At a given FOV location, the RMS spot diagrams for 490 nm (blue), 525 nm (green), and 550 nm (red) are overlaid. RMSavg provides the average radius for these three wavelengths, falling within the wearable macroscope’s achromatic range (450–570 nm). f, RMS radius across the FOV for 490 nm (blue), 525 nm (green), and 550 nm (red). The dotted lines indicate the FOV positions shown in panels a–e. The small hump at field position 0.8 mm corresponds to the location of the field stop used to reduce aberrations in the outer portion of the FOV. g, Optical vignetting across the FOV. The dotted lines indicate the FOV positions shown in panels a–e. The decrease in light collection beyond field position 0.8 mm corresponds to the location of the field stop.
Extended Data Fig. 2 ∣. Wearable macroscopes with custom-compound microlenses offer ~2.4–4.1 μm lateral and ~17.7–19.4 μm axial resolutions based on point source measurements.
a–e, Experimental approach for characterizing the wearable macroscope’s lateral and axial PSFs at different FOV positions (left), including 0 mm (a), 0.8 mm (b), 1.4 mm (c), 1.6 mm (d), and 2.0 mm (e) from the center, using a test target with a 1 μm-diameter pinhole (right) (Methods). Image z stacks were acquired at each FOV position. The example images (right) are from the z-positions where the PSF had minimal x–y extent. Scale bars, 500 μm. f–j, Left, lateral PSFs at the different FOV positions. The images are zoom-ins of the indicated areas in a–e (green dashed squares). Right, x cross-section showing the Gaussian fit-based FWHM. Scale bars, 10 μm. k–o, Left, axial PSFs at the different FOV positions. Each image is a maximum-intensity projection through the corresponding z stack. Right, z cross-section showing the Gaussian fit-based FWHM. Scale bars, 10 μm. The red dotted and black solid lines in f-o show the measured intensity along the red dashed lines in the PSF images and the Gaussian fit profile, respectively. FWHM values on the left and right sides of the FOV were comparable. All images are representatives from one sample. Images with similar properties were obtained across multiple independent samples. For LOR and contrast measurements across the FOV, see Fig. 1c and Extended Data Fig. 3, respectively.
Extended Data Fig. 3 ∣. Wearable macroscopes with custom-compound microlenses provide ~3–4 μm contrast across a millimeter-scale FOV based on MTF measurements.
a, MTF of the integrated macroscope measured in the center of the FOV using the slanted edge test. b, MTF at different indicated FOV positions relative to the center. c, MTF contrast at 10% (MTF10) across the FOV. Displayed values are averages across similar FOV locations and horizontal and vertical slanted edge measurements. Spatial frequencies were converted to line widths. The data in c are from n = 2 and n = 4 measurements at 0 μm, and ±804 μm and ±1482 μm, respectively. The bar plot is presented as mean ± s.e.m. The larger error bars toward the FOV edge likely indicate sample tilt.
Extended Data Fig. 4 ∣. Wearable macroscopes with custom-compound microlenses offer an extended depth of field.
a,c, Schematics of the experimental approach. A wild-type mouse was prepared with a lumbar spinal window, injected retroorbitally with FITC-dextran (2% w/v), and imaged with both the wearable macroscope (a–b) and a two-photon microscope (c–d) under anesthesia. b, Average intensity image from a time-lapse recording acquired with the wearable macroscope at a set focal depth. Images were acquired at 45 fps (Supplementary Video 1). A 45-frame/1-s average is shown. Scale bar, 500 μm. d, Right, example images from a two-photon z stack acquired with 1 μm axial step size at the FOV location indicated in a (yellow box). z = 0 μm denotes the tissue surface. Each image represents a 2-frame/1-s average. Scale bar, 500 μm. Left, maximum-intensity projection image over a 70 μm-thick tissue volume. Scale bar, 250 μm. e, Comparison of the macroscope (top) and two-photon maximum intensity projection images of various z extent (bottom; 40 μm thickness) reveals that the wearable device has a ~40 μm depth of field. The green box indicates an example microvessel seen in both the one- and two-photon data, whereas the blue box indicates a capillary seen only in two-photon images at tissue depths exceeding 40 μm. Scale bars, 250 μm. All images are representatives from one sample. Images with similar properties were obtained across multiple independent samples or regions.
Extended Data Fig. 5 ∣. Wearable macroscopes with custom-compound microlenses offer a ~2.7 mm working distance permitting imaging through implanted microprisms.
a,b, Schematics showing the experimental approach for characterizing and comparing two imaging conditions in scattering tissue phantoms (Methods): Top, imaging through a coverslip; bottom, imaging through a coverslip with an attached 2.0 mm × 2.0 mm × 2.0 mm microprism (W × D × H) with a reflective, enhanced aluminum coating on the hypotenuse. c,d, Example images of tissue phantom embedded 6 μm-diameter fluorescent beads. Each image is a maximum intensity projection through a z stack acquired as shown in a–b by translating the wearable macroscope axially. Scale bar, 500 μm. e,f, Maximum intensity side projections of the acquired z stacks. Scale bar, 200 μm. g,h, Bead contrast as a function of imaging depth. Michelson contrast is defined as (peak − background)/(peak + background) and, therefore, unitless. i,j, Lateral FWHM of the 6 μm-diameter fluorescent beads as a function of imaging depth. All images are representatives from one sample. Images with similar properties were obtained across multiple independent samples.
Extended Data Fig. 6 ∣. Spine-mounted macroscopes of <10 g and low center of gravity have little effect on mouse open-field behavior.
a,e,g, Schematics of the open-field test and analysis approach used to compare the animal’s general locomotor activity with or without the ~9.8 g macroscope mounted to its lumbar spinal cord following a 3–5 d habituation period. b–d,f,h, Population data from all animals (N = 5) and analysis periods (six consecutive 5-min recordings per animal) (left) or only the first and last five minutes (right) of the 35–40 min recordings for each condition (mounted, unmounted) (Methods). Evaluated parameters included the animal’s total distance traveled (b), average running speed (c), rearing activity (d), inner versus outer zone occupancy (f), and quadrant/zone 1–4 occupancy (h). Paired two-sided t-tests determined P values (b, left: 0.1226; b, right: 0.0944, 0.0814; c, left: 0.1465; c, right: 0.5371, 0.3636; d, left: 0.1214; d, right: 0.6317, 0.3271; f, left: 0.0158, 0.1456, 0.2056, 0.0146; f, right: 0.8970, 0.7451, 0.7738, 0.7166; h, left: 0.6676, 0.7382, 0.7114, 0.7215; h, right: 0.5705, 0.8128, 0.6599, 0.8191, 0.1716, 0.6295, 0.2200, 0.2402). All data are presented as mean ± s.e.m.
Extended Data Fig. 7 ∣. Wearable macroscopes with custom-compound microlenses resolve cell bodies and processes in live CX3CR1-GFP mice.
a, Fluorescence image showing microglia in an anesthetized CX3CR1-GFP mouse acquired with the wearable macroscope. Scale bar, 250 μm. b, Zoom-ins of the two subregions indicated in a. Scale bars, 100 μm. c, Zoom-ins of the four subregions indicated in b. Individual microglial cell bodies and processes are indicated (closed and open arrowheads, respectively). Scale bars, 10 μm. All images are representatives from one sample. Images with similar properties were obtained across multiple independent samples. For corresponding data from freely behaving mice, see Extended Data Fig. 8g-i and Supplementary Video 2.
Extended Data Fig. 8 ∣. Stable trans-segmental imaging in focally restrained and freely moving CX3CR1-GFP mice.
a,d,g, Average intensity projection images from time-lapse recordings in focally restrained (a,d) or freely behaving CX3CR1-GFP mice (g) (Supplementary Videos 2, 4) overlaid with ~10 μm × 10 μm ROIs. Only ‘active’ ROIs above the indicated ΔF/F thresholds are shown. The chosen ΔF/F thresholds are based on image noise levels, depend on fluorescent indicator expression and were consistently applied across all animals of the same strain. b,e,h, Top, animal behaviors (turning, locomotion) and sensory stimulus application (tail pinch) during the example recordings shown in a,d,g and Supplementary Videos 2, 4. Center, all computationally identified ‘active’ ROIs. Bottom, 500 representative inactive ROIs. Locomotor activity evoked sparse, distributed, and synchronized transients with onset, offset, and plateau kinetics in CX3CR1-GFP mice distinct from cellular activity seen in CX3CR1-GCaMP5g-tdTomato animals (Extended Data Fig. 9). These false positives tended to occur more frequently or with larger amplitude in focally restrained (a and d) compared to freely behaving mice (g), likely due to the larger forces acting on the spinal implant during running when restrained. c,f,i, Population analysis of false positive ratios (‘active’ ROIs/total ROIs) for focally restrained or freely behaving CX3CR1-GFP mice. The data in c, f, and i are from 4, 13, and 19 trials with comparable behavior or stimuli. All data are presented as mean ± s.e.m. (c, 0.82 ± 0.38; f, 0.57 ± 0.17; i, 0). Data with functional calcium indicator expression are shown in Extended Data Fig. 9 and Supplementary Video 5.
Extended Data Fig. 9 ∣. High-speed trans-segmental imaging of microglia calcium activity in freely moving CX3CR1-GCaMP5g-tdTomato mice.
a,c,e,g, Maximum intensity projection images from four example time-lapse recordings in a freely behaving CX3CR1-GCaMP5g-tdTomato mouse ~5 weeks after tamoxifen injection (Supplementary Fig. 1; Supplementary Video 5) overlaid with ~10 μm × 10 μm ROIs. The recordings, which show microglia calcium activity during animal rest, tail pinch, locomotion, and turning were acquired over a ~105 min period after macroscope mounting. Only active ROIs above the indicated ΔF/F thresholds are shown. The chosen ΔF/F thresholds are based on image noise levels, depend on fluorescent indicator expression, and were consistently applied across all animals of the same strain. b,d,f,h, Top, turning motion, pressure stimulus amplitude, and locomotor activity during the example recordings shown in a, c, e, and g and Supplementary Video 5. Center, all computationally identified active ROIs. Bottom, 500 representative inactive ROIs. The spatiotemporal properties of these microglial single-cell and population calcium activities are distinct from motion-induced artifacts in CX3CR1-GFP mice (Extended Data Fig. 8; Supplementary Video 2).
Extended Data Fig. 10 ∣. High-speed trans-segmental imaging of sensory-evoked calcium activity in freely behaving GFAP-GCaMP6f mice.
a,b, Average intensity projection images from a time-lapse recording in a freely moving GFAP-GaMP6f mouse (Supplementary Video 8) taken at ~50 μm focal depth below the pia overlaid with ~10 μm × 10 μm ROIs. Only active ROIs above the indicated ΔF/F thresholds in response to an innocuous tail pinch/touch (p < 200 g) (a) or a noxious tail pinch (>500 g) (b) are shown. Like in focally restrained mice (Fig. 2), innocuous tail pinch/touch evoked only sparse activity across spinal segments, while noxious pinch resulted in widespread, bilateral astrocyte excitation. c, Innocuous tail pinch/touch and noxious tail pinch-evoked calcium activity (bottom) for the example recording shown in a–b. Each row depicts the percent of active ROIs across a given mediolateral (Y) position. The corresponding pressure stimulus, locomotor activity, and average calcium transient across the FOV are shown above the activity heat map. Innocuous tail touch/pinch and noxious pinch onsets are indicated by gray vertical lines. d, Population data showing the percent of active ROIs for innocuous and noxious stimulus trials. e, Population data showing the average calcium transient onset latency for noxious pinch trials across all, anterior, or posterior regions (Methods). f,g, Population data showing the individual ROI and average calcium response amplitude (f) and duration (g) for noxious pinch trials. Only 0.4% of ROIs had a transient longer than 6 s. h,i, Population data showing the average calcium transient amplitude (h) and duration (i) on the left and right sides of the spinal cord for noxious pinch trials. The data in d–i are from 11 innocuous and 8 noxious pinch trials in 2 mice. The data in f and g (left) are from 124,928 ROIs with ΔF/F > 20%, 8 recordings, and 2 mice. Paired two-sided t-tests determined P values (e: 0.2431, 0.1231, 0.2131; h: 0.3521; i: 0.5216), and all bar plots are presented as mean ± s.e.m. The box and whisker plots mark the median and the 25th and 75th percentiles, and the whiskers cover the minimum and maximum of the data.
Supplementary Material
Acknowledgements
We thank J. E. Ford for advice on optical design, B. Piatt and J. Warda for help with tolerancing and lens fabrication, G. Zera for feedback on housing design, M. Ikeda for guidance on optical characterizations, B. Temple and E. Sanders for help with linear treadmill testing, N. Andrews of the Salk Behavior Testing Core and the Salk machine shop for technical support, J. Chambers for mouse colony management and members of the Nimmerjahn lab for feedback and suggestions. Artwork in Fig. 2a and Extended Data Figs. 4a,c and 6a was created with Biorender.com. This work was primarily supported by the NIH grant R01NS108034 (A. Nimmerjahn) and was partially supported by the NIH grants U01NS103522, U19NS112959 and U19NS123719, a Salk Innovation Grant, The Sol Goldman Charitable Trust and equipment funds from C. and L. Greenfield (A. Nimmerjahn). P. Shekhtmeyster was supported by a Rose Hills Foundation graduate fellowship, and N. A. Nelson was supported by funds from an NIH T32/CMG Training Grant, a Burt and Ethel Aginsky Research Scholar Award, a Kavli-Helinski Endowment Graduate Fellowship and an NIH individual predoctoral fellowship (F31NS120619). The content is solely the authors’ responsibility and does not necessarily represent the official views of the NIH.
Footnotes
Online content
Any methods, additional references, Nature Portfolio reporting summaries, source data, extended data, supplementary information, acknowledgements, peer review information; details of author contributions and competing interests; and statements of data and code availability are available at https://doi.org/10.1038/s41587-023-01700-3.
Reporting summary
Further information on research design is available in the Nature Portfolio Reporting Summary linked to this article.
Competing interests
The authors declare no competing interests.
Extended data is available for this paper at https://doi.org/10.1038/S41587-023-01700-3.
Supplementary information The online version contains supplementary material available at https://doi.org/10.1038/s41587-023-01700-3.
Data availability
Additional (for example, raw image) data that support the findings of this study are available from the corresponding author. Because of their size, they can only be shared on reasonable request. Source data are provided with this paper.
Code availability
The custom software or code generated during the current study is available from the corresponding author. Because it requires expert guidance for proper use, it will be shared on reasonable request.
References
- 1.Koch SC, Acton D & Goulding M Spinal circuits for touch, pain, and itch. Annu. Rev. Physiol. 80, 189–217 (2018). [DOI] [PMC free article] [PubMed] [Google Scholar]
- 2.Nelson NA, Wang X, Cook D, Carey EM & Nimmerjahn A Imaging spinal cord activity in behaving animals. Exp. Neurol 320, 112974 (2019). [DOI] [PMC free article] [PubMed] [Google Scholar]
- 3.Abraira VE & Ginty DD The sensory neurons of touch. Neuron 79, 618–639 (2013). [DOI] [PMC free article] [PubMed] [Google Scholar]
- 4.Harrison M et al. Vertebral landmarks for the identification of spinal cord segments in the mouse. NeuroImage 68, 22–29 (2013). [DOI] [PubMed] [Google Scholar]
- 5.Aharoni D & Hoogland TM Circuit investigations with open-source miniaturized microscopes: past, present and future. Front. Cell. Neurosci 13, 141 (2019). [DOI] [PMC free article] [PubMed] [Google Scholar]
- 6.Chen S et al. Miniature fluorescence microscopy for imaging brain activity in freely-behaving animals. Neurosci. Bull 36, 1182–1190 (2020). [DOI] [PMC free article] [PubMed] [Google Scholar]
- 7.Scott BB et al. Imaging cortical dynamics in GCaMP transgenic rats with a head-mounted widefield macroscope. Neuron 100, 1045–1058 (2018). [DOI] [PMC free article] [PubMed] [Google Scholar]
- 8.Rynes ML et al. Miniaturized head-mounted microscope for whole-cortex mesoscale imaging in freely behaving mice. Nat. Methods 18, 417–425 (2021). [DOI] [PMC free article] [PubMed] [Google Scholar]
- 9.Guo C et al. Miniscope-LFOV: a large field of view, single cell resolution, miniature microscope for wired and wire-free imaging of neural dynamics in freely behaving animals. Preprint at bioRxiv 10.1101/2021.1111.1121.469394 (2021). [DOI] [PMC free article] [PubMed] [Google Scholar]
- 10.Leman DP et al. Large-scale cellular-resolution imaging of neural activity in freely behaving mice. Preprint at bioRxiv 10.1101/2021.01.15.426462 (2022). [DOI] [Google Scholar]
- 11.Sekiguchi KJ et al. Imaging large-scale cellular activity in spinal cord of freely behaving mice. Nat. Commun 7, 11450 (2016). [DOI] [PMC free article] [PubMed] [Google Scholar]
- 12.Kohro Y et al. Spinal astrocytes in superficial laminae gate brainstem descending control of mechanosensory hypersensitivity. Nat. Neurosci 23, 1376–1387 (2020). [DOI] [PubMed] [Google Scholar]
- 13.Xu Q et al. Astrocytes contribute to pain gating in the spinal cord. Sci. Adv 7, eabi6287 (2021). [DOI] [PMC free article] [PubMed] [Google Scholar]
- 14.Nam Y et al. Reversible induction of pain hypersensitivity following optogenetic stimulation of spinal astrocytes. Cell Rep. 17, 3049–3061 (2016). [DOI] [PubMed] [Google Scholar]
- 15.Nimmerjahn A, Kirchhoff F & Helmchen F Resting microglial cells are highly dynamic surveillants of brain parenchyma in vivo. Science 308, 1314–1318 (2005). [DOI] [PubMed] [Google Scholar]
- 16.Merten K, Folk RW, Duarte D & Nimmerjahn A Astrocytes encode complex behaviorally relevant information. Preprint at bioRxiv 10.1101/2021.10.09.463784 (2021). [DOI] [Google Scholar]
- 17.Zhou P et al. Efficient and accurate extraction of in vivo calcium signals from microendoscopic video data. eLife 7, e28728 (2018). [DOI] [PMC free article] [PubMed] [Google Scholar]
- 18.Giovannucci A et al. CaImAn an open source tool for scalable calcium imaging data analysis. eLife 8, e38173 (2019). [DOI] [PMC free article] [PubMed] [Google Scholar]
- 19.Ceto S, Sekiguchi KJ, Takashima Y, Nimmerjahn A & Tuszynski MH Neural stem cell grafts form extensive synaptic networks that integrate with host circuits after spinal cord injury. Cell Stem Cell 27, 430–440 (2020). [DOI] [PMC free article] [PubMed] [Google Scholar]
- 20.Kondo T et al. Calcium transient dynamics of neural ensembles in the primary motor cortex of naturally behaving monkeys. Cell Rep. 24, 2191–2195 (2018). [DOI] [PubMed] [Google Scholar]
- 21.Rieder P et al. Astrocytes and microglia exhibit cell-specific Ca2+ signaling dynamics in the murine spinal cord. Front. Mol. Neurosci 15, 840948 (2022). [DOI] [PMC free article] [PubMed] [Google Scholar]
- 22.Goldey GJ et al. Removable cranial windows for long-term imaging in awake mice. Nat. Protoc 9, 2515–2538 (2014). [DOI] [PMC free article] [PubMed] [Google Scholar]
- 23.Dubbs A, Guevara J & Yuste R moco: fast motion correction for calcium imaging. Front. Neuroinform 10, 6 (2016). [DOI] [PMC free article] [PubMed] [Google Scholar]
- 24.Patriarchi T et al. Ultrafast neuronal imaging of dopamine dynamics with designed genetically encoded sensors. Science 360, eaat4422 (2018). [DOI] [PMC free article] [PubMed] [Google Scholar]
Associated Data
This section collects any data citations, data availability statements, or supplementary materials included in this article.
Supplementary Materials
Data Availability Statement
Additional (for example, raw image) data that support the findings of this study are available from the corresponding author. Because of their size, they can only be shared on reasonable request. Source data are provided with this paper.
The custom software or code generated during the current study is available from the corresponding author. Because it requires expert guidance for proper use, it will be shared on reasonable request.


