In clinical practice electrocardiography is most often used to evaluate patients with suspected ischaemic heart disease. When interpreted in the light of the clinical history, electrocardiograms can be invaluable in aiding selection of the most appropriate management.
Electrocardiography is not sufficiently specific or sensitive to be used without a patient's clinical history
Electrocardiography has limitations. A trace can suggest, for example, that a patient's heart is entirely normal when in fact he or she has severe and widespread coronary artery disease. In addition, less than half of patients presenting to hospital with an acute myocardial infarction will have the typical and diagnostic electrocardiographic changes present on their initial trace, and as many as 20% of patients will have a normal or near normal electrocardiogram.
Myocardial ischaemia causes changes in the ST-T wave, but unlike a full thickness myocardial infarction it has no direct effects on the QRS complex (although ischaemia may give rise to bundle branch blocks, which prolongs the QRS complex).
When electrocardiographic abnormalities occur in association with chest pain but in the absence of frank infarction, they confer prognostic significance. About 20% of patients with ST segment depression and 15% with T wave inversion will experience severe angina, myocardial infarction, or death within 12 months of their initial presentation, compared with 10% of patients with a normal trace.
Changes in the ST segment and T waves are not specific for ischaemia; they also occur in association with several other disease processes, such as left ventricular hypertrophy, hypokalaemia, and digoxin therapy.
T wave changes
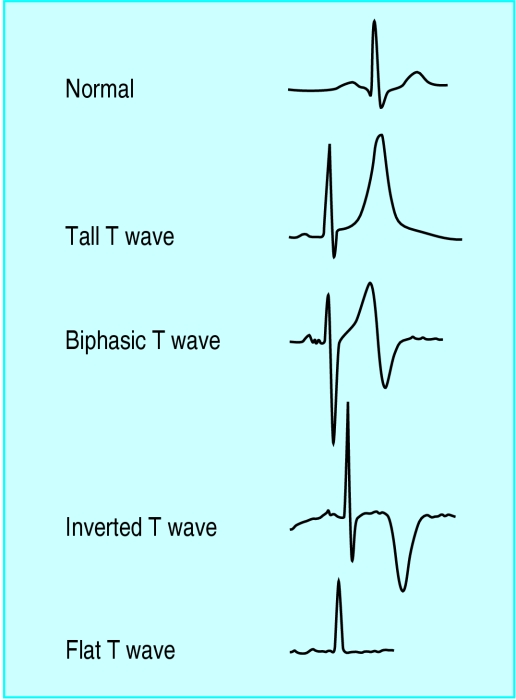
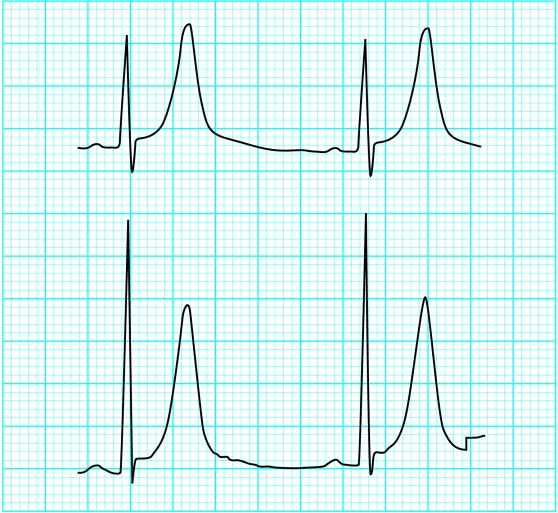
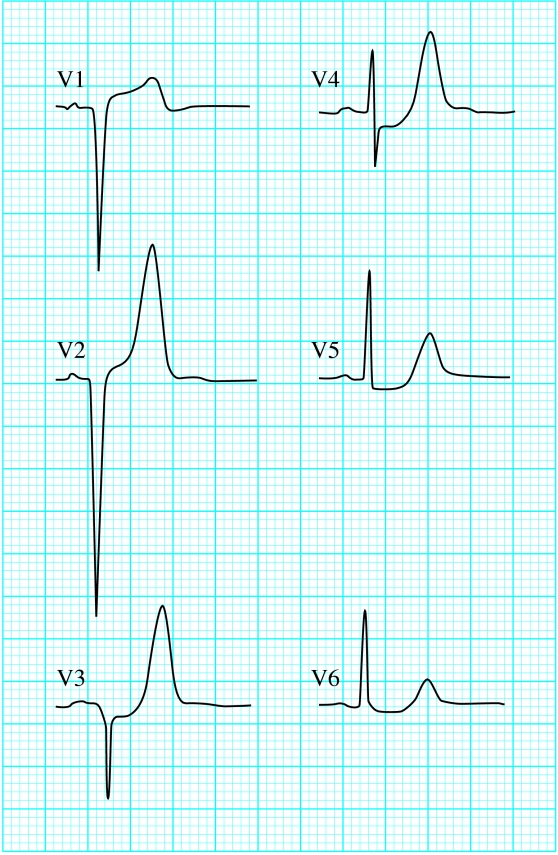
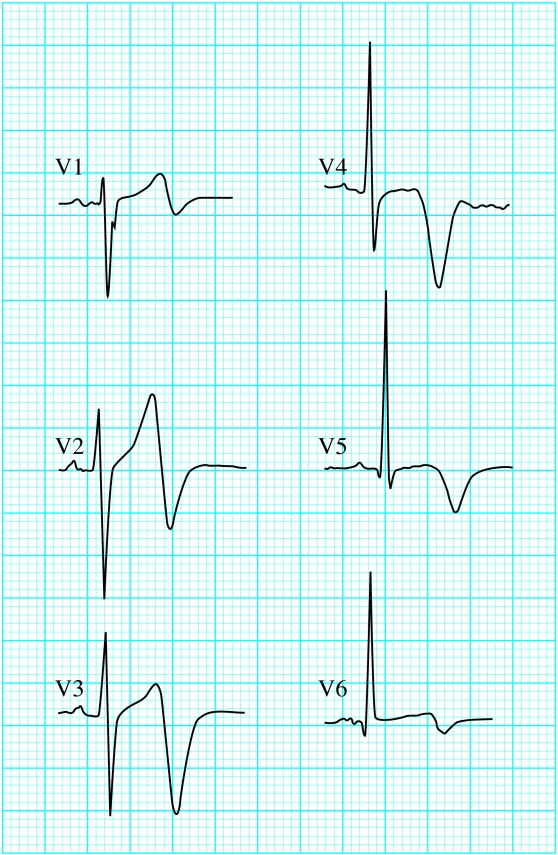
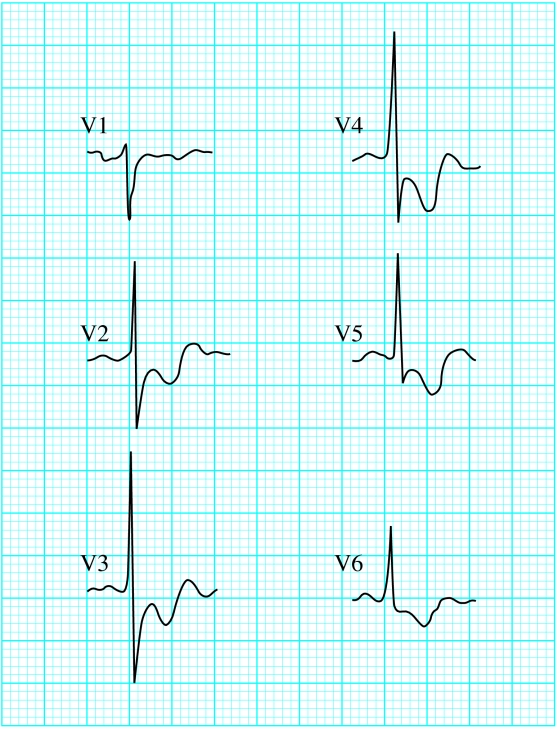
Myocardial ischaemia can affect T wave morphology in a variety of ways: T waves may become tall, flattened, inverted, or biphasic. Tall T waves are one of the earliest changes seen in acute myocardial infarction, most often seen in the anterior chest leads. Isolated tall T waves in leads V1 to V3 may also be due to ischaemia of the posterior wall of the left ventricle (the mirror image of T wave inversion).
Suggested criteria for size of T wave
1/8 size of the R wave
<2/3 size of the R wave
Height <10 mm
As there are other causes of abnormally tall T waves and no commonly used criteria for the size of T waves, these changes are not always readily appreciated without comparison with a previous electrocardiogram. Flattened T waves are often seen in patients with myocardial ischaemia, but they are very non-specific.
T wave inversion
T wave inversion can be normal
It occurs in leads III, aVR, and V1 (and in V2, but only in association with T wave inversion in lead V1)
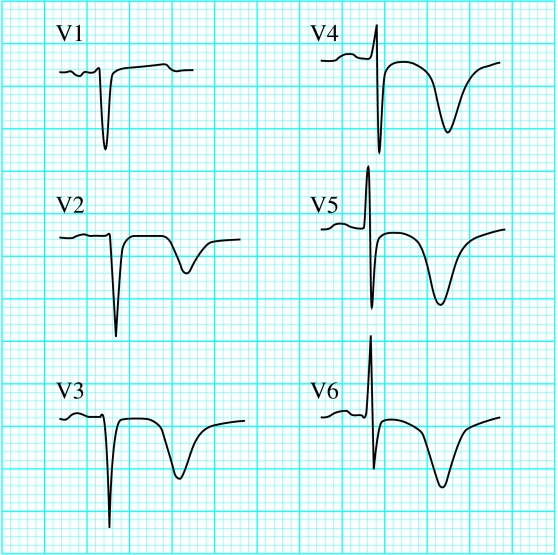
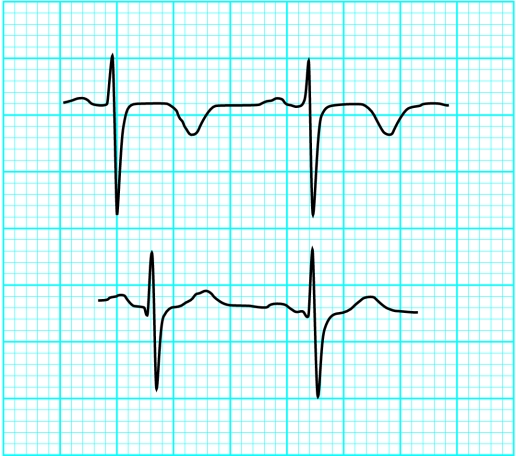
Myocardial ischaemia may also give rise to T wave inversion, but it must be remembered that inverted T waves are normal in leads III, aVR, and V1 in association with a predominantly negative QRS complex. T waves that are deep and symmetrically inverted (arrowhead) strongly suggest myocardial ischaemia.
In some patients with partial thickness ischaemia the T waves show a biphasic pattern. This occurs particularly in the anterior chest leads and is an acute phenomenon. Biphasic T wave changes usually evolve and are often followed by symmetrical T wave inversion. These changes occur in patients with unstable or crescendo angina and strongly suggest myocardial ischaemia.
ST segment depression
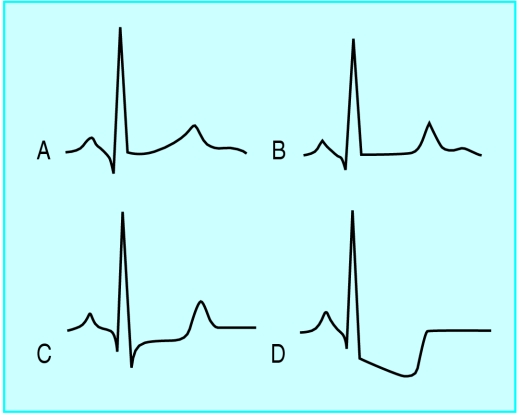
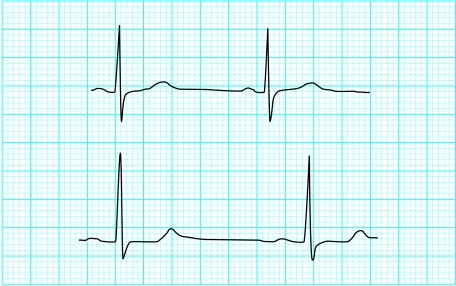
Typically, myocardial ischaemia gives rise to ST segment depression. The normal ST segment usually blends with the T wave smoothly, making it difficult to determine where the ST segment ends and the T wave starts. One of the first and most subtle changes in the ST segment is flattening of the segment, resulting in a more obvious angle between the ST segment and T wave.
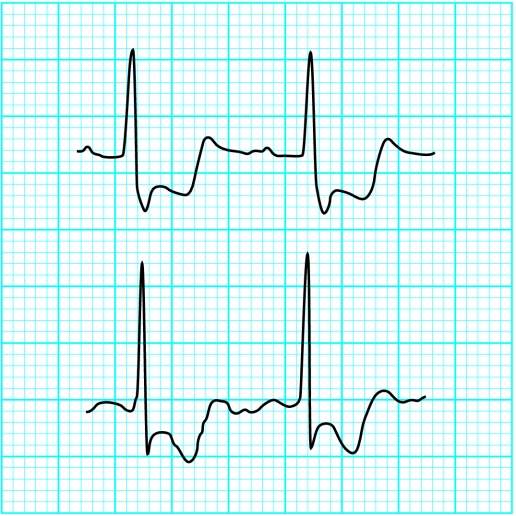
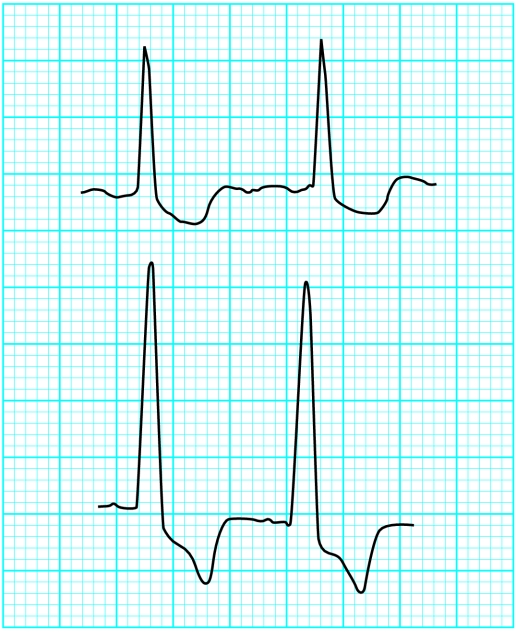
More obvious changes comprise ST segment depression that is usually planar (horizontal) or downsloping. Whereas horizontal ST depression strongly suggests ischaemia, downsloping changes are less specific as they are also found in association with left ventricular hypertrophy and in patients taking digoxin. The degree of ST segment depression in any given lead is related to the size of the R wave. Thus, ST segment depression is usually most obvious in leads V4 to V6 of the 12 lead electrocardiogram. Moreover, because the height of the R wave varies with respiration, the degree of ST depression in any one lead may vary from beat to beat. ST segment depression is usually not as marked in the inferior leads because here the R waves tend to be smaller. Substantial (⩾2 mm) and widespread (⩾2 leads) ST depression is a grave prognostic finding as it implies widespread myocardial ischaemia from extensive coronary artery disease. ST segment depression may be transient, and its resolution with treatment is reassuring. Modern equipment allows continuous ST segment monitoring. Serial changes in the electrocardiogram over a few hours or days, especially when the changes are associated with recurrent chest pain, are extremely helpful in confirming the presence of ischaemic heart disease; serial changes confer a worse prognosis, indicating the need for increased drug treatment or revascularisation interventions.
ST segment elevation
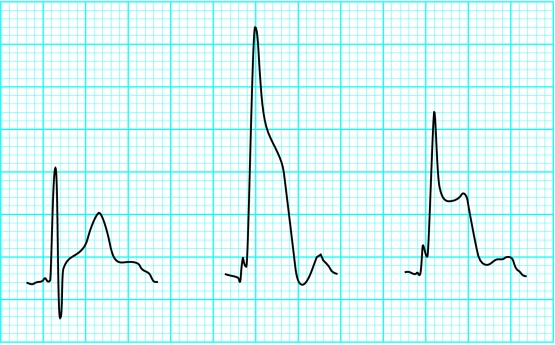
Transient ST segment elevation in patients with chest pain is a feature of ischaemia and is usually seen in vasospastic (variant or Prinzmetal's) angina. A proportion of these patients, however, will have substantial proximal coronary artery stenosis. When ST segment elevation has occurred and resolved it may be followed by deep T wave inversion even in the absence of enzyme evidence of myocardial damage.
In patients with previous Q wave myocardial infarction the hallmark of new ischaemia is often ST segment elevation. This is thought to be associated with a wall motion abnormality, or bulging of the infarcted segment. It rarely indicates reinfarction in the same territory. When an electrocardiogram shows persistent T wave inversion accompanying the changes of a previous acute myocardial infarction, ischaemia in the same territory may cause “normalisation” of the T waves (return to an upright position). Alternatively, further ischaemia may make the T wave inversion more pronounced.
Arrhythmias associated with acute myocardial ischaemia or infarction
Ventricular myocardial ischaemia may be arrhythmogenic, and extrasystoles are common. It used to be thought that frequent extrasystoles of multifocal origin, bigeminy, couplets, or extrasystoles that fell on the T wave (R on T) conferred a bad prognosis in the early hours of myocardial infarction and predicted the onset of ventricular fibrillation. Clinical trials have clearly shown, however, that their suppression by antiarrhythmic drugs had no effect on the frequency of subsequent ventricular fibrillation.
Short runs of ventricular tachycardia are a bad prognostic sign and should probably be treated
Ventricular fibrillation is the commonest unheralded fatal arrhythmia in the first 24 hours of acute myocardial infarction. The prognosis depends almost entirely on the patient's proximity to skilled medical help when the arrhythmia occurs. Cardiac arrest from ventricular fibrillation outside hospital is associated with a long term survival of about 10%, compared with an initial survival of 90% when cardiac arrest occurs after admission to a coronary care unit. Studies have shown that the key factor in prognosis is the speed with which electrical defibrillation is delivered.
Tachycardias of supraventricular origin, with the exception of atrial fibrillation, are uncommon after myocardial infarction. Atrial fibrillation occurs in about 10% of patients and is more common in those with heart failure, diabetes, and valvular heart disease. It may be transient or persistent and is often a marker of haemodynamic instability
Heart block
The artery supplying the atrioventricular node is usually a branch of the right coronary artery; less commonly it originates from the left circumflex artery. In patients with proximal occlusion of the right coronary artery causing an inferior infarction, the atrioventricular node's arterial supply may be compromised resulting in various degrees of heart block. Atrioventricular block may be severe at first but usually improves over subsequent days. Complete atrioventricular block usually gives way to second degree and then first degree block. Although temporary transvenous cardiac pacing may be necessary for patients who are haemodynamically compromised, it is not mandatory in stable patients.
When complete atrioventricular block occurs in association with acute anterior myocardial infarction, transvenous cardiac pacing is recommended
Profound bradycardia or atrioventricular block resulting from ischaemia may provoke an escape rhythm. Such rhythms are the result of spontaneous activity from a subsidiary pacemaker located within the atria, atrioventricular junction, or ventricles. An atrioventricular junction escape beat has a normal QRS complex morphology, with a rate of 40-60 beats/min. A ventricular escape rhythm is broad complex and generally slower (15-40 beats/min).
Figure.
T wave changes associated with ischaemia
Figure.
Tall T waves in leads V2 and V3 in patient with recent inferoposterior myocardial infarction, indicating posterior ischaemia
Figure.
Tall T waves in myocardial ischaemia
Figure.
Arrowhead T wave inversion in patient with unstable angina
Figure.
Biphasic T waves in man aged 26 with unstable angina
Figure.
ST changes with ischaemia showing normal wave form (A); flattening of ST segment (B), making T wave more obvious; horizontal (planar) ST segment depression (C); and downsloping ST segment depression (D)
Figure.
Subtle ST segment change in patient with ischaemic chest pain: when no pain is present (top) and when in pain (bottom)
Figure.
Substantial ST segment depression in patient with ischaemic chest pain
Figure.
Widespread ST segment depression in patient with unstable angina
Figure.
Non-ischaemic ST segment changes: in patient taking digoxin (top) and in patient with left ventricular hypertrophy (bottom)
Figure.
Normalisation of longstanding inverted T waves in patient with chest pain
Figure.
Reversible ST segment changes in patient with chest pain; the ST segment elevation returns to normal as the chest pain settles
Figure.
R on T, giving rise to ventricular fibrillation
Figure.
Acute myocardial infarction with complete heart block
Footnotes
Kevin Channer is consultant cardiologist at the Royal Hallamshire Hospital, Sheffield.
The ABC of clinical electrocardiography is edited by Francis Morris, consultant in emergency medicine at the Northern General Hospital, Sheffield; June Edhouse, consultant in emergency medicine, Stepping Hill Hospital, Stockport; William J Brady, associate professor, programme director, and vice chair, department of emergency medicine, University of Virginia, Charlottesville, VA, USA; and John Camm, professor of clinical cardiology, St George's Hospital Medical School, London. The series will be published as a book in the summer.


