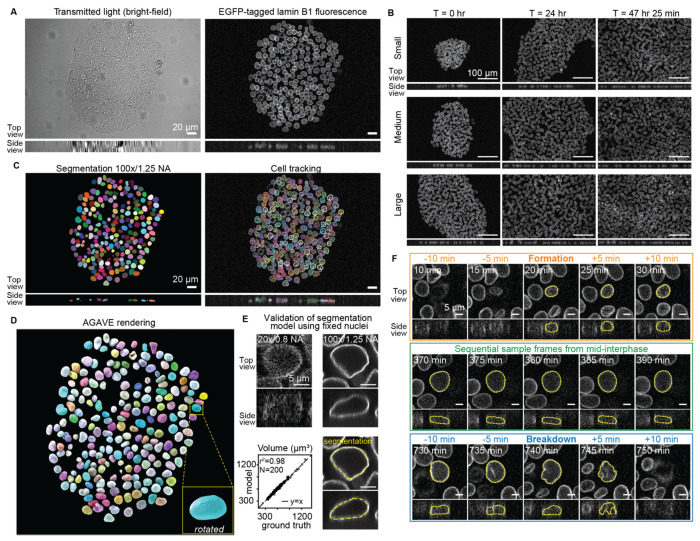
Figure 1. A high-throughput automated workflow to capture highly resolved quantitative features of nuclear shape dynamics in growing hiPS cell colonies.
See Methods and Supplemental Fig. S1 and S2 for more details. A. Representative images were generated from the four hour time point of a 20x/0.8 NA, 3D timelapse movie of the Medium hiPS cell colony shown in B. The associated timelapse is provided in Movie S1. Left: Top and side views (middle slice) of the transmitted light bright-field z-stack. Right: Top and side views (maximum intensity projection and middle slice, respectively) of the lamin B1-mEGFP fluorescence z-stack. B. Top and side views (maximum intensity projection and middle slice, respectively) of 20x/0.8 NA, lamin B1-mEGFP images from timelapse imaging of three colonies with different starting sizes, referred to as Small, Medium and Large. Representative images shown for the 0, 24 and 47 hour and 25 minute timepoints. The associated bright-field and fluorescence timelapses for each colony are provided in Movies S1, S2 and S3 and are available for interactive viewing at http://volumeviewer.allencell.org. C. Left: Top and side view (maximum projection and middle slice, respectively) of nuclear segmentations of the images in A. The associated colored segmentation timelapses for each colony are provided in Movies S4, S5 and S6 and are available for interactive viewing together with the bright-field and fluorescence timelapses at volumeviewer.allencell.org. Right: Top and side view (maximum intensity projection and middle slice, respectively) of the mEGFP-tagged lamin B1fluorescence overlaid with the segmentation outline. The tracked centroid location of the 5 timepoints prior are shown for each segmented nucleus as a thin line. Colors indicate different instance segmentations of nuclei for easier viewing. D. AGAVE 3D visual rendering of the nuclear segmentations to highlight their 3D shape. Inset shows an enlarged and rotated view of the nucleus in the yellow box for visualization. E. Top, Left: Top and side view (middle slices) of the lamin B1-mEGFP fluorescence of fixed single nucleus crop imaged at 20x/0.8 NA (Methods). Top, Right: Top and side view (middle slices) of the same fixed single nucleus crop imaged at 100x/1.25 NA. Bottom, Right: Top and side views (middle slices) of the fixed single nucleus crop overlaid with the predicted 3D segmentation (yellow dashed outline). Bottom, Left: Volumes measured from the model-predicted segmentations from 20x/0.8 NA fixed nuclei compared to ground truth segmentations of the same fixed nuclei at 100x/1.25 NA. F. Automated prediction of lamin shell formation and breakdown timepoints for identifying full-interphase nuclear trajectories based on lamin B1-mEGFP images. Top and side views (maximum intensity projection and middle slice, respectively) of 20x/0.8 NA, lamin B1 mEGFP images of a single nucleus at the predicted formation (center, top) and breakdown (center, bottom) timepoints, with two preceding (left) and following (right) timepoints. Also shown is the middle of interphase (middle). Nuclear segmentation outlines for fully formed lamin shells are in yellow.

