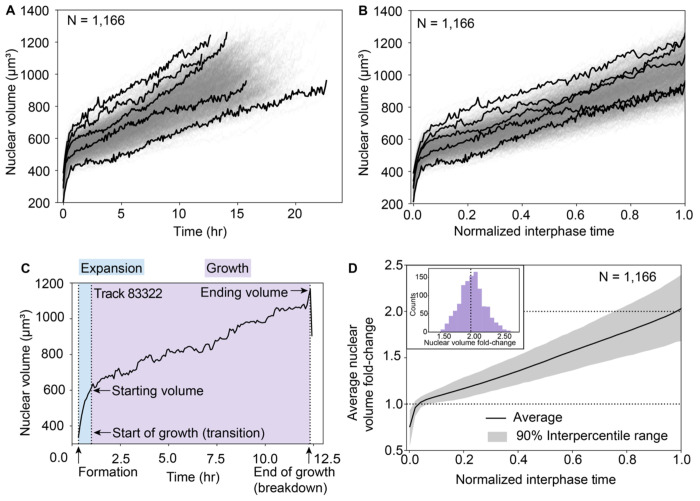
Figure 4. Nuclear volume trajectories consistently contain two phases and, on average, double in volume over the growth phase that spans most of interphase.
A and B. Volume trajectories for all nuclei in the full-interphase analysis dataset, shown over real time synchronized by the time of lamin shell formation (A) and normalized interphase time (B). All 1,166 trajectories are shown in transparent gray and five trajectories are shown in black to highlight some of the variation in individual nuclear growth. C. A sample nuclear volume trajectory from formation to breakdown. The calculated transition point (Methods) defines the transition between a short, rapid nuclear expansion (“expansion”, shaded blue) and a longer, slower growth period (“growth”, shaded purple, begins at the “start of growth”). The “starting volume” and “ending volume” are the nuclear volumes at the start of growth (transition) and end of growth (breakdown). D. The average nuclear volume fold-change and 90% interpercentile range of full-interphase nuclear trajectories, synchronized by the time of shell formation and rescaled to normalized interphase time. Nuclear volumes at the start of growth were normalized to 1. Dashed reference lines at nuclear volume fold-change of 1 (start of growth) and 2 (doubling from the start of growth). Inset shows the distribution of nuclear volume fold-change for the population.

