Abstract
Brain metastases represent an important clinical problem for patients with small-cell lung cancer (SCLC). However, the mechanisms underlying SCLC growth in the brain remain poorly understood. Here, using intracranial injections in mice and assembloids between SCLC aggregates and human cortical organoids in culture, we found that SCLC cells recruit reactive astrocytes to the tumour microenvironment. This crosstalk between SCLC cells and astrocytes drives the induction of gene expression programmes that are similar to those found during early brain development in neurons and astrocytes. Mechanistically, the brain development factor Reelin, secreted by SCLC cells, recruits astrocytes to brain metastases. These astrocytes in turn promote SCLC growth by secreting neuronal pro-survival factors such as SERPINE1. Thus, SCLC brain metastases grow by co-opting mechanisms involved in reciprocal neuron–astrocyte interactions during brain development. Targeting such developmental programmes activated in this cancer ecosystem may help prevent and treat brain metastases.
The ability of cancer cells to metastasize is a major cause of morbidity and mortality in cancer1. In particular, brain metastases are much more frequent than primary brain tumours and occur in 30–40% of all patients with cancer2,3. Advancing brain metastasis treatment requires a deeper understanding of cancer cell growth in the unique brain microenvironment. Although some insights have been gained4–9, the mechanisms underlying brain metastasis growth remain largely unsolved10 and improved preclinical models are needed11.
SCLC is a highly metastatic neuroendocrine carcinoma that accounts for around 200,000 deaths worldwide every year12. Brain metastases are particularly frequent in patients with SCLC13. Notably, 15–20% of patients first diagnosed with SCLC already have brain metastases, and the incidence increases to 40–60% during disease progression14–16. Brain metastases are such a central clinical feature of SCLC that prophylactic cranial irradiation protocols have been implemented17,18. Nevertheless, the overall survival of patients with SCLC with brain metastases remains dismal19,20.
Some studies have begun to investigate how SCLC cells seed micro-metastases to the brain21–24, but very little is known about how SCLC cells grow in the brain. This is largely due to a paucity of human samples available for analysis19,25. Furthermore, SCLC xenograft models rarely metastasize to the brain but rather develop leptomeningeal disease26, and genetically engineered mouse models of SCLC have a very low incidence of brain metastases27.
Here we focused on the clinical challenge of established SCLC brain metastases. By injecting SCLC cells intracranially into mice and using a co-culture assembloid approach with human cortical organoids, we observed crucial crosstalk between SCLC cells and reactive astrocytes. This interaction promotes SCLC growth in the brain, mimicking the neuroprotective role of astrocytes during brain development. This unique cancer ecosystem provides a framework to target patients with established SCLC brain metastases.
Results
Brain development programmes in SCLC brain metastases
To investigate SCLC growth in the brain, we initially injected N2N1G and 16T mouse SCLC cells into the striatum of NSG immunodeficient mice, modelling a common metastasis location in SCLC28. The mice developed parenchymal tumours that were histopathologically similar to human SCLC brain metastases (Extended Data Fig. 1a–d), with occasional leptomeningeal and ventricular diseases, similar to patients with SCLC29,30. By contrast, intracardiac and intracarotid injections generated liver metastases and, in some cases, extracranial leptomeningeal disease, but no intracranial brain metastases (Extended Data Fig. 1e–g). All subsequent analyses were based on parenchymal tumours from intracranial injections.
N2N1G cells in brain tumours exhibited higher proliferation and lower apoptosis compared to cells in subcutaneous tumours and liver metastases (following intravenous injection) of comparable size (Fig. 1b–d and Extended Data Fig. 1h). Uniform manifold approximation and projection (UMAP) analysis of single-cell RNA sequencing (scRNA-seq) data showed distinct gene expression states between tumours at the three sites (Fig. 1e,f). SCLC cells growing in the brain showed higher expression of genes implicated in embryonic development, neurogenesis and cell cycle (Fig. 1g), consistent with previous observations with metastatic SCLC31,32.
Fig. 1 |. Brain developmental programmes are reactivated in cancer cells and stromal cells in an SCLC brain metastasis model.
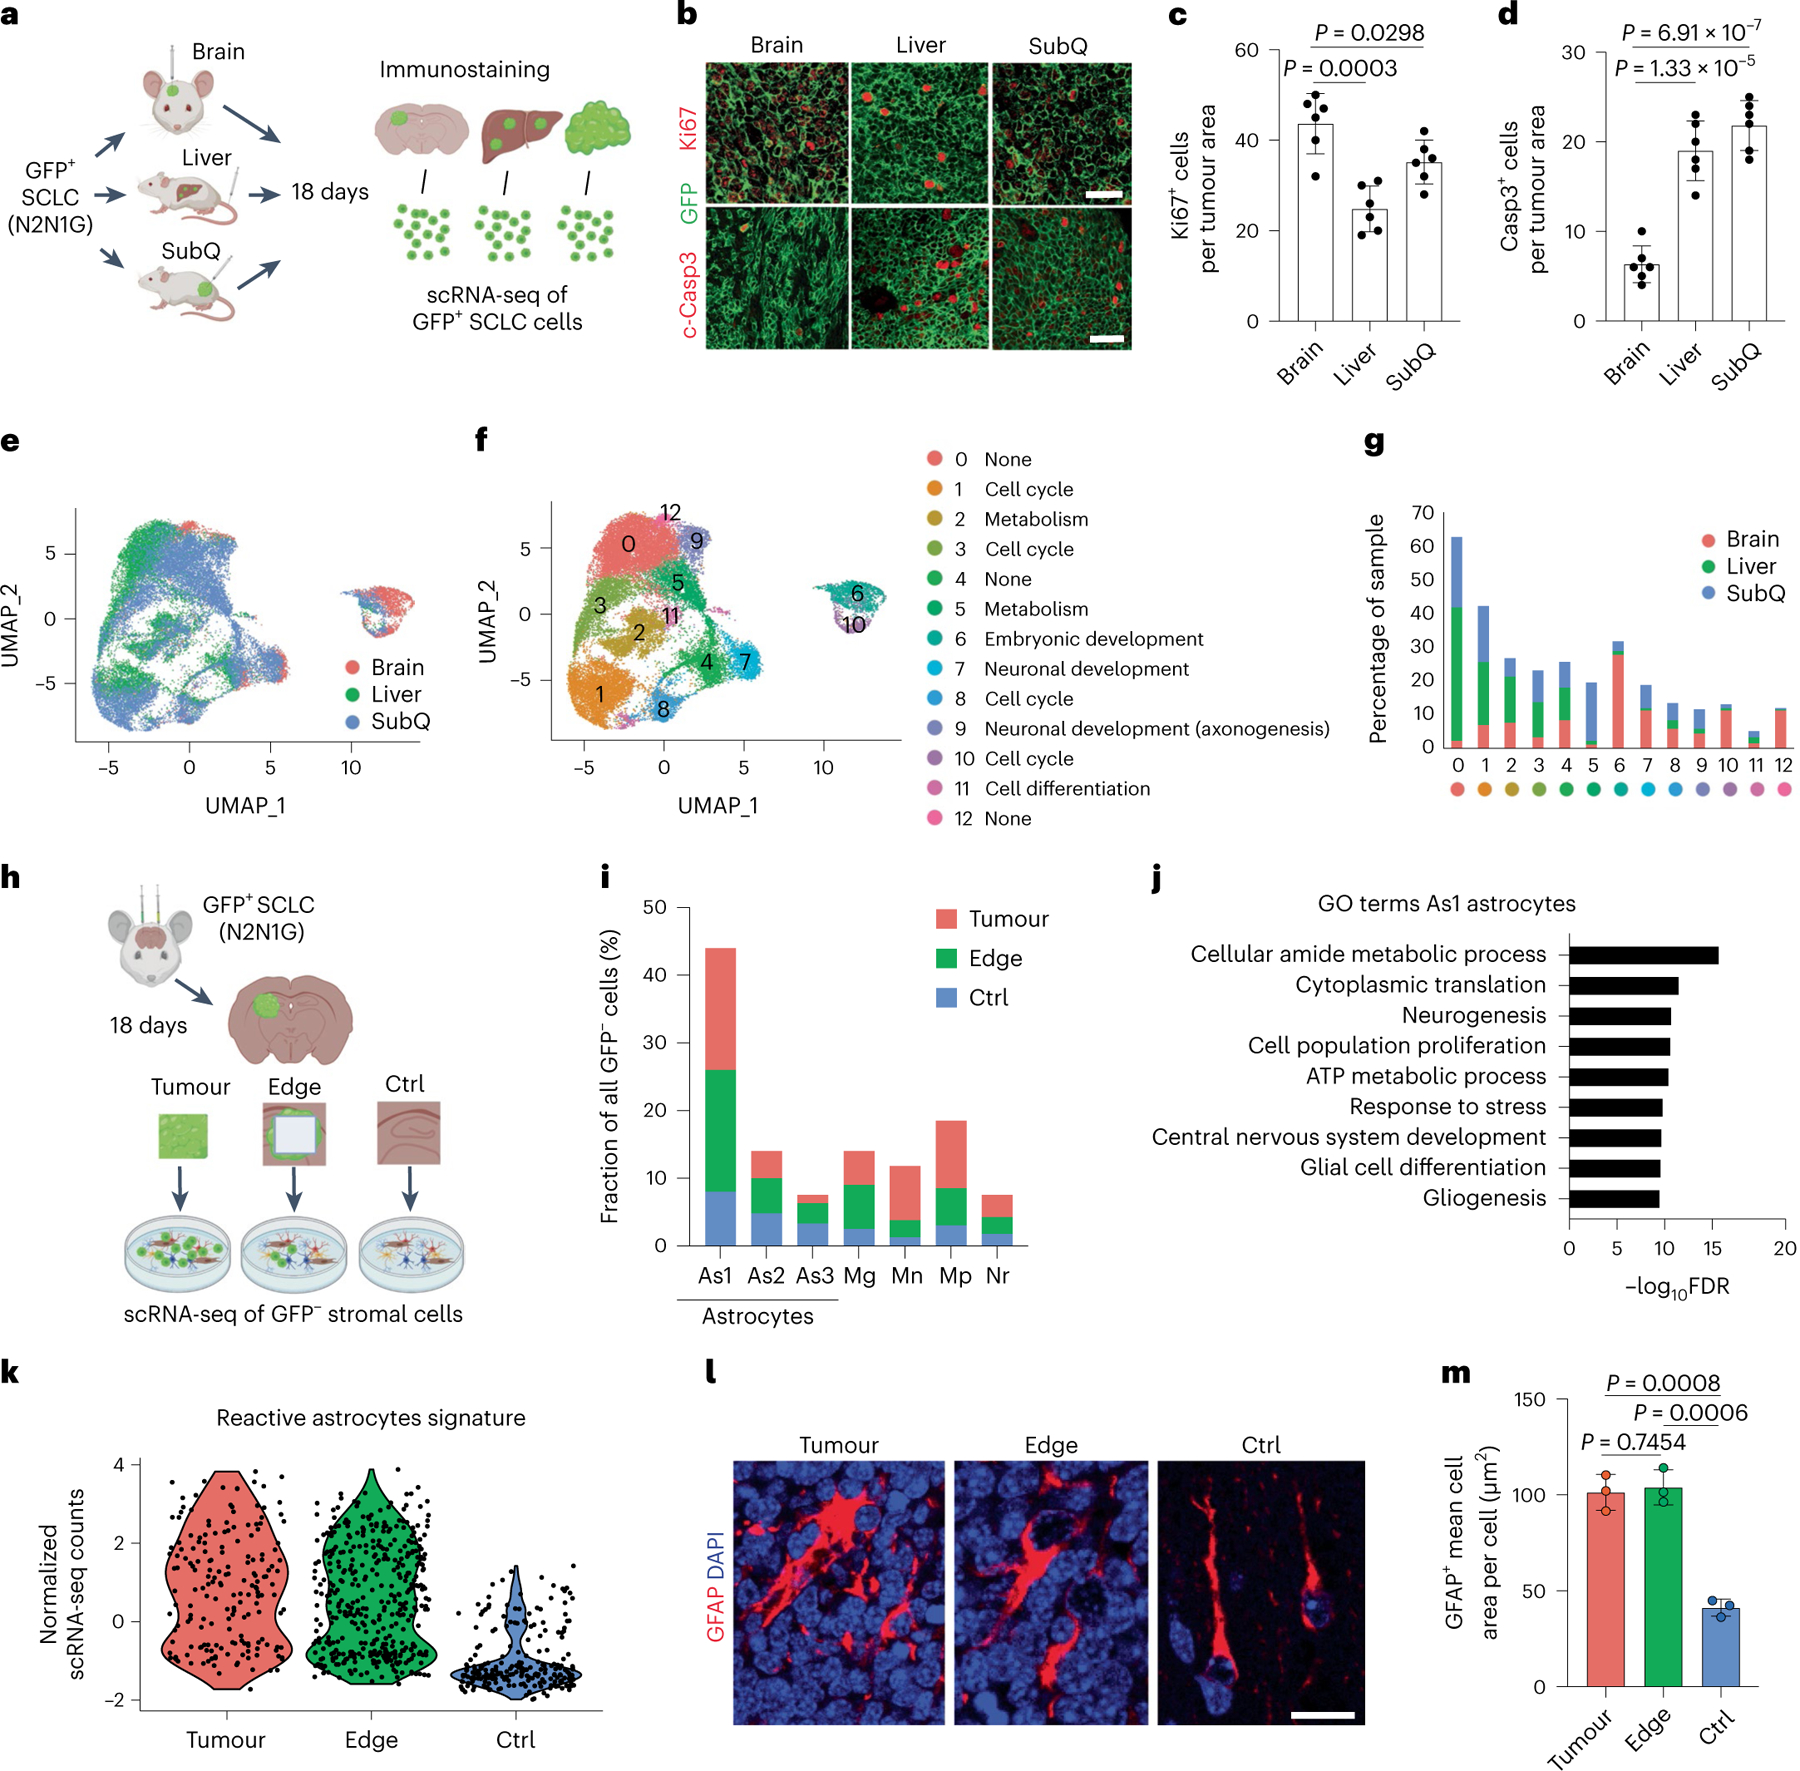
a, Schematic description of the analysis of mouse N2N1G SCLC cells expressing GFP growing in brain, liver and subcutaneous tumours (SubQ). b–d, Representative images (b) and quantification of immunofluorescence staining for Ki67 (c), cleaved caspase-3 (Casp3) (d) and N2N1G cells (GFP) on tumour sections (quantification is number of positive cells per area quantified = 2 × 104 μm2) as in (a) (n = 6 tumours from 2 independent experiments). Scale bars, 20 μm. e, UMAP analysis of scRNA-seq data from N2N1G cells isolated from brain, liver and subcutaneous allografts. f,g, Distribution of N2N1G cells isolated from brain, liver and subcutaneous allografts on the UMAP analysis plot (f) and the percentage of cells in each cluster (g). h, Schematic representation of the analysis of stromal cells from N2N1G brain allografts. The site without cancer cells (control (Ctrl)) also underwent surgery and sham injection. i, The percentage of specific cell types in GFP− stromal cells from the tumour core, tumour edge and sham control. As1, astrocyte 1; As2, astrocyte 2; As3, astrocyte 3; Mg, microglia; Mn, monocyte; Mp, macrophage; Nr, neutrophil (see Extended Data Fig. 2d for all cell populations). j, GO enrichment for genes that are upregulated in astrocyte population 1 (As1). FDR, false discovery rate. k, Expression of a reactive astrocyte signature from scRNA-seq data of astrocytes isolated from an N2N1G brain tumour, its tumour edge and sham injection control brain. n = 3 biologically independent samples. l, Representative images showing immunofluorescence staining of GFAP (astrocytes) from N2N1G brain tumours (tumour core and edge) or control brain regions. Blue, DAPI DNA stain. Scale bar, 20 μm. m, Cell area of GFAP+ astrocytes as in (l). n = 3 tumours from 3 mice. Data are mean ± s.d. P values calculated by two-sided t-test.
scRNA-seq on non-cancer (GFP−) cells isolated from brain tumours (GFP+ SCLC cells), brain tissue at the tumour edge and contra-lateral brain (injury control, sham injection) showed heterogeneous populations of cells (Fig. 1h,i, Extended Data Fig. 2a–d and Supplementary Fig. 1). We focused on astrocytes based on their prevalence in SCLC brain tumours and their previous implication in brain metastasis33 (both as pro- and anti-cancer). Gene ontology (GO) analysis of genes significantly upregulated in the most abundant population of astrocytes in the tumour core and at the edge (As1 astrocytes) revealed enrichment for brain development gene programmes (Fig. 1j and Supplementary Table 1).
Thus, in this intracranial injection model, SCLC cells and astrocytes exhibit features reminiscent of neurons and astrocytes, respectively, in early brain development, indicative of a remodelled microenvironment.
GFAP+ astrocytes infiltrate SCLC brain metastases
Astrocyte populations isolated from SCLC brain allografts showed features of reactive astrocytes34–36 in scRNA-seq analysis (Fig. 1k, Extended Data Fig. 2e,f and Supplementary Table 2) and immunostaining for glial fibrillary acidic protein (GFAP), and a characteristic hypertrophic morphology33,37 (Fig. 1l,m). Bulk RNA-seq confirmed an enrichment for developmental processes in these tumour-associated astrocytes compared to controls. Gene set enrichment analysis (GSEA) further showed signatures of neuroprotective reactive astrocytes (middle cerebral artery occlusion-induced injury) distinct from inflammatory reactive astrocytes (lipopolysaccharide-induced inflammation)35,36 in tumour-associated astrocytes (Extended Data Fig. 2g–j).
GFAP+ reactive astrocytes were also detected in human SCLC brain metastases (Fig. 2a,b and Supplementary Table 3). Although we analysed only a few patient SCLC samples with clearly identifiable tumour borders, in these samples, GFAP+ astrocytes were more frequently detectable in the core of metastases compared with lung adenocarcinoma, breast cancer and melanoma, where gliosis is typically found at the edge of brain metastases38 (Fig. 2c,d and Supplementary Table 3). A similar pattern of astrocyte infiltration was found upon intracranial injection of two human SCLC cell lines compared with one human breast cancer cell line and one lung adenocarcinoma cell line (Fig. 2e,f); this does not exclude the possibility that selected variant cell lines from these other cancer types could also display infiltration of astrocytes. In an SCLC xenograft model that generate leptomeningeal metastases from subcutaneous tumours39,40, astrocytes were present in tumour regions invading towards the brain parenchyma (Extended Data Fig. 3a). Astrocyte infiltration was also observed in brain tumours with the KP1 mouse SCLC cell line in immunocompetent hosts41 (Extended Data Fig. 3b). Thus, data in preclinical models and from patients indicate that astrocytes are closely associated with SCLC cells in the tumour microenvironment of brain metastases.
Fig. 2 |. Reactive astrocytes infiltrate SCLC brain metastases.
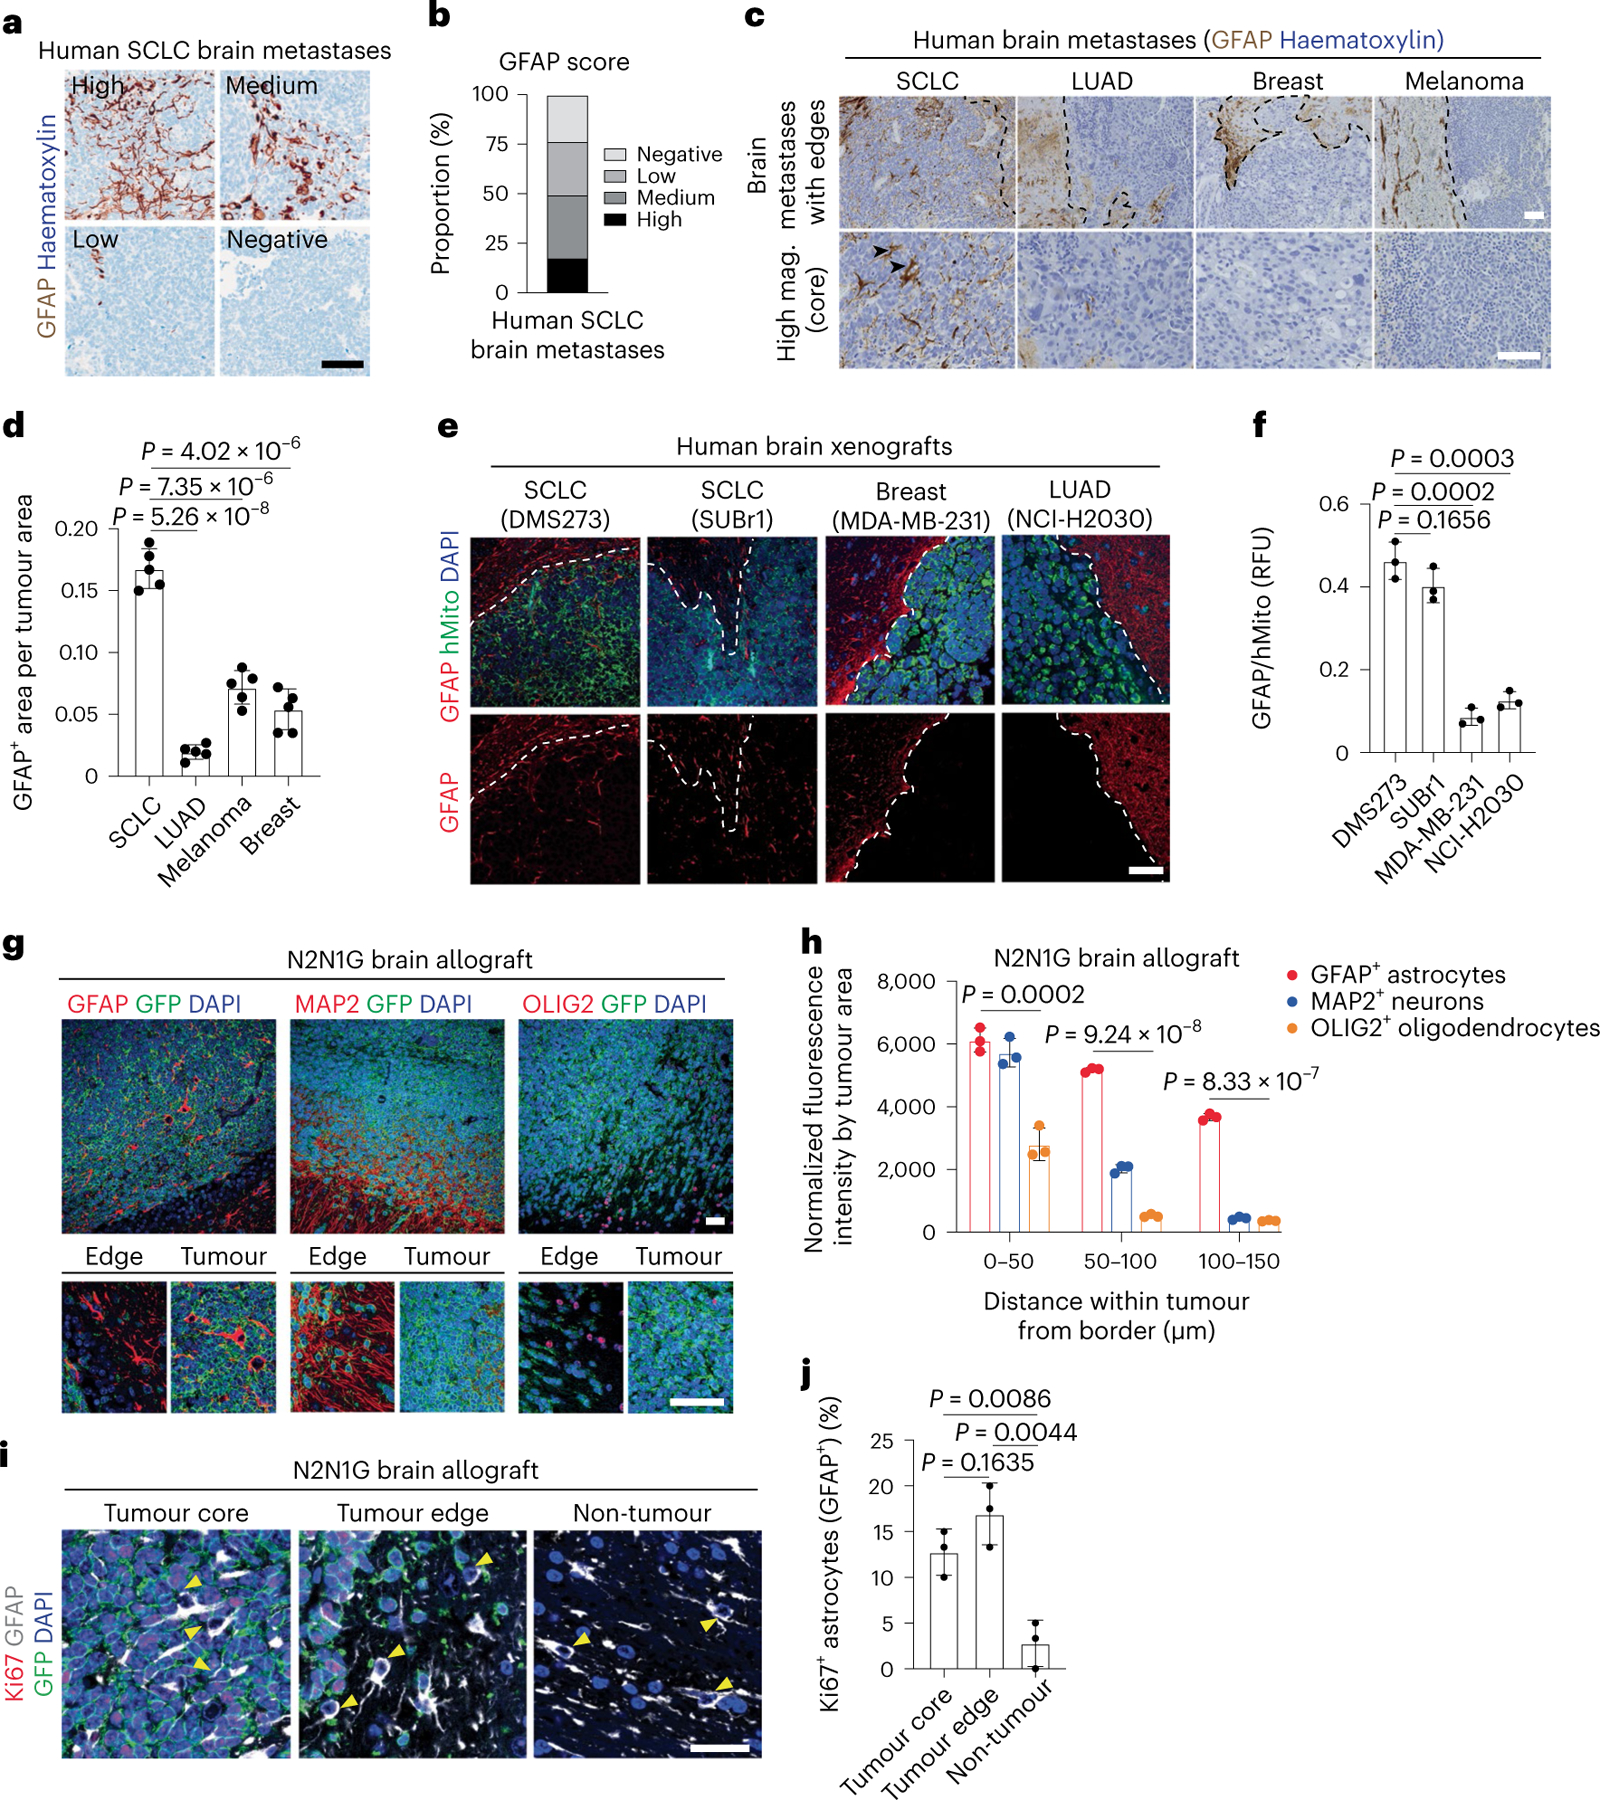
a, Representative image of brain metastasis sections with different numbers of GFAP+ astrocytes (by immunohistochemistry with haematoxylin counterstain). Scale bar, 100 μm. b. Quantification of human SCLC brain metastases from images as in (a). n = 52 SCLC patient brain metastases, with 5 areas for each sample analysed. c, Representative images showing GFAP immunostaining (with haematoxylin counterstain) on brain metastasis sections from patients with SCLC, lung adenocarcinoma (LUAD), breast cancer or melanoma. Arrowheads show astrocytes within SCLC tumours. Scale bars, 500 μm (top), 100 μm (bottom). Mag., magnification. d, Quantification of GFAP+ astrocytes as in (c) (n = 3 SCLC, n = 3 LUAD, n = 3 breast cancer and n = 2 patients with melanoma, with 5 tumour regions analysed for each). e, Representative images showing immunofluorescence staining for GFAP and human mitochondria (hMito, for cancer cells) on sections from tumours growing in the brain after intracranial injection of human cancer cell lines as noted. Blue, DAPI DNA stain. Scale bar, 20 μm. f, GFAP fluorescence intensity relative to hMito as in (e) (n = 3 tumours from 3 mice). g, Representative immunofluorescence for GFAP (reactive astrocytes), MAP2 (mature neurons) and OLIG2 (oligodendrocytes and precursors) on a section from an N2N1G SCLC brain allograft. Blue, DAPI DNA stain. RFU, relative fluorescence unit. Bottom: corresponding higher magnification images, showing tumour edge and tumour. Scale bars, 20 μm. h, Distribution of neurons, astrocytes and oligodendrocytes as in (g) (n = 9 tumours from 3 independent experiments, showing mean ± s.d.). i, Representative immunofluorescence of Ki67+ astrocytes on a section from a GFP+ N2N1G SCLC brain allograft. Arrowheads show nuclei of GFAP+ (grey) astrocytes. Cancer cells are GFP+ (green). Blue, DAPI DNA stain. Scale bar, 10 μm. j, Quantification of Ki67+ astrocytes as in i (n = 3 tumours from 3 mice). Data are mean ± s.d. P values by two-sided t-test when comparing two groups and one-way ANOVA when comparing three groups.
Astrocytes migrate towards SCLC and promote tumour growth
Compared with oligodendrocyte transcription factor 2-positive (OLIG2+) oligodendrocytes/oligodendrocyte precursors and microtubule associated protein 2-positive (MAP2+) myelinated neurons, GFAP+ astrocytes were also present at the edge of SCLC tumours, but they were additionally found in the tumour core (Fig. 2g,h). This relative enrichment in astrocytes within tumours is unlikely to come from the transdifferentiation of cancer cells42,43, because GFP+ SCLC cells did not stain for GFAP (Extended Data Fig. 3c,d). Similarly, neither changes in apoptotic cell death nor ratios between perivascular and non-perivascular astrocytes44,45 readily explained the presence of intratumoural astrocytes (Extended Data Fig. 3e–h).
Reactive astrocytes regain the ability to proliferate and migrate46. Increased proliferation may contribute to the increased number of astrocytes in brain tumours (Fig. 2i,j). Moreover, the expression of genes coding for factors involved in cell polarity and migration47,48 (for example, Marcks and Fzd3) (Extended Data Fig. 4a) led us to investigate a possible role for migration. First, we generated assembloids by fusion of cancer aggregates with human cortical organoids (hCOs) derived from human induced pluripotent stem (iPS) cells49,50. After 180–200 days in culture, these hCOs contain neurons and glial cells, as found in the developing human brain49,51 (Fig. 3a). Ten days after fusion, GFAP+ astrocytes, but not MAP2+ neurons, infiltrated into SCLC aggregates (Fig. 3b–d and Extended Data Fig. 4b). Moreover, GFAP+ cells infiltrated human SCLC aggregates more than they did lung adenocarcinoma or breast cancer aggregates (Fig. 3e,f). Second, we established a Transwell-based chemotaxis assay with primary astrocytes (Fig. 3g). Conditioned medium from SCLC cells induced stronger chemotaxis (Fig. 3h and Extended Data Fig. 4c) and slightly increased astrocyte viability over 48 h (Fig. 3i) compared with control medium.
Fig. 3 |. SCLC cells induce the migration of astrocytes.
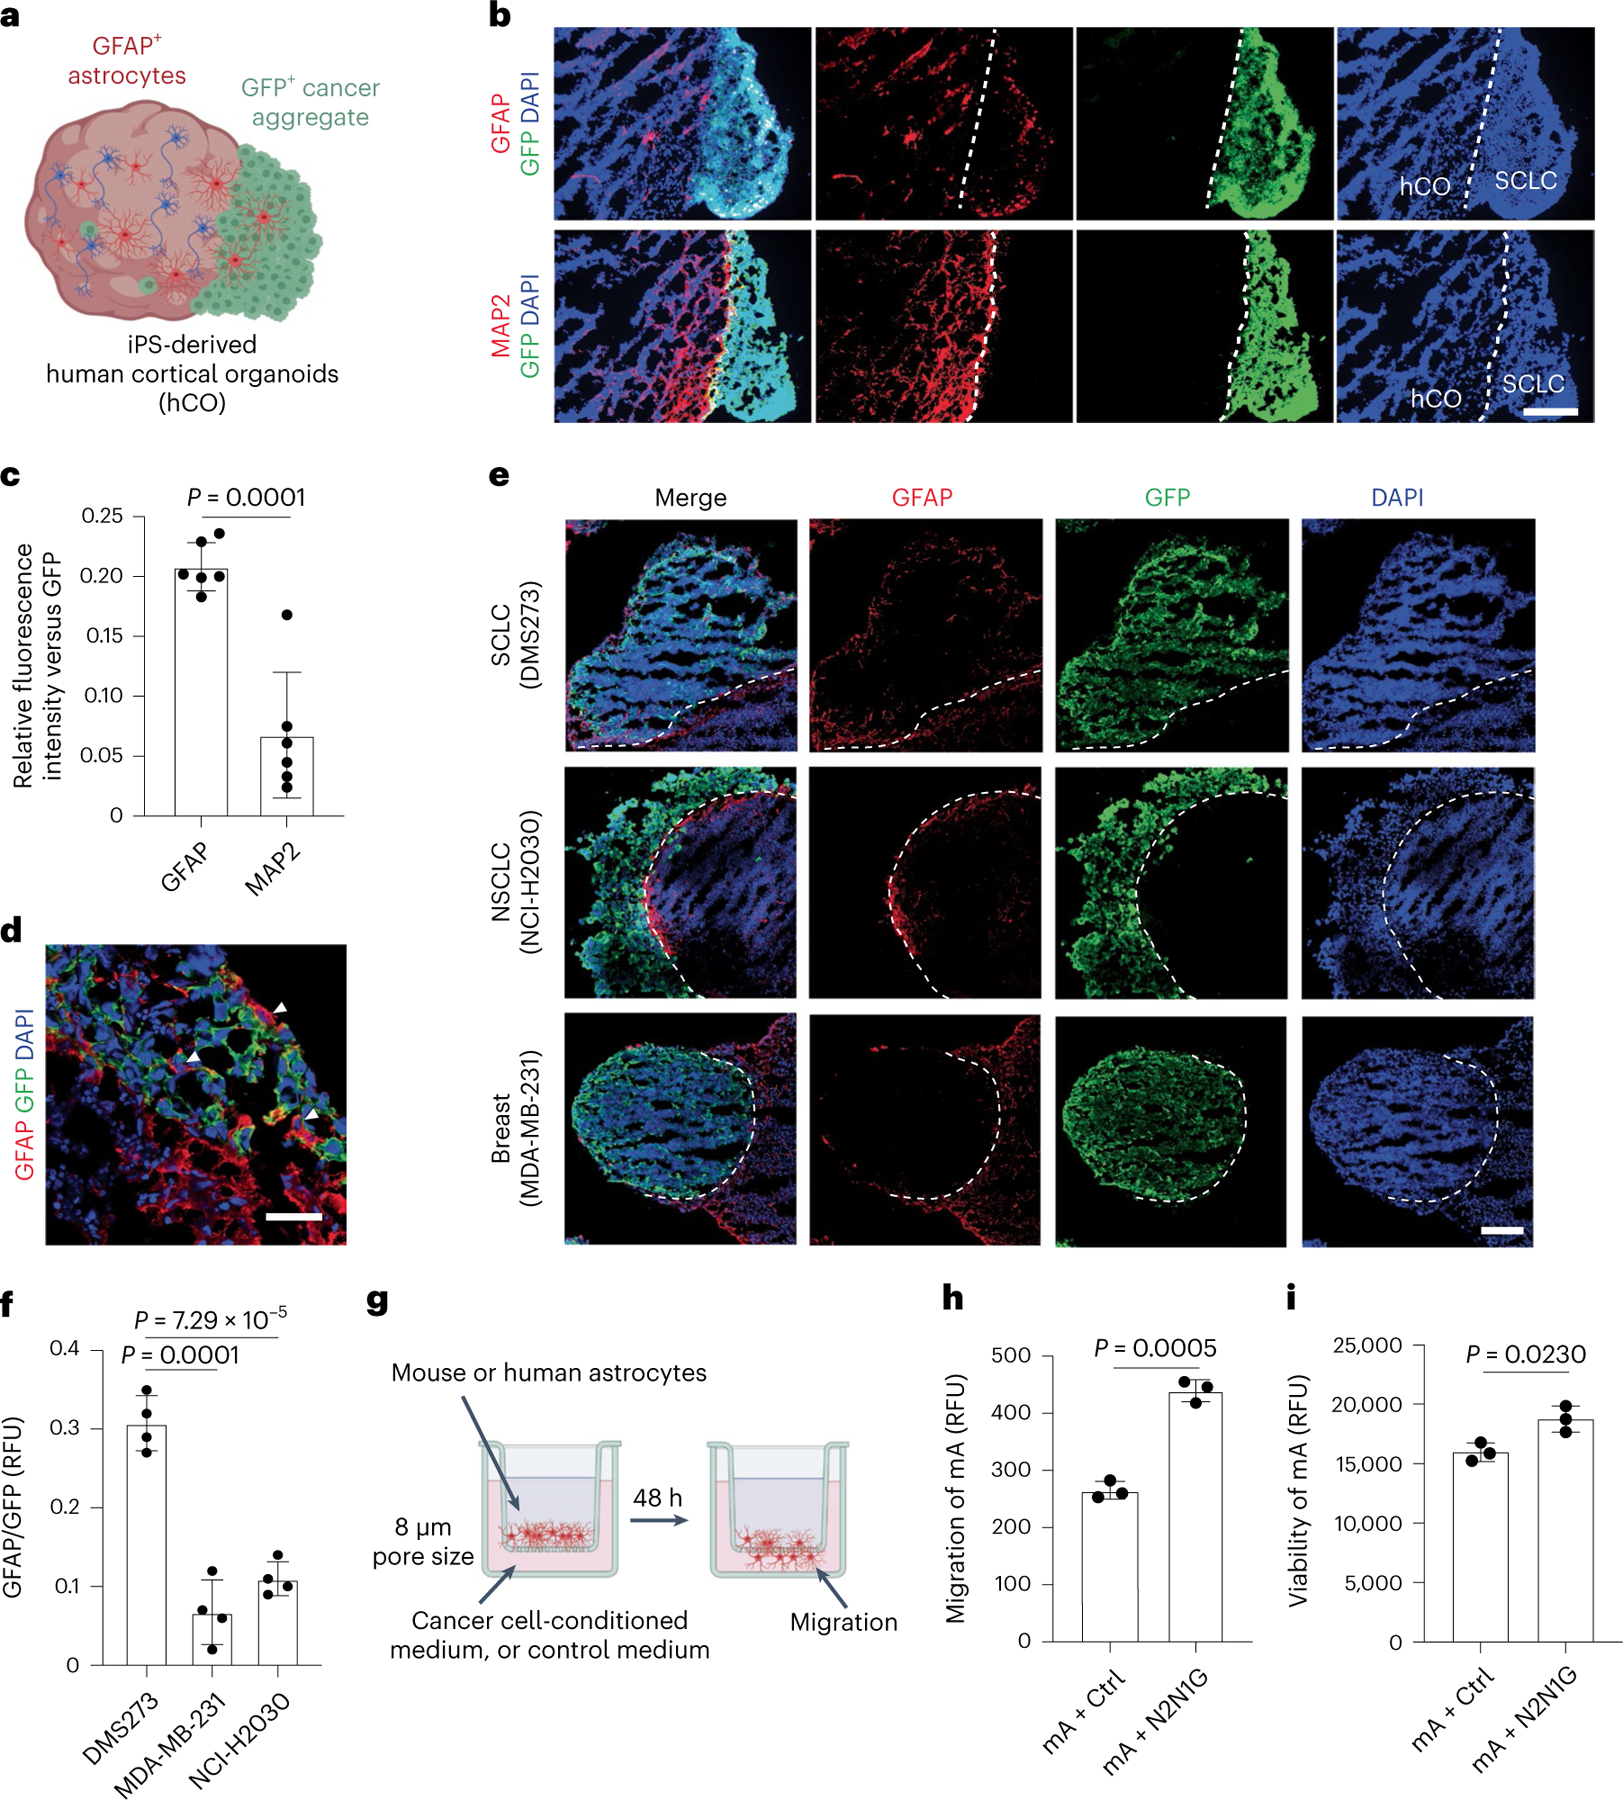
a, Schematic description of SCLC–hCO assembloids. b, Representative images showing immunofluorescence staining of GFAP, MAP2 and GFP (for N2N1G SCLC cells) on sections from an assembloid at post-fusion day 10. Blue, DAPI DNA stain. Scale bar, 200 μm. c, Relative GFAP or MAP2 fluorescence intensity versus GFP as in (b) (n = 6 tumours from 2 experiments). d, Representative high-magnification image of immunofluorescence staining of GFAP and GFP (for mouse N2N1G cells) at the SCLC–hCO interface, showing the cell body of astrocytes within the SCLC aggregate (arrowheads). Blue, DAPI DNA stain. Scale bar, 20 μm. e, Representative images showing immunofluorescence staining of GFAP and GFP (for cancer cells) on sections from cancer cell–hCO assembloids using SCLC, NSCLC and breast cancer cells at post-fusion day 10. Blue, DAPI DNA stain. Scale bar, 200 μm. f, Relative GFAP fluorescence intensity to GFP in human cancer aggregates at post-fusion day 10 (n = 4 tumours from 2 experiments for each cell line). g, Schematic description of the Transwell migration (chemotaxis) assay. h,i, Quantification of mouse astrocyte (mA) chemotaxis (h) and viability (i) in control medium and N2N1G-conditioned medium after 48 h. n = 3 independent experiments. Data are mean ± s.d. P values by two-sided t-test.
Reactive astrocytes have anti- and pro-cancer roles in different contexts33,38,46. When we co-cultured mouse SCLC cells with mouse primary astrocytes in communicating chambers preventing migration, the cancer cells expanded faster and showed decreased apoptotic cell death (Extended Data Fig. 4d–f). In similar human SCLC–astrocyte co-cultures, astrocytes still showed a reactive morphology with elevated GFAP expression and showed enhanced migration towards human SCLC cell-conditioned medium (Extended Data Fig. 4g–i). Human primary astrocytes also promoted the growth and decreased apoptotic cell death of human SCLC cells (Extended Data Fig. 5a–f). This pro-tumour effect was not further enhanced when SCLC cells were co-cultured in direct contact with astrocytes (Extended Data Fig. 5g,h). Conditioned medium from astrocytes that never received paracrine signal from SCLC cells did not have the same pro-survival effects on SCLC cells (Extended Data Fig. 5i), indicative of a necessary crosstalk in this context.
Active glial cell migration and neuron–glial cell interactions occur during brain development52–54. Our observations support similar interactions between SCLC cells and astrocytes that are necessary in culture for the activation of astrocytes to provide pro-survival effects to SCLC cells.
NFIB is critical for SCLC growth in the brain
The transcription factor NFIB is frequently upregulated in metastatic SCLC31,32,55–57, where it activates developmental programmes, including brain development programmes31,58–60. All the mouse and human SCLC cell lines that we tested grew as subcutaneous tumours in mice, but NFIB-high SCLC cell lines had a greater ability to form detectable tumours in the brain (Fig. 4a and Extended Data Fig. 6a–e). Knockdown of NFIB in NFIB-high N2N1G cells significantly decreased tumour growth in the brain (Fig. 4a–c and Extended Data Fig. 6f) but not in subcutaneous tumours (Fig. 4d,e), and had minor effects in culture (Extended Data Fig. 6g). Similar observations were made with NFIB-high 16 T cells31 (Extended Data Fig. 6h–k). Escape from knockdown in shNfib N2N1G cells growing in the brain, but not in subcutaneous tumours (Fig. 4f,g), further suggested a selective pressure to retain NFIB activity in brain metastases in this model. In these allografts (Fig. 4g,h) and in brain metastases from patients with SCLC (Extended Data Fig. 6k,l), we also noted a positive correlation between higher NFIB levels and the presence of GFAP+ astrocytes. In addition, conditioned medium from shNfib N2N1G cells could not increase the migration of astrocytes, with limited effects on astrocyte viability (Fig. 4i,j), whereas astrocytes could still support the growth and survival of shNfib N2N1G cells in culture (Fig. 4k,l).
Fig. 4 |. The brain development transcription factor NFIB is required for the optimal growth of SCLC brain metastases.
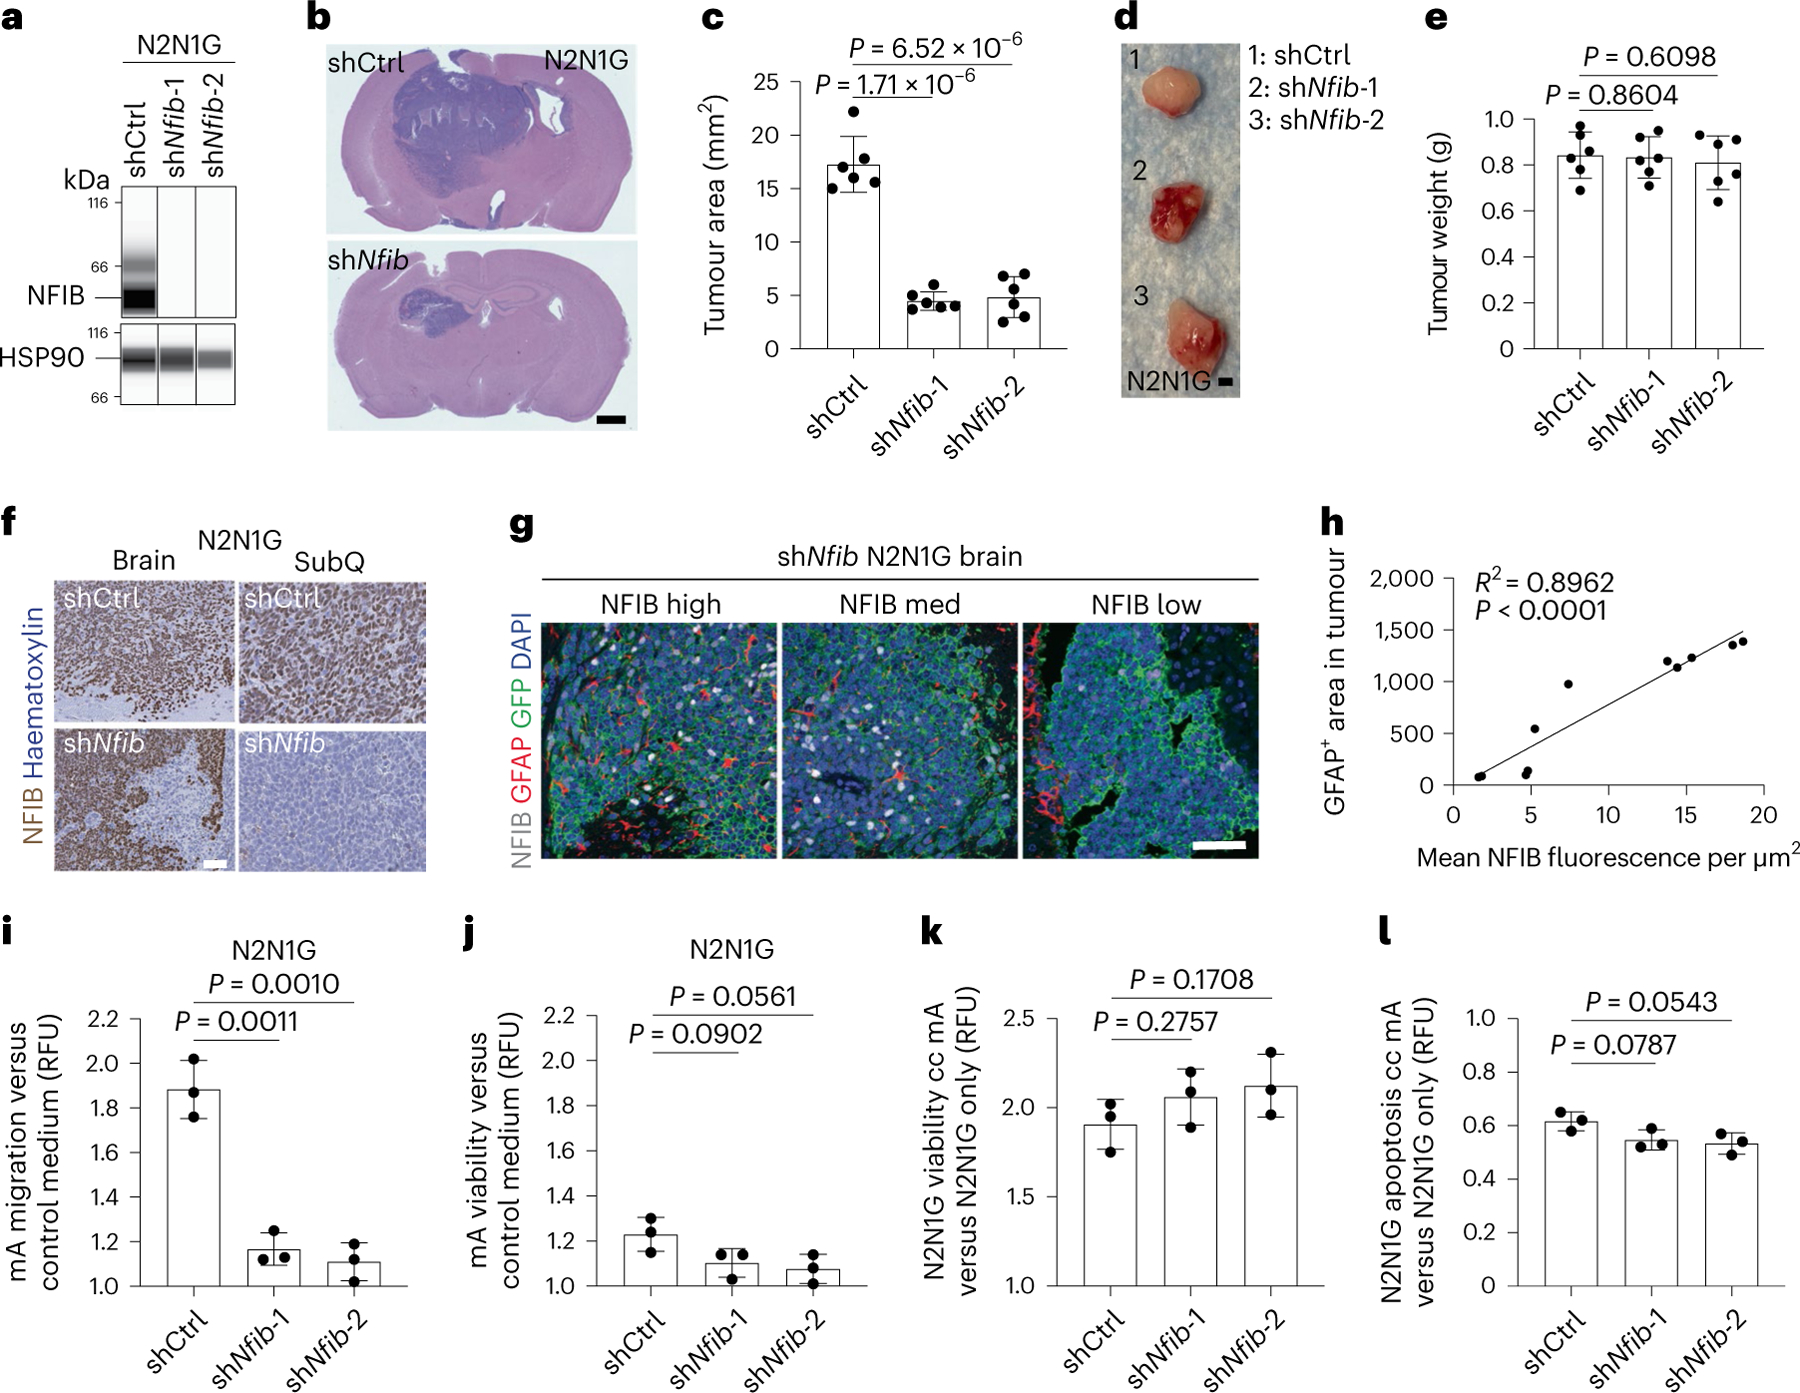
a, Immunoassay for NFIB expression in N2N1G cells with control (shCtrl) and Nfib (shNfib) short hairpin RNA (shRNA). HSP90 serves as a loading control (n = 1). b, Representative haematoxylin and eosin (H&E)-stained sections from brain allografts from control (shCtrl) and shNfib N2N1G cells 18 days post-injection (shNfib-1 example shown). Scale bar, 1 mm. c, Quantification of tumour area from images as in (b) (n = 6 tumours from 2 experiments). d, Representative images of subcutaneous tumours from shCtrl and shNfib N2N1G cells 18 days post-injection. Scale bar, 5 mm. e, Quantification of weight of tumours imaged in (d) (n = 6 tumours from 2 experiments). f, Representative immunohistochemistry for NFIB expression in sections from shCtrl and shNfib N2N1G brain allografts and subcutaneous tumours 18 days after transplant (shNfib-1 examples shown). Scale bar, 20 μm. g, Representative image of immunofluorescence staining of GFAP (red) in brain allografts from control (shCtrl) and shNfib N2N1G cells 18 days post-injection (shNfib-1 example shown). Scale bar, 5 mm. h, Quantification of GFAP+ area and NFIB fluorescence intensity from images as in (g) (n = 11 regions from 4 tumours). i, Relative chemotaxis of mouse astrocytes in shCtrl and shNfib N2N1G-conditioned medium compared with control medium (n = 3 experiments). j, Relative viability of mouse astrocytes in shCtrl and shNfib N2N1G-conditioned medium compared with control medium (n = 3 experiments). k,l, Relative cell viability (k) and apoptosis (l) of control N2N1G and shNfib N2N1G cells co-cultured (cc) with mouse astrocytes compared to those cultured alone (n = 3 experiments). Data are mean ± s.d. P values calculated by two-sided t-test.
Collectively, these data suggested that developmental programmes elevated in NFIB-high SCLC cells contribute to the ability of SCLC cells to grow in the brain and mediate astrocyte migration towards brain metastases. However, NFIB also contributes to the development of SCLC liver metastases in mice31,32, a process independent of astrocytes, which raised the question of the specific mechanisms at play in the brain. One possibility was that NFIB activity is different in SCLC cells growing in the brain compared to other sites. However, we found that NFIB protein levels were similar between N2N1G cells isolated from brain, liver, and subcutaneous tumours (Extended Data Fig. 7a,b). In addition, overall chromatin accessibility determined by assay for transposase-accessible chromatin followed by sequencing (ATAC–seq) did not separate N2N1G cells in culture and in tumours at different sites (Extended Data Fig. 7c,d). A targeted analysis of NFIB target sites (defined in ref. 31) showed some increased accessibility in brain and liver tumours compared with subcutaneous tumours and cultured cells (Extended Data Fig. 7e). However, just over 600 peaks were differently accessible between brain and liver tumour samples (Extended Data Fig. 7f), in contrast to the more than 20,000 peaks that are differently accessible between NFIB-high and NFIB-low SCLC cells31. These minimal chromatin accessibility changes in SCLC brain tumours suggested that key mechanisms downstream of NFIB may be more related to the nature of NFIB targets rather than changes in NFIB activity.
Reelin–Vldlr signalling is required for astrocyte chemotaxis
To identify gene programmes downstream of NFIB that are (1) related to brain development; and (2) relevant to the interactions between SCLC cells and astrocytes, we examined receptor–ligand pairs that are upregulated in tumour-associated astrocytes and in metastatic SCLC cells and downregulated upon NFIB knockdown ( | log2 fold change (FC) | >1, P < 0.05)32 (Supplementary Table 4). This approach identified the Reelin–Vldlr pair as a candidate, with upregulation of Reelin in metastatic SCLC and upregulation of its receptor Vldlr in tumour-associated astrocytes (Fig. 5a). ATAC–seq and chromatin immunoprecipitation followed by sequencing (ChIP–seq) data31 indicated that Reln is a direct target of NFIB in SCLC cells (Extended Data Fig. 8a). Reelin protein levels were reduced upon NFIB knockdown in N2N1G cells (Fig. 5b), whereas Reelin knockdown did not affect NFIB levels in SCLC cells (Extended Data Fig. 8b,c). Reelin was expressed in mouse N2N1G SCLC cells growing in the brain (Fig. 5c,d and Extended Data Fig. 8d) and in human SCLC brain metastases (Fig. 5e). Vldlr expression was detectable in tumour-associated astrocytes (Fig. 5c,d and Extended Data Fig. 8d), with higher expression compared to astrocytes in control brain regions (Fig. 5f,g). Based on the critical role of Reelin–Vldlr signalling in regulating neuronal and glial progenitor migration during early brain development61–63, and although it is likely that other factors contribute to the crosstalk between SCLC cells and astrocytes, we focused our analysis on Reelin and Vldlr.
Fig. 5 |. Reelin–Vldlr signalling regulates SCLC-induced astrocyte migration.
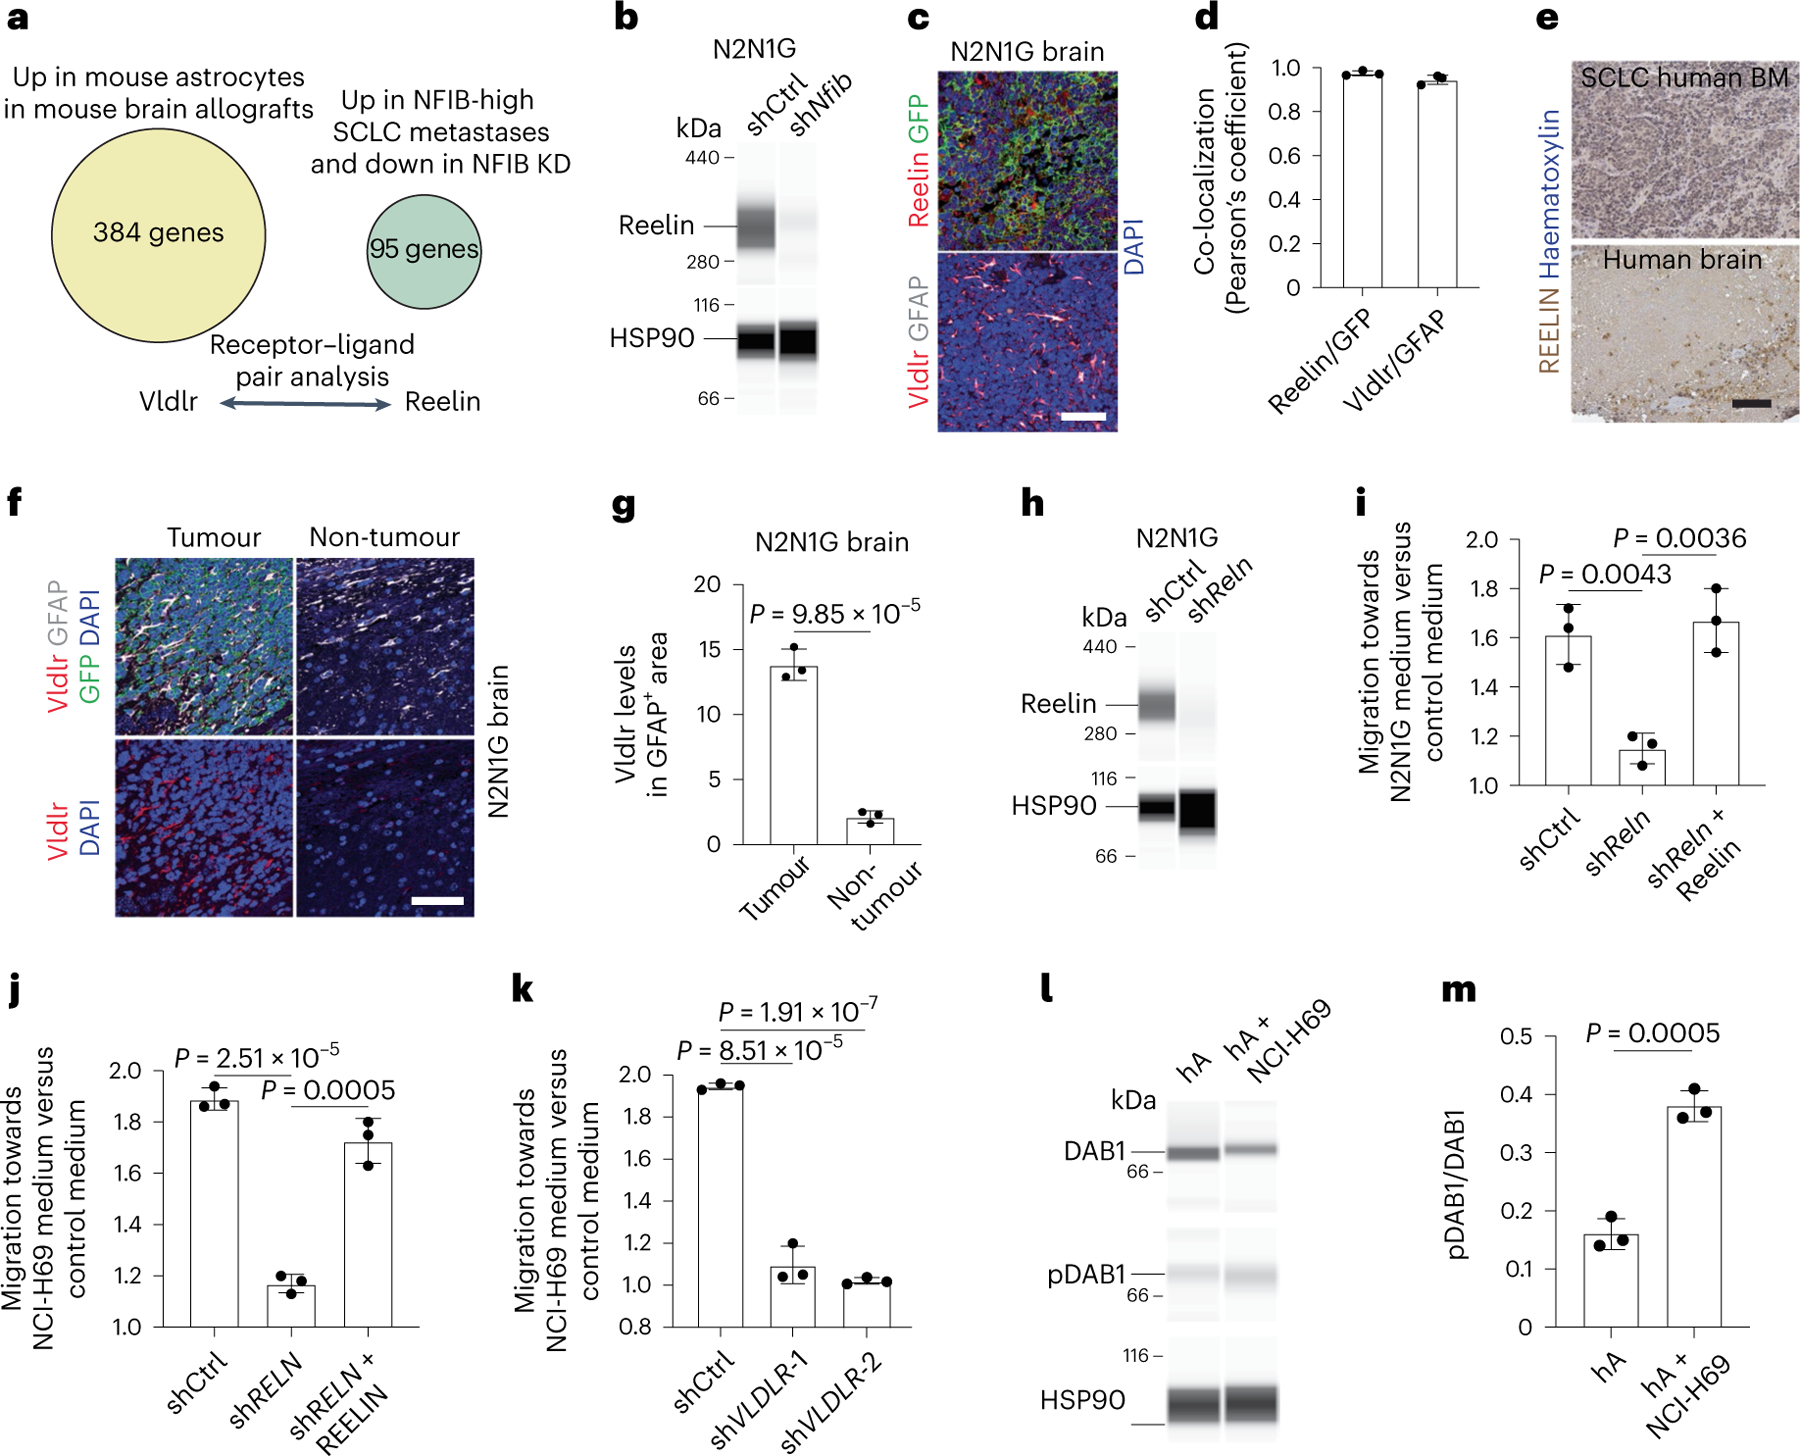
a, Receptor–ligand pair analysis on genes both upregulated in NFIB-high SCLC metastases and downregulated upon Nfib knockdown (KD) with upregulated genes in SCLC-associated astrocytes. b, Immunoassay for Reelin in shCtrl (control) and shNfib N2N1G cells. HSP90 serves as a loading control (n = 1). c, Representative images showing immunofluorescence staining of Reelin and GFP (cancer cells) and Vldlr and GFAP on an N2N1G brain allograft section. Blue, DAPI DNA stain. Scale bar, 50 μm. d, Co-localization of Reelin with GFP (SCLC cells) and Vldlr with GFAP (astrocytes) in N2N1G brain allografts (n = 3). e, Representative images of immunohistochemistry staining of REELIN in a brain metastasis and a normal brain area from a patient with SCLC. Scale bar, 100 μm. BM, bone marrow. f, Representative images of immunofluorescence staining of Vldlr and GFAP on an N2N1G brain allograft section. Blue, DAPI DNA stain. Scale bar, 50 μm. g, Quantification of Vldlr immunofluorescence intensity in astrocytes normalized to normal adult brain region from images as in (e) (N2N1G, n = 3 tumours). h, Immunoassay for Reelin in shCtrl and shRNA targeting Reln (shReln) N2N1G cells. HSP90 serves as a loading control (n = 1). i, Chemotaxis of mouse astrocytes (mA) with shCtrl and shReln (with or without recombinant mouse Reelin) N2N1G-conditioned culture medium compared with control culture medium (n = 3). j, As in (i) with human astrocytes (hA) and human NCI-68 cells (n = 3). k, Chemotaxis of shCtrl and shVLDLR hA in NCI-H69-conditioned culture medium compared with control culture medium (n = 3). l,m, Immunoassay (l) and quantification (m; n = 3) of DAB1 and phospho-DAB1 (pDAB1) (Tyr232) in human astrocytes (hA) treated with control medium or NCI-H69 conditioned medium. HSP90 serves as a loading control. Data are mean ± s.d. P values by two-sided t-test.
In co-cultures, Reelin knockdown (shRELN) in NCI-H69 human SCLC cells could still induce GFAP expression in human astrocytes similar to control NCI-H69 cells (Extended Data Fig. 8e–g). Few human astrocytes in culture normally express GFAP, and this was not visibly changed by adding recombinant human REELIN to the culture medium (Extended Data Fig. 8h). Moreover, the viability of control and shRELN NCI-H69 cells was similarly induced by co-culture with astrocytes (Extended Data Fig. 8i). Thus, Reelin is dispensable for SCLC-mediated astrocyte activation and for the pro-survival effects of activated astrocytes on SCLC cells in culture.
By contrast, adding recombinant mouse Reelin was sufficient to promote the migration of mouse primary astrocytes in Transwell migration assays, and this could be inhibited using a mouse Reelin-blocking antibody (Extended Data Fig. 8j). Conditioned medium from mouse N2N1G SCLC cells also increased the migration of astrocytes in culture, which could be prevented by Reelin knockdown (Fig. 5h,i). Conditioned medium from shCtrl (control) and shReln N2N1G cells had a similar small effect on astrocyte viability after 48 h (Extended Data Fig. 8k). Human recombinant Reelin protein was also sufficient to increase the migration of human astrocytes (Extended Data Fig. 8l), and Reelin produced by human NCI-H69 cells was required for the pro-migration effects of conditioned medium from this cell line (Fig. 5j). VLDLR knockdown in primary human astrocytes significantly inhibited human astrocyte migration and chemotaxis towards SCLC-conditioned medium or medium with recombinant Reelin (Fig. 5k and Extended Data Fig. 8m,n). The binding of Reelin to Vldlr activates the adapter protein DAB164. We found higher levels of active, phosphorylated DAB1 in mouse astrocytes treated with N2N1G-conditioned medium compared with control medium after 24 h (Fig. 5l,m). DAB1 knockdown in mouse astrocytes significantly affected the migration but also the viability of astrocytes (Extended Data Fig. 8o). Thus, the migration of astrocytes towards SCLC cells is controlled at least in part by Reelin produced by SCLC cells and its receptor Vldlr expressed by astrocytes.
Reelin is required for SCLC growth in the brain
Reelin knockdown did not affect the expansion of mouse N2N1G SCLC cells under normal culture conditions (Extended Data Fig. 9a). Similarly, Reelin knockdown in N2N1G and 16T SCLC cells did not affect subcutaneous tumour growth and liver metastases; by contrast, shReln cells generated smaller tumours in the brain compared with controls (Fig. 6a–d and Extended Data Fig. 9b–g). The migration of the shReln SCLC cells themselves was not affected in a 3D Matrigel assay (Extended Data Fig. 9h,i), but astrocyte infiltration was significantly reduced in shReln mouse brain metastases compared with controls (Fig. 6e,f).
Fig. 6 |. Reelin expression is critical for the recruitment of GFAP+ astrocytes in vivo and for the growth of SCLC brain metastases.
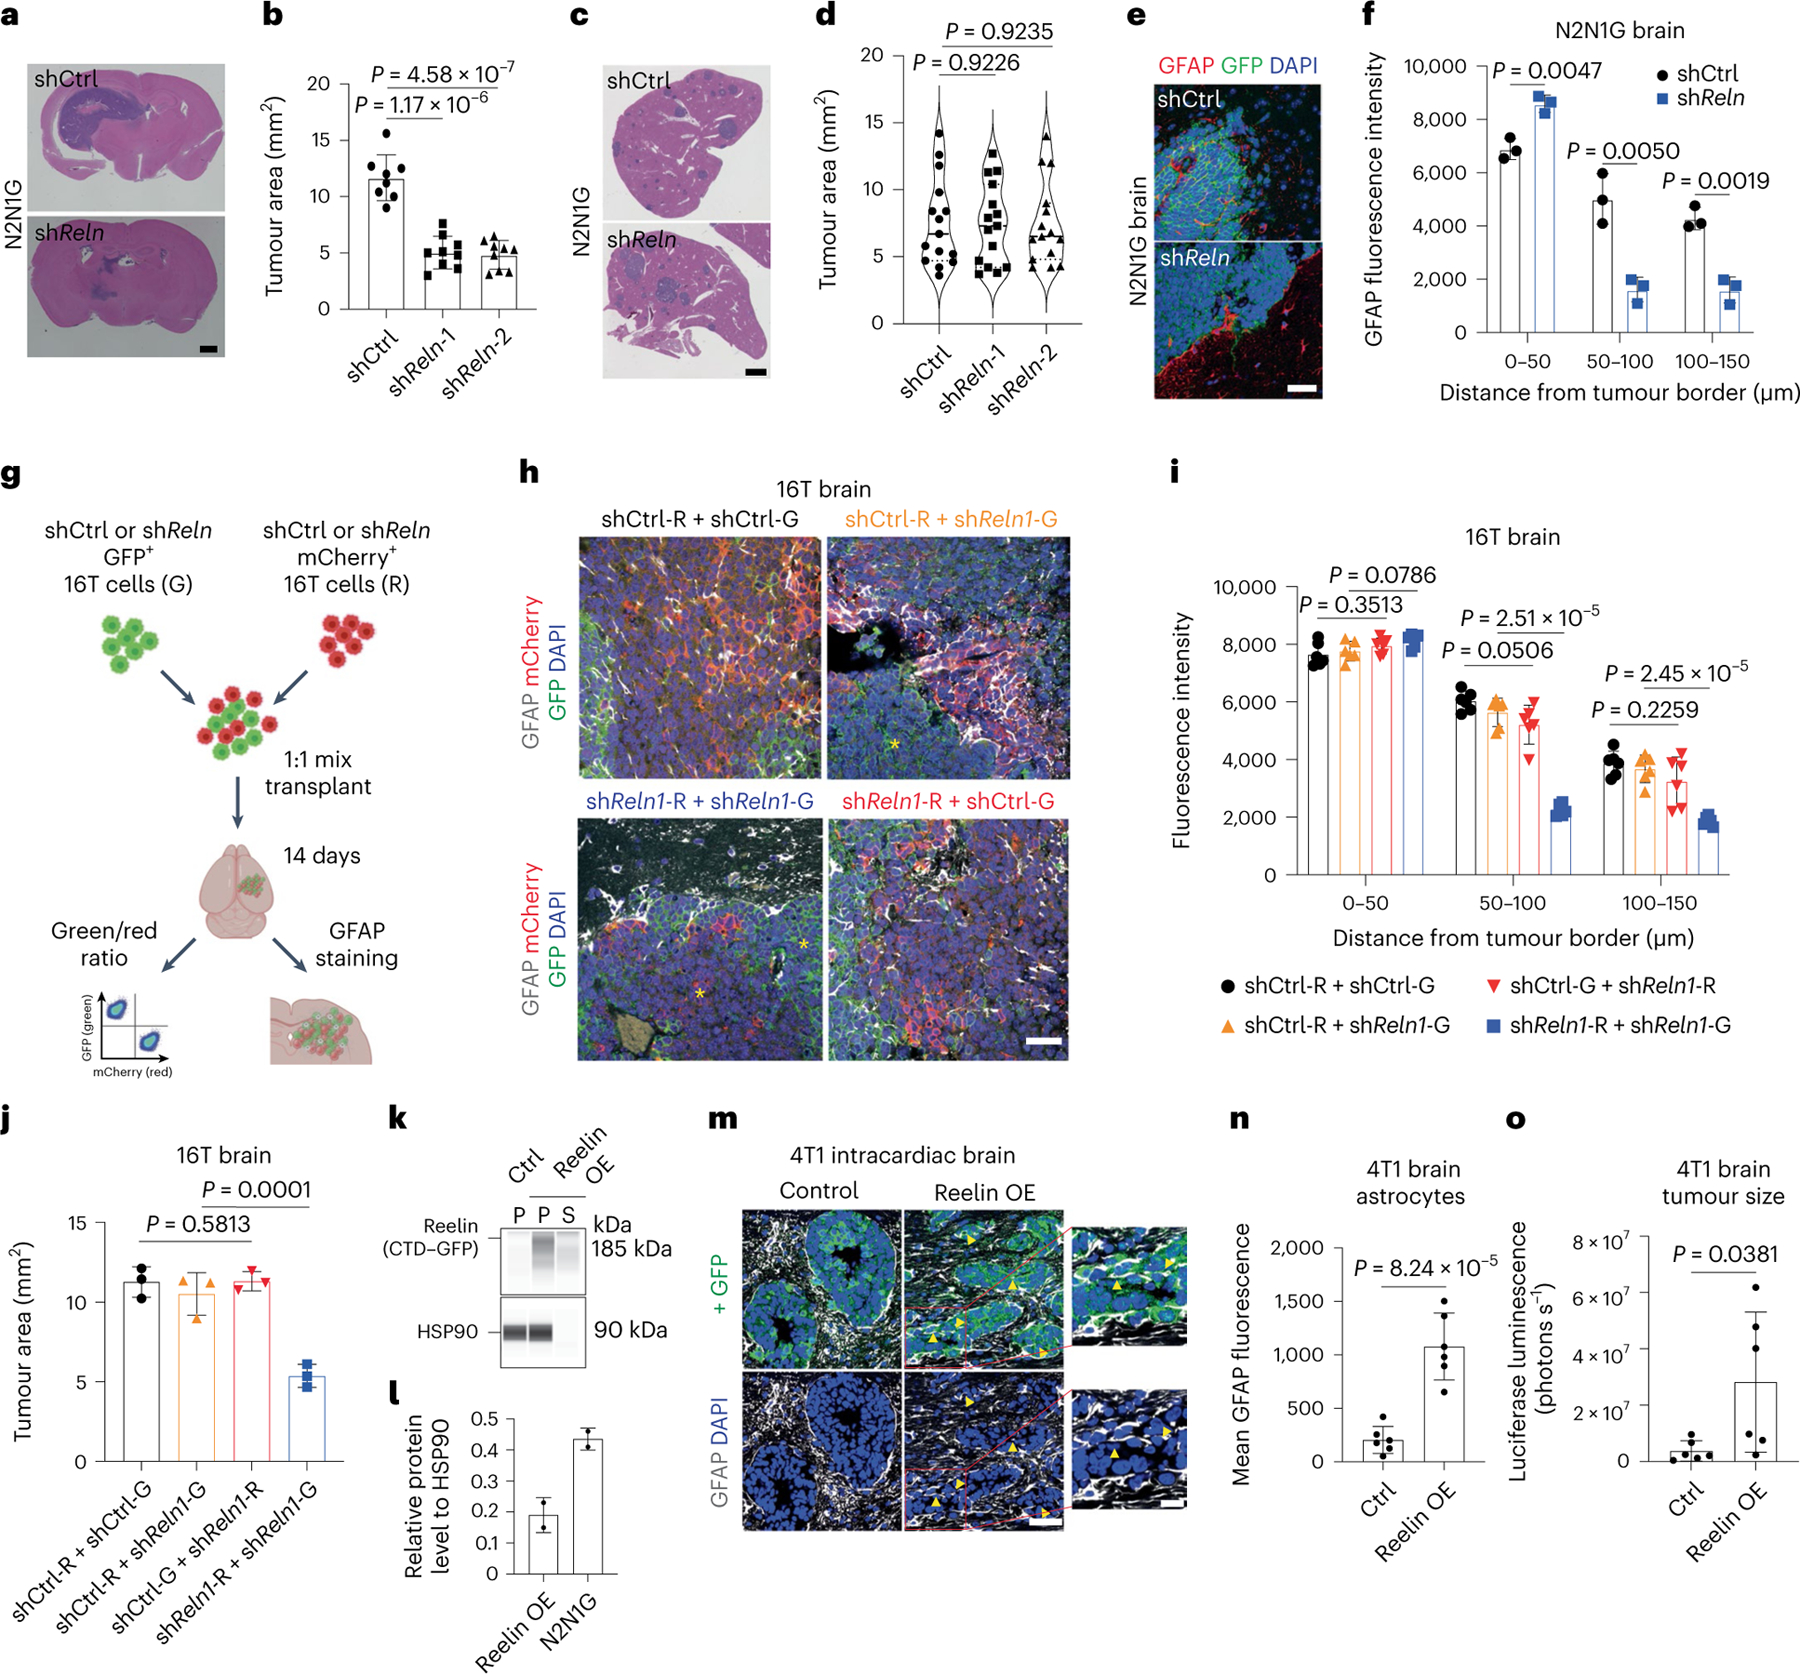
a,b, Representative H&E images (a) and tumour size (b) of shCtrl (control) and shReln N2N1G brain allografts 21 days post-transplant. Purple, tumour. Scale bar, 2 mm. n = 8 (shCtrl) and 9 (shReln) mice from 3 experiments. c,d, Representative H&E images (c) and tumour size (d) of shCtrl (control) and shReln N2N1G liver metastases 21 days post-transplant. n = 15 tumours from 4 mice. Scale bar, 2 mm. e, GFAP immunofluorescence staining on SCLC brain tumour sections (N2N1G cells). Blue, DAPI DNA stain. Scale bar, 20 μm. f, Astrocyte infiltration quantified by the mean fluorescence intensity for GFAP measured by the distance from tumour border in N2N1G brain tumours. n = 3 biologically independent samples. g, Description of the mixed tumour assay using shCtrl and shReln 16 T cells. h, GFAP immunofluorescence staining (white) in 16T brain tumours grown from a 1:1 mix of shCtrl and shReln cells expressing mCherry or GFP. Blue, DAPI DNA stain. Scale bar, 20 μm. Yellow asterisk shows regions where astrocytes are absent. i,j, GFAP+ astrocyte infiltration (i) and tumour size (j) from images as in (h). n = 6 mice from 2 independent experiments. k, Immunoassay for Reelin CTD–GFP expression in 4T1 cells expressing control vector or Reelin CTD (Leu1221–Ile2661 with GFP tag) (stained with an anti-GFP antibody). P, cell pellet; S, culture media supernatant. HSP90 serves as a loading control. OE, overexpression. l, Quantification of experiment in (k) (n = 2, pellet data, left bar), compared with endogenous levels of Reelin N2N1G cells (shCtrl samples in Fig. 5). m, GFAP immunofluorescence staining in brain metastases (day 14) from intracardiac injections of 4T1 cells. Arrowheads indicate infiltrated astrocytes. Scale bars, 20 μm (low magnification) and 10 μm (high magnification). n, GFAP level in the GFP+ tumour area in (m). n = 6 mice from 2 experiments. o, Quantification of brain metastasis size by luciferase imaging 14 days after intracardiac injections of 4T1 cells. n = 6 mice from 2 experiments. Data are mean ± s.d. P values by two-sided t-test when comparing two groups and one-way ANOVA when comparing three or more groups.
We next performed a competition assay with a 1:1 mix of shReln and shCtrl 16 T cells expressing either mCherry (16T-R cells) or GFP (16T-G cells) (in both combinations of colours). As controls, we used a 1:1 mix of shCtrl 16T-G and 16T-R cells, and shReln 16T-G and 16T-R cells (Fig. 6g). The resulting brain tumours were composed of red and green cells with same-colour patches of variable sizes. Tumours with a mix of shReln 16T-G and 16T-R cells showed reduced astrocyte infiltration compared to tumours with a mix of shCtrl 16T-G and 16T-R cells, consistent with our results in N2N1G cells (Fig. 6h,i). In tumours composed of shReln and shCtrl cells, only the larger patches of shReln cells exhibited fewer GFAP+ astrocytes compared with controls (Fig. 6h and Extended Data Fig. 9j), suggesting that control cells may rescue the low astrocyte infiltration of Reelin knockdown cells in this context. In support of both this rescue and of a role of astrocytes in supporting tumour growth, there was no significant difference in tumour size between the shCtrl/shReln groups (orange and red bars and text in the figure) and the shCtrl/shCtrl group (black), whereas 16T tumours fully composed of shReln cells (blue) were significantly smaller (Fig. 6j and Extended Data Fig. 9k). Moreover, shReln SCLC cells were not at a disadvantage when grown in the presence of control cells in the brain (Extended Data Fig. 9l,m). The lower number of astrocytes in shReln tumours was probably not due to a defect in angiogenesis, as indicated by similar expression of CD31 in control and knockdown tumours (Extended Data Fig. 9n–p). These data indicate that Reelin produced by SCLC cells is required for the recruitment of astrocytes that promote the growth of SCLC tumours in the brain.
Reelin is sufficient to increase astrocyte infiltration
To further investigate the function of Reelin in astrocyte recruitment, we overexpressed the central domain (CTD) of mouse Reelin in 4T1 breast cancer cells (Fig. 6k,l), which express low levels of Reelin but can form brain metastases65,66. The binding of the Reelin CTD is sufficient to activate Reelin receptors67. The conditioned medium from Reelin CTD 4T1 cells had significantly higher activity on the migration of mouse astrocytes compared to control medium (Extended Data Fig. 9q). In mice, control 4T1 brain metastases had low astrocyte infiltration with clear borders at the tumour edge (similar to breast cancer brain metastases, Fig. 2c), whereas brain metastases from Reelin CTD 4T1 cells contained significantly more GFAP+ astrocytes (Fig. 6m,n). Reelin CTD 4T1 brain metastases, but not liver metastases, were larger than controls (Fig. 6o and Extended Data Fig. 9r). Thus, Reelin expression is sufficient for the recruitment of pro-tumour astrocytes to brain metastases in this context.
Functional crosstalk between astrocytes and SCLC cells
To investigate how SCLC-activated astrocytes support the growth of brain metastases, we performed bulk RNA-seq of human astrocytes co-cultured for 5 days with 2 human SCLC cell lines (Fig. 7a, Extended Data Fig. 10a and Supplementary Table 5). GO analysis of the upregulated genes in astrocytes co-cultured with SCLC cells identified pathways also enriched in tumour-associated astrocytes in mice (for example, hypoxia, metabolism; see Extended Data Fig. 2d), along with enrichment in programmes involved in cell death (Fig. 7b, Extended Data Fig. 10b and Supplementary Table 6). In particular, we noticed an upregulation of genes coding for neuroprotective factors that are normally secreted by astrocytes to support the survival of neurons during brain development or following acute injury, such as nerve growth factor (NGF), brain-derived neurotrophic factor (BDNF), transforming growth factor alpha (TGFα) and serpin family E member 168,69 (SERPINE1; also known as plasminogen activator inhibitor 1 (PAI-1)). When we compared upregulated genes in human astrocytes cultured with human SCLC cells and tumour-associated astrocytes in mice (Fig. 7a and Extended Data Fig. 2a), we identified 11 genes whose expression was upregulated in both datasets (Fig. 7c). Although several factors are likely to contribute to the pro-survival effects of astrocytes on SCLC cells, we focused on SERPINE1, a secreted SERPIN family protein that inhibits apoptosis in several contexts70–72. Secretion of SERPINs by brain metastatic breast and lung adenocarcinoma cells promotes the growth of these brain metastases, in part by counteracting cell death signals coming from anti-cancer astrocytes73. In the case of SCLC, SERPINE1 expression was significantly upregulated in tumour-associated astrocytes but not in the cancer cells themselves (Supplementary Table 7 and Extended Data Fig. 10c–e). The SERPINE1 immunofluorescence signal was higher in GFAP+ astrocytes associated with brain tumours compared with astrocytes from control brain sites (Fig. 7d,e). SERPINE1 expression was also detectable at a higher level in astrocytes present in human SCLC brain metastases compared with control brain sites (Extended Data Fig. 10f,g).
Fig. 7 |. Astrocytes reactivated by SCLC cells upregulate anti-apoptotic programmes.
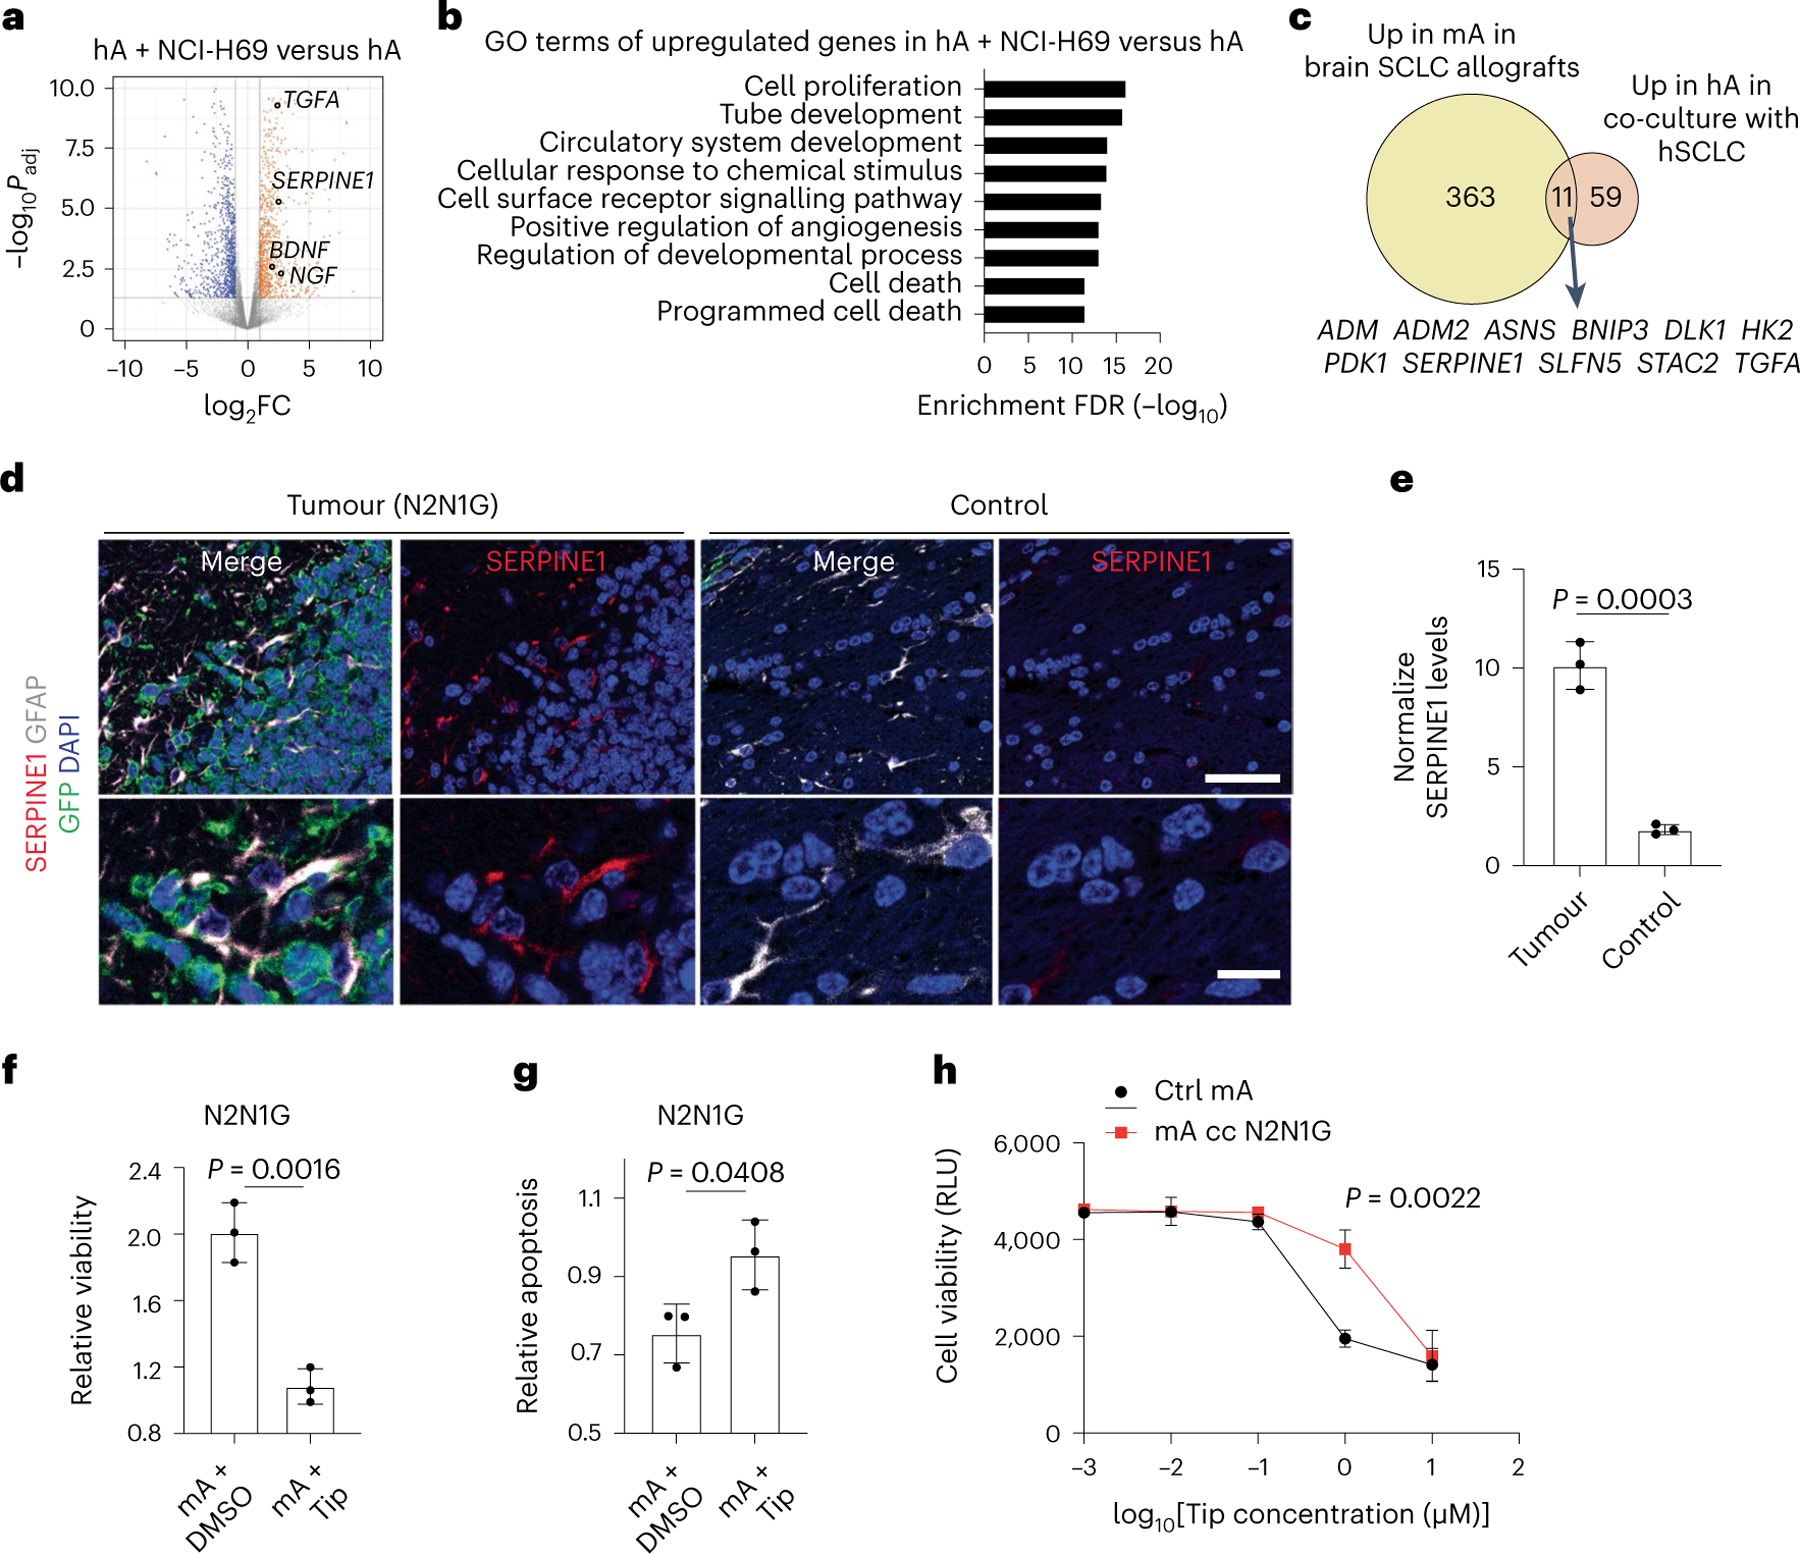
a, Volcano plot showing differentially expressed genes in human astrocytes co-cultured with NCI-H69 cells compared to human astrocytes cultured alone. Selected genes are indicated. Padj values calculated by the Wald test with correction for multiple comparison. b, GO enrichment (top 9) for genes upregulated in human astrocytes co-cultured with NCI-H69 cells. c, Overlap between upregulated genes in tumour-associated mouse astrocytes and human astrocytes co-cultured with SCLC cells. The 11 overlapping genes are indicated. d, Representative immunofluorescence staining images of GFAP and SERPINE1 in a brain tumour from N2N1G mouse SCLC cells. Blue, DAPI DNA stain. Scale bar, 50 μm (top) and 10 μm (bottom). e, Quantification of SERPINE1 immunofluorescence intensity in astrocytes normalized to normal adult brain region from images as in (d) (N2N1G, n = 3 tumours). f,g, Relative viability (f) and apoptosis (g) of N2N1G cells cultured with mouse astrocytes with or without the SERPIN1 inhibitor tiplaxtinin (Tip, 5 μM) compared to N2N1G cells cultured alone. n = 3 independent experiments. h, Dose–response (measured cell viability via Alamar blue) of tiplaxtinin on mouse astrocytes. Black, naive astrocytes. Red, astrocytes reactivated by N2N1G cells. RLU, relative luminescence unit. Data are mean ± s.d. P values by two-sided t-test when comparing two groups and one-way ANOVA when comparing three or more groups; P value calculated by two-way ANOVA in h.
SERPINE1 inhibition by the selective inhibitor tiplaxtinin71,74 (Extended Data Fig. 10h) inhibited the expansion of SCLC cells cultured in medium containing 1% serum (which contains endogenous SERPINE175), and this was partially rescued by recombinant SERPINE1 (Extended Data Fig. 10i–k). Addition of recombinant SERPINE1 to the medium was also sufficient to increase the expansion of SCLC cells (Extended Data Fig. 10i–k). Moreover, tiplaxtinin reduced the pro-growth and anti-apoptotic effects of SCLC-activated astrocytes in both human and mouse cell lines (Fig. 7f,g and Extended Data Fig. 10l–o). Tiplaxtinin inhibited the growth of astrocytes that have not been cultured with SCLC cells but astrocytes activated by SCLC cells were more resistant (Fig. 7h).
Thus, astrocytes activated by SCLC cells promote the expansion of SCLC cells at least in part by promoting cell survival, including through the secretion of SERPINE1.
Reactive astrocytes promote SCLC cell survival in the brain
RNA-seq analysis of SCLC cells co-cultured with human astrocytes showed upregulation of genes involved in nervous system development, metabolism, apoptosis, and axon guidance, similar to SCLC cells growing in the mouse brain (Supplementary Table 7). Out of the 83 genes upregulated in SCLC cells cultured with human astrocytes (log2FC > 1, adjusted P value < 0.05), 18 (20%) overlapped with genes specifically upregulated in SCLC cells from brain metastases (overlap P = 9.35 × 10⁻⁵) (Extended Data Fig. 10p). These results indicate that the influence of the brain microenvironment on SCLC cells comes in part from the interactions between SCLC cells and astrocytes. To determine whether astrocytes activated and recruited by this paracrine mechanism support SCLC growth in the brain, we injected tiplaxtinin together with N2N1G SCLC cells at the time of intracranial injection. This led to significant tumour inhibition two weeks later (Fig. 8a) without affecting astrocyte infiltration, as expected (Fig. 8b,c), suggesting that SERPINE1 secretion by astrocytes at the time of seeding promotes the growth of brain metastases. Knockdown of Reln in SCLC cells did not alter apoptosis levels in vitro (Extended Data Fig. 10q). By contrast, shReln N2N1G brain allografts, in which astrocytes are largely absent (see Fig. 6), showed significantly increased apoptosis compared with control tumours in which astrocytes are present (Fig. 8d,e). Notably, this apoptotic cell death and decreased tumour size were partly rescued by overexpressing SERPINE1 (Fig. 8f–i and Extended Data Fig. 10r).
Fig. 8 |. Astrocytes recruited to SCLC promote brain tumour growth.
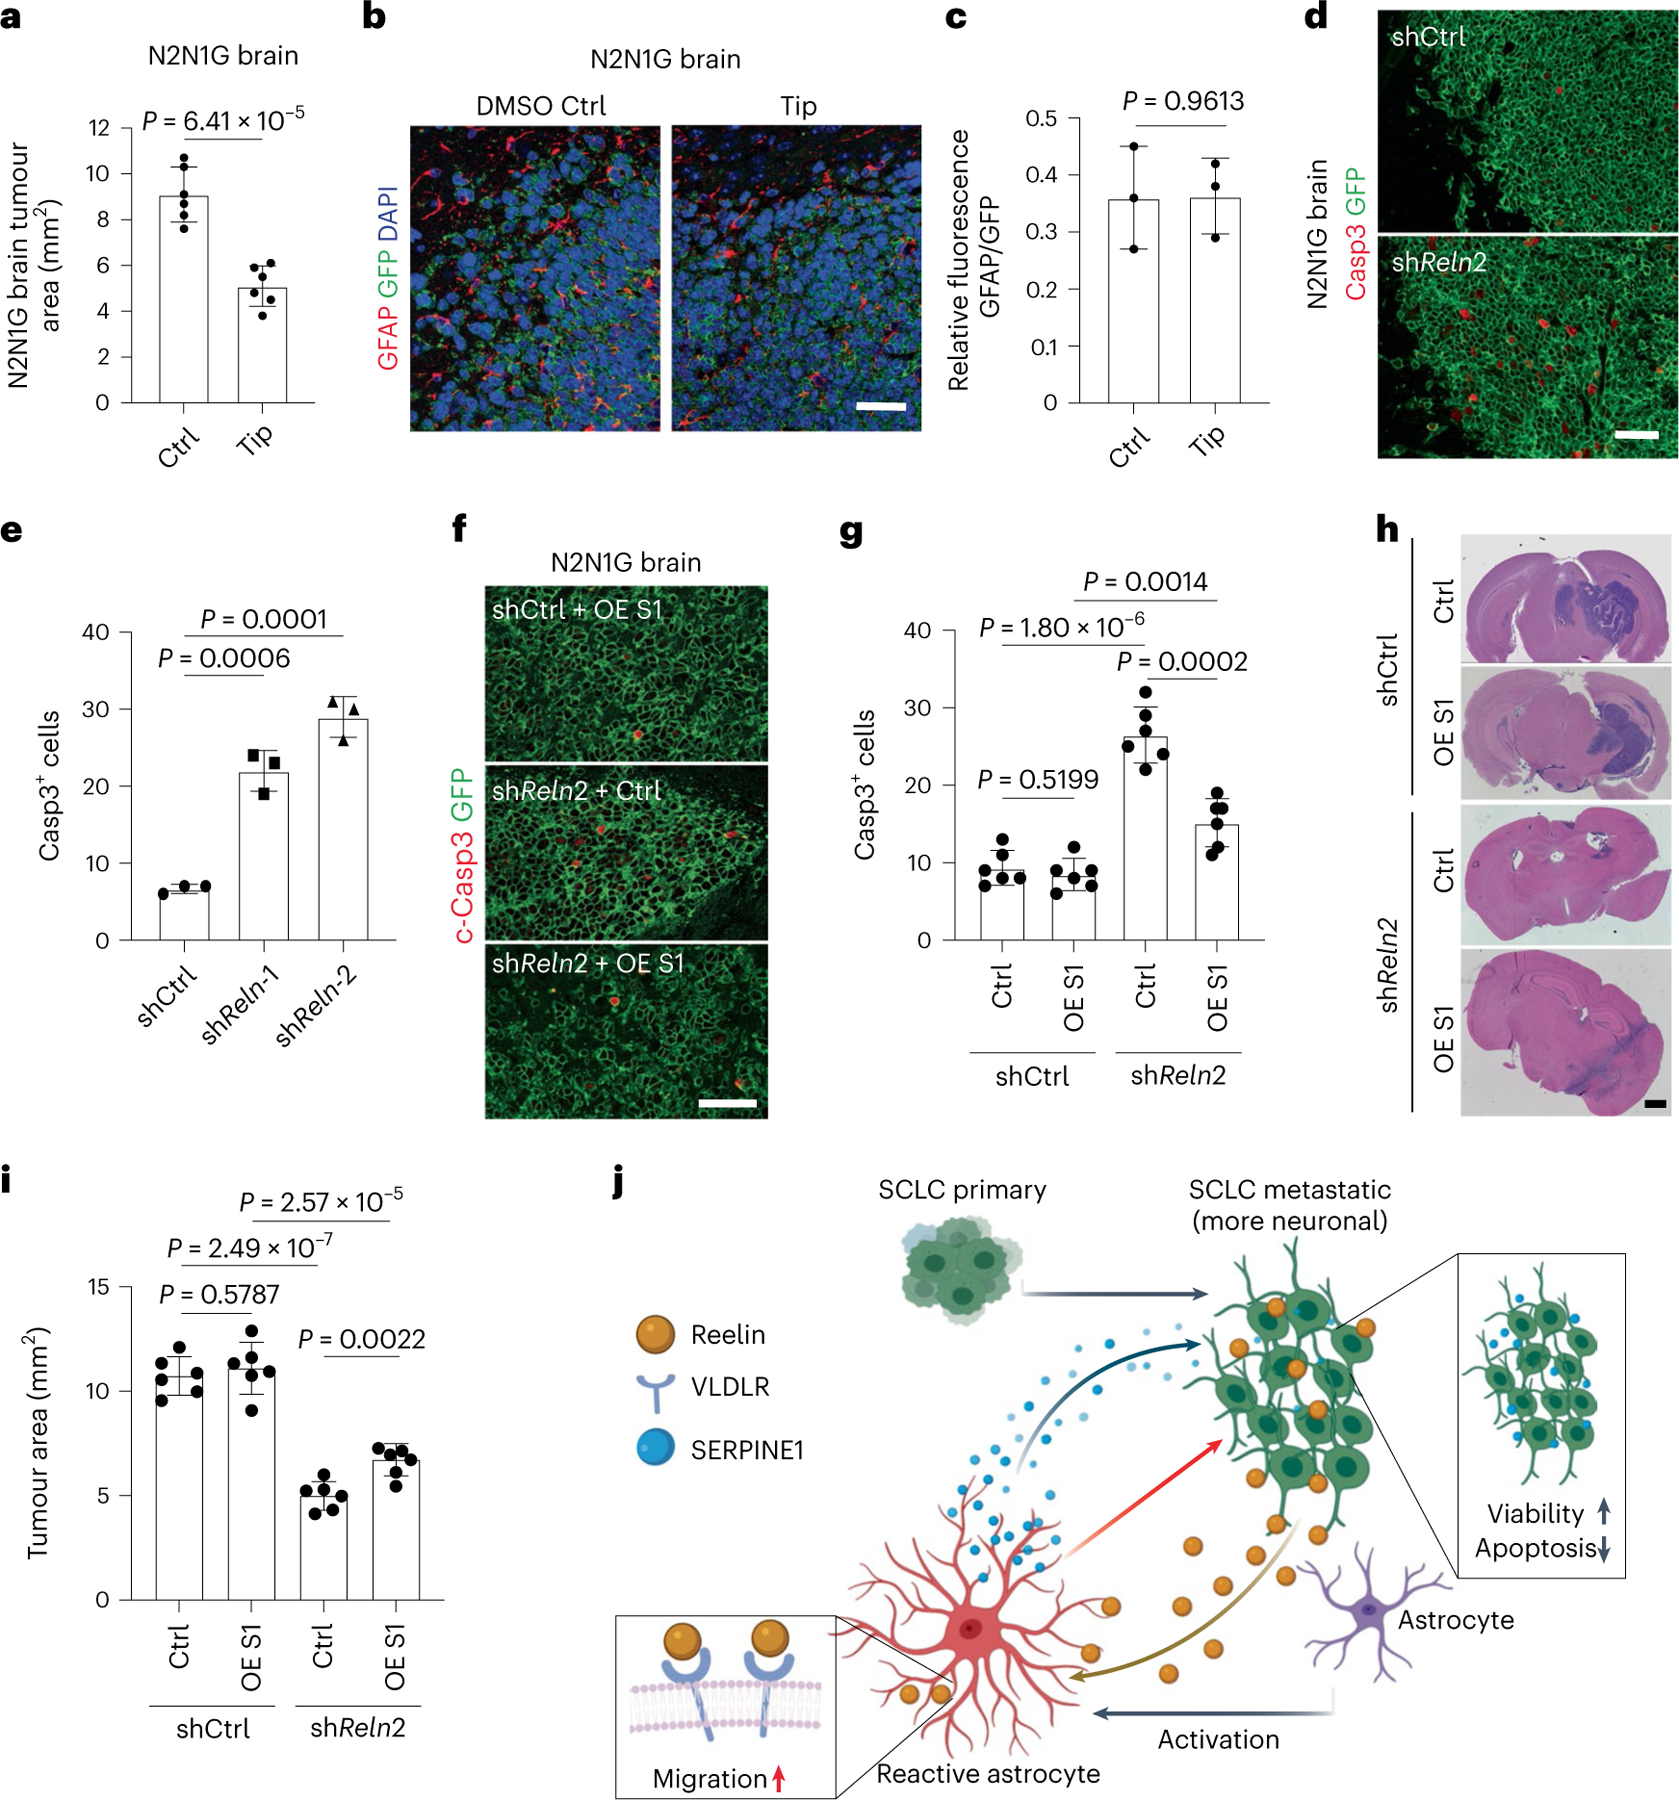
a, Quantification of tumour area after intracranial injection of N2N1G mouse cells with DMSO or tiplaxtinin (n = 6 tumours from 2 experiments) 14 days after injection. b,c, Representative images (b) and quantification (c) of immunofluorescence staining of GFAP in N2N1G allografts treated with DMSO control or tiplaxtinin 7 days after injection. n = 3 independent experiments. Scale bar, 20 μm. d,e, Representative immunofluorescence staining (d) and quantification of Casp3+ shCtrl and shReln N2N1G cells (e) growing in the brain of mice. n = 3 independent experiments. Scale bar, 20 μm. f,g, Representative immunofluorescence staining (f) and quantification (g) of Casp3+ shCtrl and shReln N2N1G cells overexpressing control vector or SERPINE1 (OE S1) when grown in the brain of mice. n = 3 independent experiments. Scale bar, 20 μm. h,i, Representative H&E images (h) and quantification (i) of tumour size from experiment in (f). Tumours appear dark purple. Scale bar, 2 mm. n = 3 independent experiments. j, Working model: SCLC is a neuroendocrine cancer whose neuronal features are often accentuated during tumour progression, including as SCLC cells reach the brain microenvironment. The neuronal programmes expressed by SCLC cells resemble those of neurons during early brain development and reactive astrocytes associated with SCLC cells in the brain also gain features of astrocytes during brain development. Secretion of the brain development molecule Reelin by SCLC cells recruits reactivated astrocytes to the brain metastasis site. Secretion of factors such as SERPINE1 by astrocytes in turn promotes the survival of SCLC cells.
Together, these results indicate that interactions between astrocytes and SCLC cells, including a Reelin-dependent astrocyte recruitment and SERPINE1 secretion, are one of the key aspects of SCLC integration with the brain microenvironment (Fig. 8j).
Discussion
Using an intracranial orthotopic injection model, we studied the crosstalk between SCLC cells and the brain microenvironment. We found that neuronal programmes adopted by SCLC cells allow them to interact with astrocytes in a manner reminiscent of the interactions between neurons and astrocyte progenitors during brain development. This co-optation of brain development mechanisms by SCLC cells may provide therapeutic options to prevent or treat brain metastases.
The unique microenvironment of the brain forces cancer cells to adapt during metastasis. Intriguingly, some cancers acquire neuronal features during tumour progression, potentially aiding interactions with brain cells31,76–79. Transcriptomic changes also occur in brain cells in response to tumours79–81. However, the role of neuronal programmes in facilitating expansion of cancer cells in the brain is not well understood. Our work reveals that SCLC cells reactivate astrocytes through paracrine mechanisms, via still unknown secreted factors. We further identified a role for Reelin produced by SCLC cells and its receptor Vldlr on astrocytes during SCLC growth in the brain. We note that Vldlr is also expressed by SCLC cells, and that Vldlr knockdown can lead to a slight decrease in the ability of SCLC cells themselves to migrate in culture32. Other functional interactions likely remain to be examined, including with neurons82,83.
A limitation of the intracranial injection model that we used in our studies is that seeding is not limited to one or a few cells. In this context, assembloids and refined injection techniques such as intracarotid injections can help model other steps in brain metastasis formation.
SCLC cells that have become less/non-neuroendocrine can serve as a supportive stromal-like population for neuroendocrine SCLC cells in primary tumours39,84–87. Notably, these non-neuroendocrine cells seem to be less frequent or even absent in metastases84, which raises the question of whether other cell types in the metastatic ecosystem may functionally replace them. Intriguingly, these non-neuroendocrine SCLC cells show enrichment for gene programmes related to an astroglial signature84 and they express the neurotrophic astrocytic factor midkine, which can promote the survival of neuroendocrine SCLC cells84. Therefore, neuroendocrine SCLC cells may be intrinsically poised to benefit from factors secreted by astrocytes, which could in part explain the frequent growth of SCLC brain metastases.
Upregulation of SERPINs in breast or non-small-cell lung cancer cells promotes their survival in the brain73,88. Serpine1 expression is also upregulated in non-neuroendocrine SCLC cells in primary lung tumours84. It is unclear why neuroendocrine SCLC cells do not upregulate SERPINs, but the ability of these cells to induce pro-tumour SERPINE1 secretion from astrocytes in the brain tumour microenvironment is a striking example of how tumours can shape their ecosystem. Reactive astrocytes may also contribute to SCLC growth by influencing angiogenesis and providing nutrient support for cancer cells33,38,89,90, as well as by affecting immune responses35,37,91–93.
SERPINE1 inhibitors have been investigated for potential therapeutic use70,94–98 and targeting Reelin signalling pathways shows promises in various cancers99–102. In the future, targeting these molecules or other factors specifically implicated in brain development may benefit patients with SCLC with brain metastases while minimizing side effects in the adult brain.
Methods
Ethics statement
Tumour samples were collected from a consented patient (no compensation) under the approval of the Institutional Review Board at Stanford University to generate the SUBr1 cell line from a post-mortem autopsy (IRB protocol no. 45112); all other human samples from Stanford University and the Medical University of Vienna used for immunostaining were from retrospective studies (no patient consent and no compensation). Mice were maintained according to practices prescribed by the NIH, the Institutional Animal Care and Use Committee (IACUC) at Stanford University, and the Association for Assessment and Accreditation of Laboratory Animal Care (AAALAC). The study protocol was approved by the Administrative Panel on Laboratory Animal Care (APLAC) at Stanford University (protocol no. APLAC-13565).
Animals
Ten-to-twelve-week-old NSG mice were used in all experiments (Jackson Laboratory strain 005557). Mice were housed with a maximum of 5 animals per cage on a 12-h light dark cycle (light from 07:00 to 19:00) at 21 °C and 30–70% humidity. Maximum tumour burden did not exceed 20 mm in diameter. Male and female mice were randomized into control and experimental groups.
Cancer cell lines and cell culture
N2N1G cells were derived from a lymph node metastasis in a Rb/p53/p130 mutant mouse; 16 T and KP1 cells derived from late-stage primary tumours in Rb/p53 mutant mice31,103. In experiments where 16T and KP1 cells needed to be visualized, they were infected with a lentivirus expressing GFP32. KP22 cells were derived from a primary lung tumour in an Rb/p53 mutant mouse. 5PFBl cells were derived from pleural fluid from an Rb/p53/p130 mutant mouse. Human SCLC cell lines were purchased through ATCC, except NJH29, which was derived from a patient-derived xenograft104, and SUBr1, which was newly generated from a brain metastasis at autopsy. In brief, upon dissection and mincing using a razor blade, brain metastases were digested using collagenase/dispase with agitation at 37 °C for 15 min. The samples were treated with DNAse1 and filtered through a 70-μm membrane before expansion in recipient mice. Histological analysis (by C.K.) of xenografts confirmed features of SCLC. RNA-seq analysis shows that SUBr1 cells express Ascl1 and high levels of Nfib. Cells were cultured for in RPMI, 10% FBS, and penicillin-streptomycin-glutamine at 37 °C with 5% CO2. To dissociate aggregates into single cells, the cells were pelleted, trypsinized with 0.05% Trypsin-EDTA for 1 min, and gently filtered through a 40-μm filter. 4T1 cells were purchased through ATCC and cultured in DMEM, 10%FBS, and penicillin-streptomycin-glutamine at 37 °C with 5% CO2. Cells were trypsinized using 0.05% Trypsin-EDTA for 3 min. 4T1-luc cells were generated with a lentivirus expressing luciferase. 4T1-control GFP-luc and 4T1-Reln CTD–GFP-luc cell lines were generated with lentiviruses expressing GFP or Reln CTD (Leu1221–Ile2661)–GFP. Cell viability was assessed by standard Alamar blue assay and fluorescence was measured using a BioTek plate reader with Gen5 software (excitation wavelength: 530 nm, emission wavelength: 590 nm) and normalized to blank control. Apoptosis was assessed using a cleaved caspase-3/7 activity kit (Promega, 8090). Cell morphology was verified with a table-top Leica microscope. Cells were mycoplasma-negative. Cell line identify was verified using ATCC’s STR service.
Co-culture assays with SCLC cells and astrocytes
Human and mouse astrocytes were obtained from ScienCell Research Laboratories (1800 and M1800) and cultured in a specific medium (AM 1801 and a-AM 1831). For co-cultures, Transwell plates with 0.4-μm pore size were used (Corning). SCLC cells were cultured in the top well, and astrocytes were cultured on the bottom well in a 1:1 mix of RPMI and AM, 1% FBS, and Pen-Strep/Glutamine. Astrocytes were plated 24 h before adding SCLC cells into top wells. For treatment with tiplaxtinin and recombinant proteins, cells were cultured for 24 h before adding 5 μM tiplaxtinin (SelleckChem, S7922) or DMSO control. Recombinant human Reelin 100 ng ml−1 (R&D Systems, 8546-MR-050) and mouse Reelin (R&D Systems, 3820-MR), human SERPINE1 (R&D Systems, 1786-PI) were used in these assays.
Chemotaxis assays
Astrocyte chemotaxis was assessed in the Transwell migration system with 8-μm pore size membranes (BioVision, K906). Astrocytes were cultured in the top well for 4 h before adding SCLC-conditioned medium or medium with recombinant proteins, antibodies or inhibitors into the bottom well. Migrated cells were lysed and detected 48 h later using a BioTek plate reader with Gen5 software.
Immunopanning
We followed an anti-HEPACAM immunopanning protocol35,36. Mouse brain tissue or brain tumours were dissected and cut into pieces using razor blades. Samples were digested using the Papain system (Worthington Biochemical Corporation). Plates were coated with anti-rabbit IgG at 4 °Covernight. Plates were rinsed in ice-cold PBS 3 times and then coated with anti-CD45 antibody or anti-HEPACAM antibody at 4 °C overnight. Plates were then rinsed in ice-cold PBS 3 times. Dissociated samples were added to the immunopanning plate with anti-CD45 (1:300) and incubated for 30 min. Unbound samples were then transferred to anti-HEPACAM plates and incubated for 30 min before washing with PBS 5 times. Cells bound to the anti-HEPACAM plates were collected after trypsinization.
ELISA for active and total SERPINE1
Mouse astrocytes co-cultured with SCLC cells for 48 h were collected and then cultured alone in astrocyte culture media without serum for 24 h with 0.1% DMSO control or 5 μM tiplaxtinin in 0.1% DMSO. Medium from the 24-h culture was collected and centrifuged at 2,000g at 4 °C for 30 min. Supernatants were collected and active and total SERPINE1 levels were measured using ELISA kits (Innovative Research, IMSPAI1KTT and IMSPAI1KTA).
Human cortical spheroids and fusion with SCLC
Human cortical spheroids were differentiated from two human iPS cell lines grown in feeder-free conditions50. In brief, iPS cells were seeded in Aggrewell 800 plates (Stem Cell Technologies) at a density of 3 × 10⁶ cells per well. Dorsal forebrain region specificity was achieved by addition of dorsomorphin (5 μM, Millipore Sigma, P5499), SB-431542 (10 μM, Tocris, 1614), and XAV-939 (0.5 μM, Tocris, 3748) to Essential 6 medium (Thermo Fisher Scientific, A1516401) for the first 5 days. On the sixth day, neural spheroids were transferred to a neural medium containing Neurobasal A (Thermo Fisher Scientific, 10888022), B-27 supplement without vitamin A (Thermo Fisher Scientific,12587010), and GlutaMax (2 mM, Thermo Fisher Scientific, 35050061), and penicillin and streptomycin (100 U ml−1, Thermo Fisher Scientific, 15140122). This neural medium was supplemented with EGF (20 ng ml−1, R&D Systems, 236-EG) and FGF2 (20 ng ml−1, R&D Systems, 233-FB), and changed every day until day 15, then every other day until day 24. To promote differentiation to neurons, the neural medium was supplemented with BDNF (20 ng ml−1, Peprotech, 450–02) and NT3 (20 ng ml−1, Peprotech, 450–03), with medium changes every other day. After day 43 cortical organoids were maintained in the neural medium. SCLC aggregates were generated using Aggrewell 800 by adding 3 × 10⁶ cells to each well and centrifuging for 5 min at 100g. After 24 h, spheres were moved to low-attachment plates and cultured for another 3 days before fusing to cortical spheroids. Assembloids were generated by adding a cortical spheroid on top of one or two SCLC aggregates in a 1.5-ml Eppendorf tube filled with 1.2 ml neural medium. Assembloids were grown in the Eppendorf tubes for 5 days for live imaging and another 5 days for immunostaining analysis.
Injection of cancer cells in mice
All procedures were performed under general anaesthesia with isoflurane. Subcutaneous (106 cells in 100 μl PBS mixed with Matrigel 1:1) and intravenous injections (tail vein, 106 cells in 100 μl PBS) were performed as previously described31,32,41. For stereotactic brain injections, the mouse skin was prepared with electric shaving followed by sterilization with 70% ethanol and povidine. A small midline incision was used to expose the skull. A 25 G hole was bored into the parietal bone 2 mm rostral to the central suture and right of the sagittal suture. One-hundred thousand cells were resuspended in 10 μl PBS and injected using a rigid 32 G needle at a depth of 3 mm at a rate of 0.1 μl s−1, allowing 2 min for pressure equilibration. The skull was closed with bone wax, and the skin with nylon sutures. Similar procedures were used for human cells. For intracarotid injections, 104 cells in 50 μl PBS was injected into the common carotid artery with a removable ligation of the external carotid artery. For intracardiac injections, 105 cells suspended in 100 μl PBS were injected into the left ventricle of the heart at ~20-μl increments over 30 s. Samples collected after the same number of days were compared in each experiment.
Single-cell isolation from SCLC brain tumours in mice
Brain tumours were collected from mice, mechanically disrupted using a razor, and digested using collagenase/dispase at 37 °C for 5 min. Samples were treated with DNAse1 and filtered through a 40 μm membrane. GFP+, DAPI− SCLC cells were selected via flow cytometry; GFP− and boiled cells served as separate controls. For non-cancer cells, brain tumours were mechanically disrupted and digested using the Papain system (Worthington Biochemical Corporation). The samples were filtered through a 70-μm membrane and stained with DAPI. GFP− and DAPI− parenchymal cells were selected via flow cytometry.
scRNA-seq analysis
5,000 SCLC cells persample were barcoded and libraries were generated using the V2 10X Chromium system. The samples were sequenced using HiSeq 4000 with a target of 100,000 reads per cell. For non-cancer cells, libraries were generated using the 3′V3.1 10X Chromium system and the samples were sequenced using NovaSeq 6000. Cells with fewer than 500 unique genes, greater than 6,000 unique genes, or greater than 5% of transcripts from mitochondrial genes were excluded. For SCLC cells, cells with no EGFP transcripts or a non-zero number of transcripts from major histocompatibility complex class II HLA genes were also excluded. Data from the retained cells were dimensionally reduced via UMAP of principle components from the 2,000 genes with the greatest variability. Clusters were annotated by unsupervised density-based clustering methods105,106. Reads were aligned using 10X Chromium Cell Ranger software to the mm10 (Ensembl 93) reference genome, with a modification to include the 717-bpcoding sequence for the EGFP protein (Addgene plasmid 26123). Cell cycles were regressed and expression levels were normalized using Seurat. The normalized expression data were dimensionally reduced using PCA, and the results of unsupervised clustering were visualized using UMAP and t-distributed stochastic neighbour embedding. Alignment data from different samples were combined to compare cells from independent replicates, and similar QC methods were applied. To identify enrichment of GO biological processes, genes within each cluster that were significantly different in expression levels (alpha 0.05) and upregulated by greater than 1.5-fold were analysed using the PANTHER overrepresentation test. Results were adjusted for a false discovery rate. To compare aggregates of cells from tumours of the same microenvironment (brain, liver or subcutis) or between aggregates of cells from different microenvironments, all data were first merged, and analogous analyses were then performed.
ATAC–seq library preparation and sequencing
For ATAC–seq, approximately 100,000 cells per replicate was obtained from subcutaneous, liver, and brain tumour samples, and subjected to the OMNI-ATAC–seq protocol107. In brief, the cells were washed with 1 ml of ATAC-RSB buffer at 4°C and centrifuged for 5 min. The resulting pellets were then resuspended in 100 μl of chilled ATAC-RSB-LYSIS, and incubated on ice for 3 min, followed by the addition of 1 ml of ATAC-RSB-WASH and another round of centrifugation. After discarding the supernatant, the pellet was resuspended in 50 μl of OMNI-ATAC Mix and subjected to incubation in a mixing (500 rpm) Thermoblock at 37 °C for 1 h. The tagmented DNA was then purified using a Qiagen MinElute Kit (28204), and 21 μl of elution buffer warmed to 55 °C was added. Library amplification PCR was performed using Nextera primers for 12 cycles and the NEBNext Ultra II Q5 2X Master Mix (NEB M0544S). DNA concentration was measured using a Qubit DNA HS Assay (Thermo Fisher Q33230), and individual samples were pooled and sequenced on an Illumina NextSeq500 using the 75 bp kit in a paired-end configuration. Paired-end raw sequencing reads were processed using CutAdapt (v2.10) to demultiplex and trim reads, using the forward and reverse Nextera sequencing adapters (Fwd - CTGTCTCTTATACACATCT, Rev- AGATGTGTATAAGAGACAG) and a minimum read length of 25. The trimmed reads were aligned to the ENSEMBL mm10 genome (GRCm38) using Bowtie2108, with the options “–local–very-sensitive-local–no-unal–no-mixed–no-discordant”. PicardTools (https://github.com/broadinstitute/picard) were used to mark duplicates, and samtools109 was used to filter them from the BAM files. MACS2 was employed to identify genome-wide peaks, using a q-value of 0.05 and the options “-f BAMPE -g $GENOME_SIZE–nomodel–shift 37–extsize 73”110. Finally, DiffBind111 was used for downstream analysis, which included the generation of a consensus peak set and determining differential peaks between conditions.
Immunofluorescence and immunohistochemistry staining
Mouse tissues were dissected immediately after euthanasia, briefly rinsed in PBS and fixed in 10% formalin overnight. Tissues were then transferred to 70% ethanol before paraffin embedding. Four-micrometre paraffin sections were rehydrated by 5 min serial immersion in Histo-Clear, 100% ethanol, 95% ethanol, 70% ethanol, and water. Antigen retrieval was performed using the H-3300 Citrate-Based Antigen Unmasking Solution (Vector Laboratories) at boiling temperature for 15 min. Slides were then washed in PBST (PBS + 0.1% Tween-20) for 10 min. Samples were blocked by blocking buffer (PBST + 4% horse serum) for 1 h at room temperature and then incubated with specific antibodies against the proteins of interest at 4 °C overnight. Slides were washed in PBST (PBS + 0.1% Tween-20) for 3 times (10 min each) and incubated with secondary antibodies at room temperature for 2 h. Slides were washed in PBST (PBS + 0.1% Tween-20) 3 times (10 min each) and incubated with PBS + DAPI. Slides were washed in PBS for another 5 min and mounted with ProLong Gold anti-fade mounting solution (Thermo Fisher Scientific). The following antibodies were used: anti-Reelin (Abcam, ab78540) 1:500, anti-GFAP (Abcam, ab7260) 1:1,000, anti-GFP (Abcam, ab13970) 1:1,000, anti-NFIB (Abcam, ab186738) 1:1,000, anti-NCAM (Millipore, AB5032) 1:1,000, anti-S100B (Abcam, ab52642) 1:500, anti-vimentin (Cell Signaling, 5741 S) 1:1,000, anti-VLDLR (Novus Biologicals, NBP1–78162) 1:300, anti-SERPINE1 (Novus Biologicals, NBP1–19773) 1:500, anti-MAP2 (Cell Signaling, 4542) 1:1,000 and anti-ICAM1 (Thermo Fisher Scientific, MA5407) 1:1,000.
Imaging and image analysis
Sections were imaged using a Keyence BZ-X700 microscope with BZ-X Viewer program version 1.3.1.1. 2× images were stitched using BZ-X Analyzer 1.4.0.1. Immunofluorescence sections were imaged using a ZEISS LSM 880 confocal microscope at ×40. Analysis for immunohistochemistry and immunofluorescence images was conducted with Fiji 1.53t. Bioluminescence imaging of NSG mice was performed using Lago X from spectral instruments imaging and images were analysed using Aura 4.0 in vivo imaging software.
Quantitative immunoassay and immunoblot analysis
Cells were lysed in TNESV buffer (50 mM Tris-HCl pH 7.5, 1% NP40, 2 mM EDTA, 100 mM NaCl) supplemented with protease inhibitors (10 μg ml−1 aprotinin, 10 μg ml−1 leupeptin and 1 mM PMSF). Total protein was quantified using the Pierce BCA Protein Assay Kit (Thermo Fisher Scientific, 23227). For quantitative immunoassays, the capillary-based simple western assay was performed on the Wes system (ProteinSimple), with 1 μg of protein used per lane. Compass software (ProteinSimple) was used for protein quantification.
Bulk RNA-seq analysis
Transcriptomic analysis of bulk cell samples was performed on SCLC-associated astrocytes and astrocytes from the sham injection injury site for mouse astrocytes and on NCI-H82 cultured with human astrocytes, human astrocytes cultured with NCI-H82, and with NCI-H69. Quality of raw sequencing data was ssessed with FastQC. Transcript expression was quantified into pseudo counts with Salmon v.0.11.3112. RNA-seq pseudo counts were normalized and underwent regularized log2 transformation using DESeq2 package v.1.28.1113 from Bioconductor in R-studio 1.3.1093, R v.4.0.3 (R Foundation for Statistical Computing). GO enrichment analysis was performed in R using the package clusterProfiler v.3.16.1114 and ShinyGo v0.66115. For GSEA comparison to human gene lists from35,36,116, mouse-to-human homologues were downloaded using biomaRt package117 in Bioconductor, and mouse homologues of gene lists were used as query gene sets for GSEA118. as implemented in clusterProfiler package v.3.18.1.
Statistics and reproducibility
All animal experiments were performed with at least nine mice per group in two to three independent experiments. All other experiments were performed with at least three replicates in three independent experiments. The exact numbers of replicates and independent experiments are indicated in each figure legend. For experiments with cell lines, independent replicates were performed at different passages. Statistical significance was assayed with GraphPad Prism software. Data are represented as mean ± s.d. The exact P value is reported whenever applicable. The tests used are indicated in the figure legend. To compare growth curves, we used two-way analysis of variance (ANOVA) followed by t-tests. When comparing more than two groups, we first performed one-way ANOVA, followed by t-tests. If the F-test for variance showed a significantly different distribution between the two groups being compared (F-test P < 0.05), the non-parametric Mann–Whitney P value is reported instead of the Student’s t-test P value. No statistical method was used to predetermine sample size. The Investigators were not blinded to allocation during experiments and outcome assessment. One of the N2N1G cell group isolated from brain for scRNA-seq was excluded because it had very low cell number and DNA recovery.
Extended Data
Extended Data Fig. 1 |. Modeling SCLC brain metastasis in mice following injection of mouse SCLC cells.
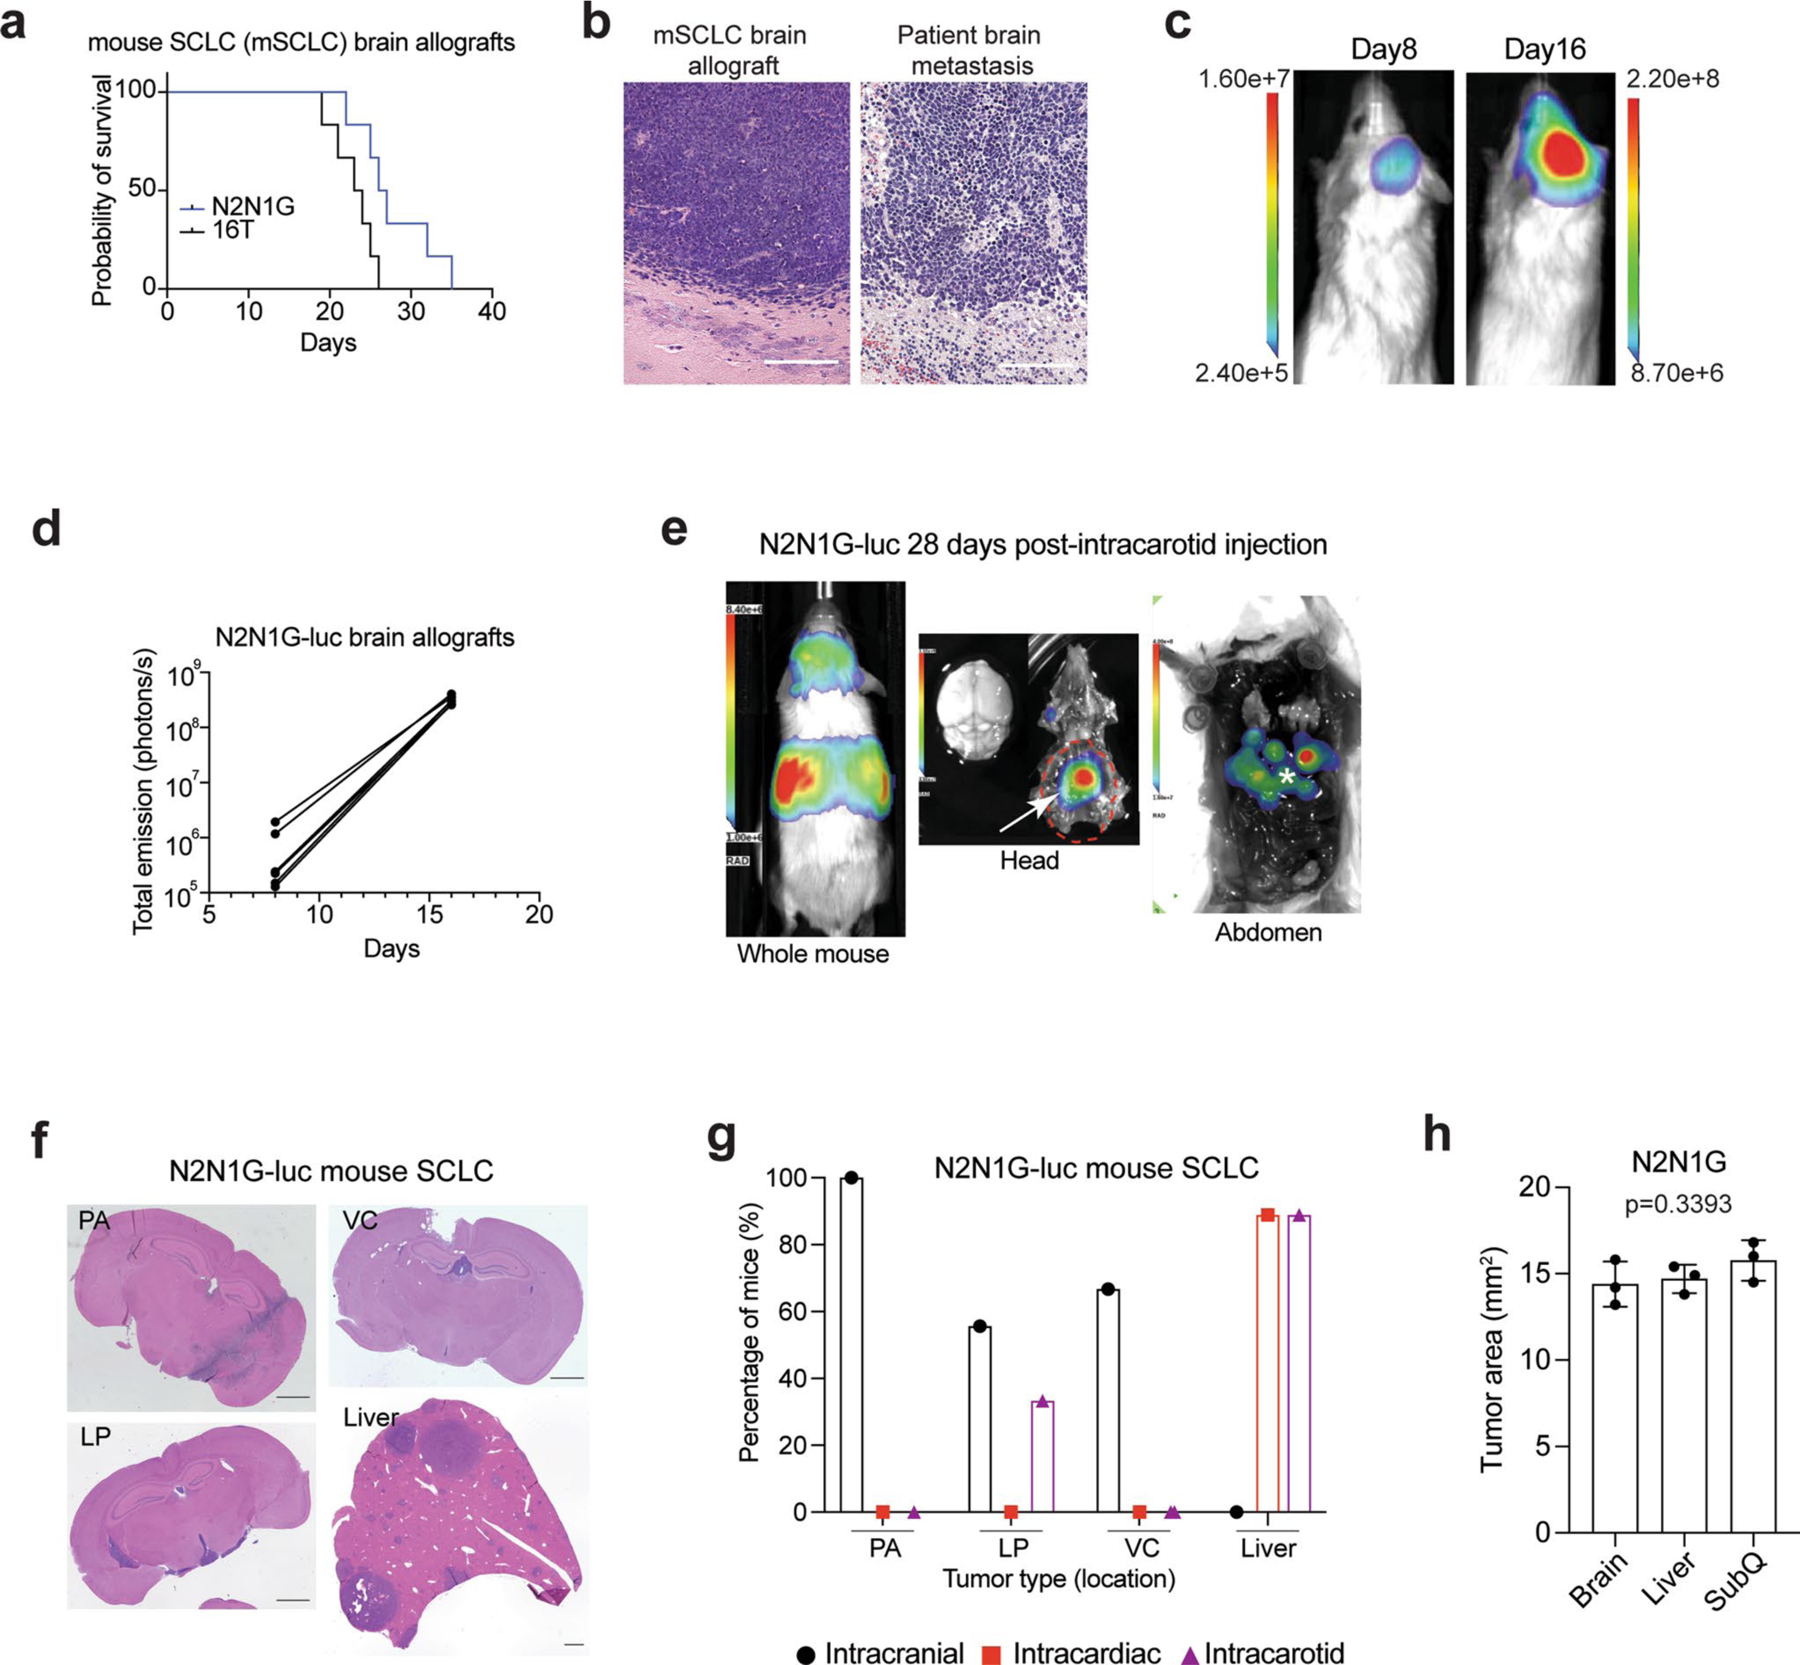
a. Survival data of NSG mice with N2N1G and 16 T mouse SCLC brain allografts (n = 6). b. Representative images of hematoxylin and eosin (H&E) counterstained-brain sections for the N2N1G mouse brain allografts and for human SCLC brain metastases. Similar to human tumors, mouse tumors display stippled chromatin, nuclear molding, scant cytoplasm, and frequent mitotic figures and apoptosis. Dark purple: tumor. Scale, 200 μm. Similar results were observed from 3 biologically independent samples. c. Representative images of luciferase (luc) bioluminescence activity from growing tumors after injection of N2N1G cells stably expressing luciferase (N2N1G-luc). d. Quantification of luciferase bioluminescence signal from 5 mice as in (c). e. Representative image of luciferase bioluminescence following intracarotid injection of N2N1G-luc cells (28 days). White arrow: subcranial tumor; asterisk: liver metastases. f. Representative images of hematoxylin and eosin (H&E) counterstained-brain and liver sections with parenchymal (PA), leptomeningeal (LP), ventricular (VC) brain metastases and liver metastases following injections of N2N1G-luc cells. Scale bar, 1 mm. g. Quantification of (f) for intracranial, intracardiac, and intracarotid injections. n = 9 mice per approach. h. Quantification of N2N1G tumors at different sites (n = 3 each); these tumors were used for analyses in Fig. 1b–d. Data show mean with SD. P value calculated by one-way ANOVA.
Extended Data Fig. 2 |. Reactivation of astrocytes in mouse SCLC brain metastases analyzed by RNA sequencing.
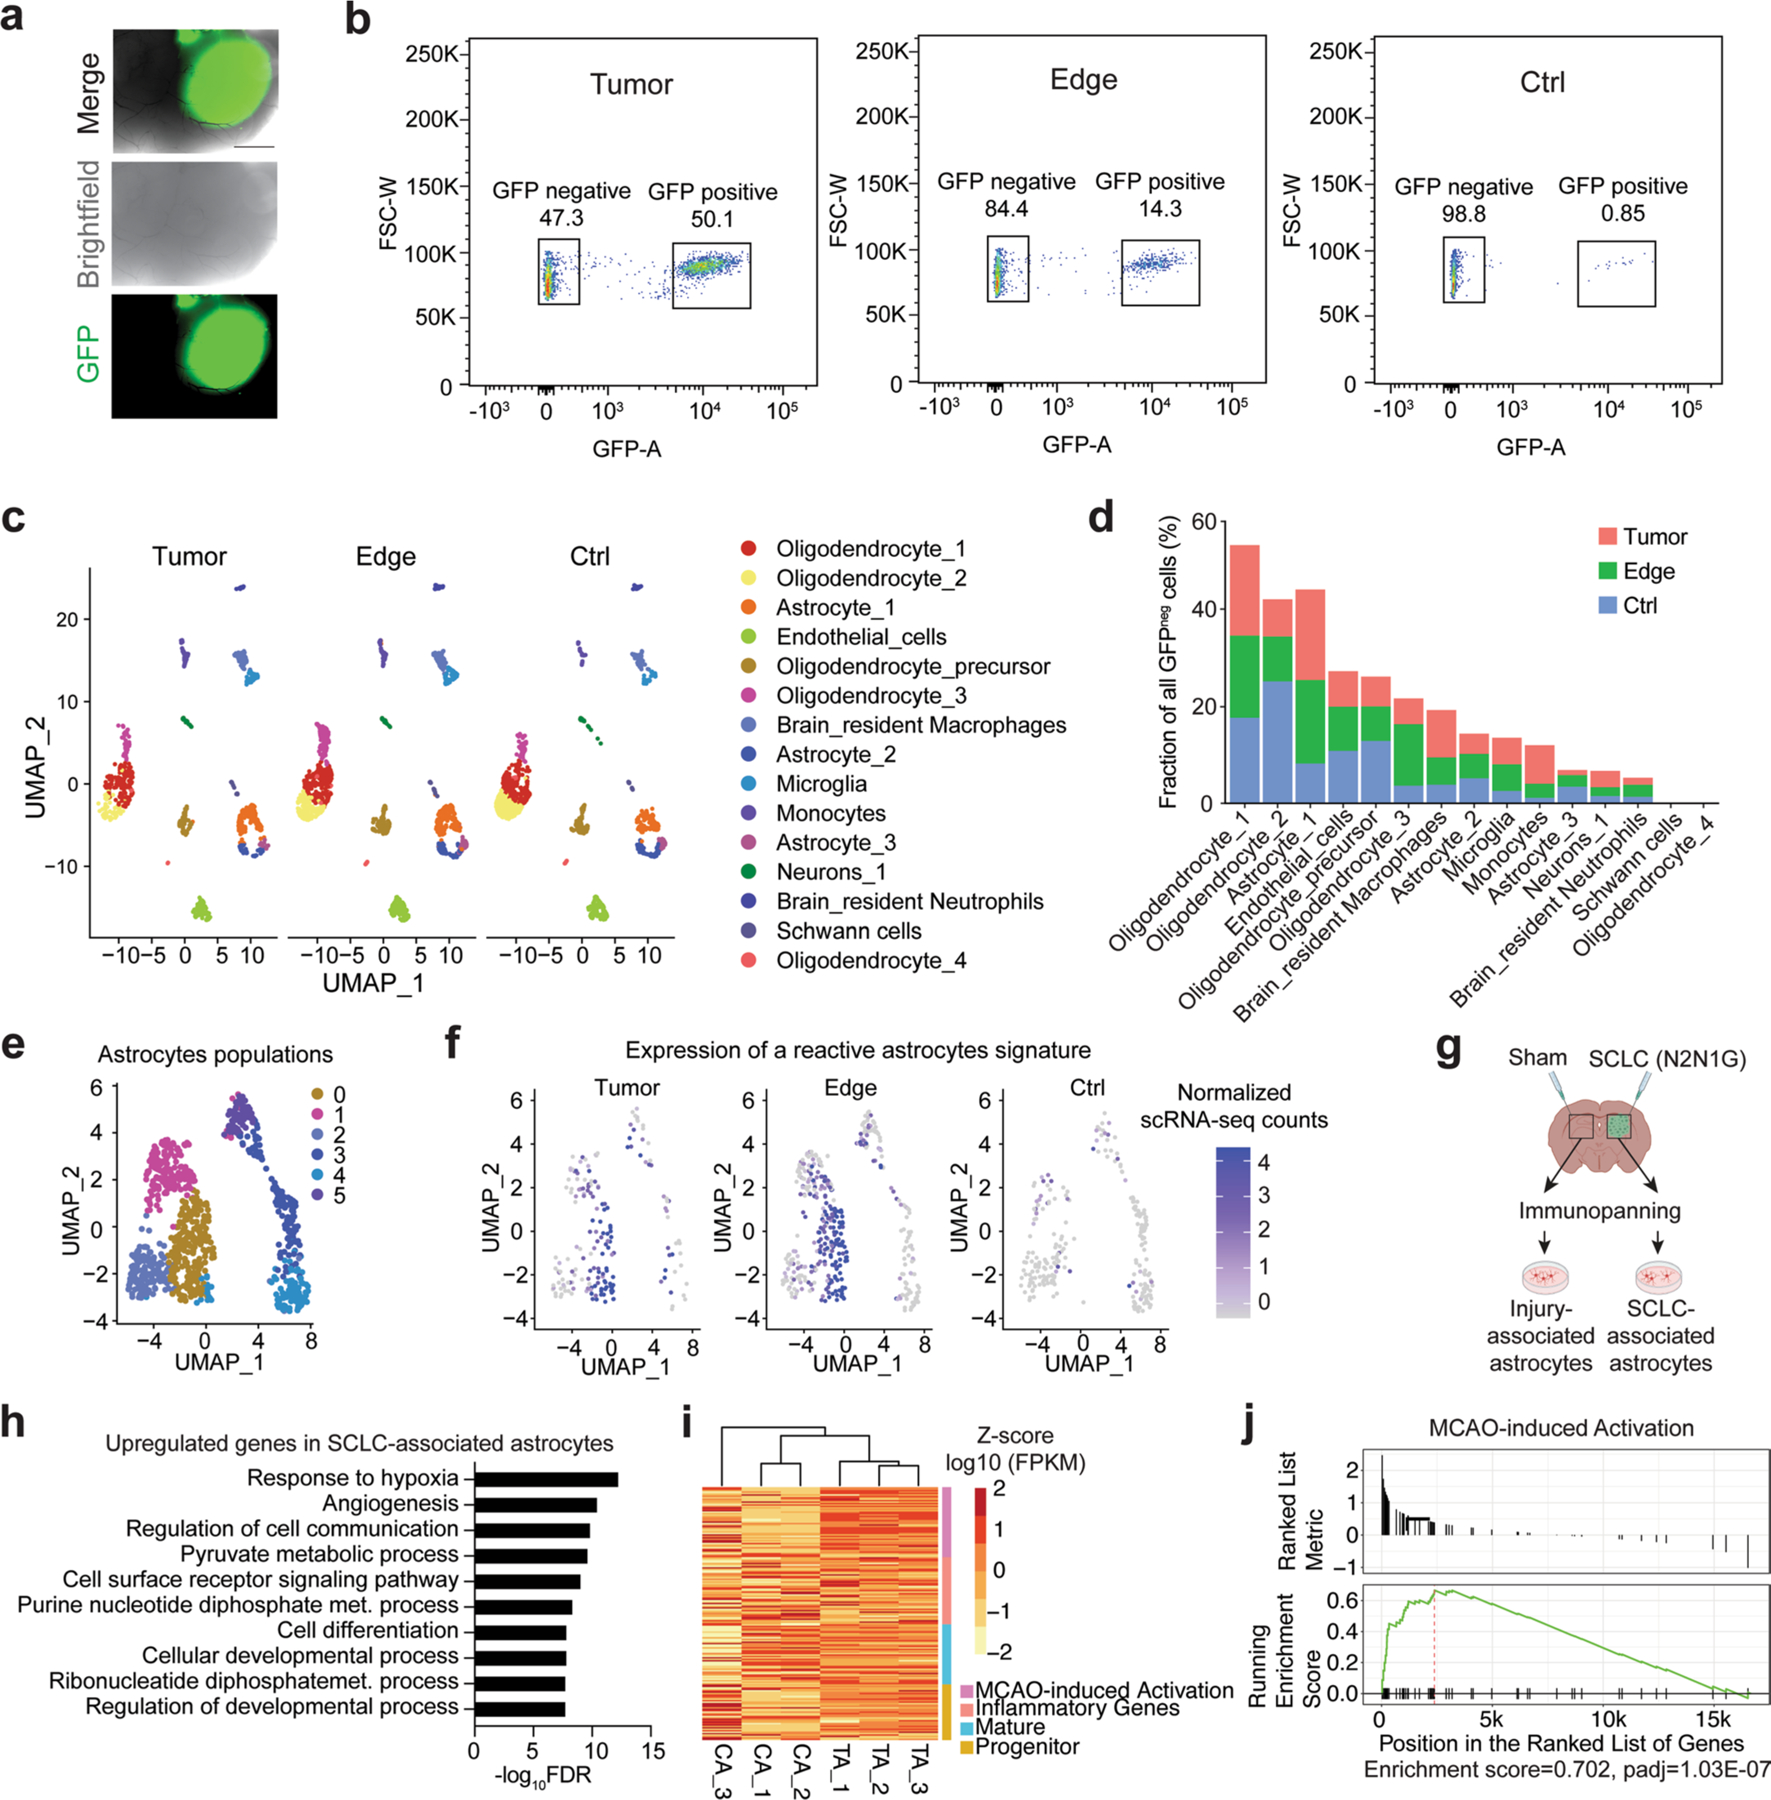
a. Representative fluorescent image of an N2N1G mouse brain allograft (cancer cells are GFP+) 18 days post-injection. Similar results were observed from 6 biologically independent samples from 2 experiments. Scale bar, 1 mm. b. Representative flow cytometry data of all GFP+ cells isolated from an N2N1G brain tumor core, its edge, and the sham control side. c. Uniform Manifold Approximation and Projection (UMAP) analysis of scRNA-seq of GFPneg stromal cells isolated from an N2N1G brain tumor core, its edge, and the sham control side. d. Percentage of each cell type in GFPneg stromal cell populations as in (c). e. Uniform Manifold Approximation and Projection (UMAP) of astrocyte populations from scRNA-seq data from (c). More than 3 populations of astrocytes as in (d) were found when the analysis was focused on astrocytes. f. Expression plot of reactive astrocyte signature genes in astrocyte populations within tumors, at the tumor edge, and in sham injection control regions. g. Schematic representation of the immunopanning protocol to isolate SCLC-associated and injury-associated (surgery and sham injection) control astrocytes before bulk RNA sequencing and analysis. Astrocytes were isolated from the two sides of the brain of the same mice (N2N1G allograft model). Created with BioRender.com h. Gene ontology (GO) enrichment (top 10) for the genes that are upregulated in tumor-associated astrocytes (TA) compared to control astrocytes (CA) as in (g). FDR, false discovery rate. i. Gene expression heatmap of TA and CA grouped by signature genes of alternative activation, inflammatory genes, mature, and progenitor astrocytes (RNA-seq). j. Gene Set Enrichment Analysis (GSEA) for an MCAO (middle cerebral artery occlusion)-induced activation signature (Heiland et al., 2019) for genes upregulated in N2N1G brain TA compared to CA.
Extended Data Fig. 3 |. Reactive astrocytes infiltrate SCLC brain metastases in mice and humans.
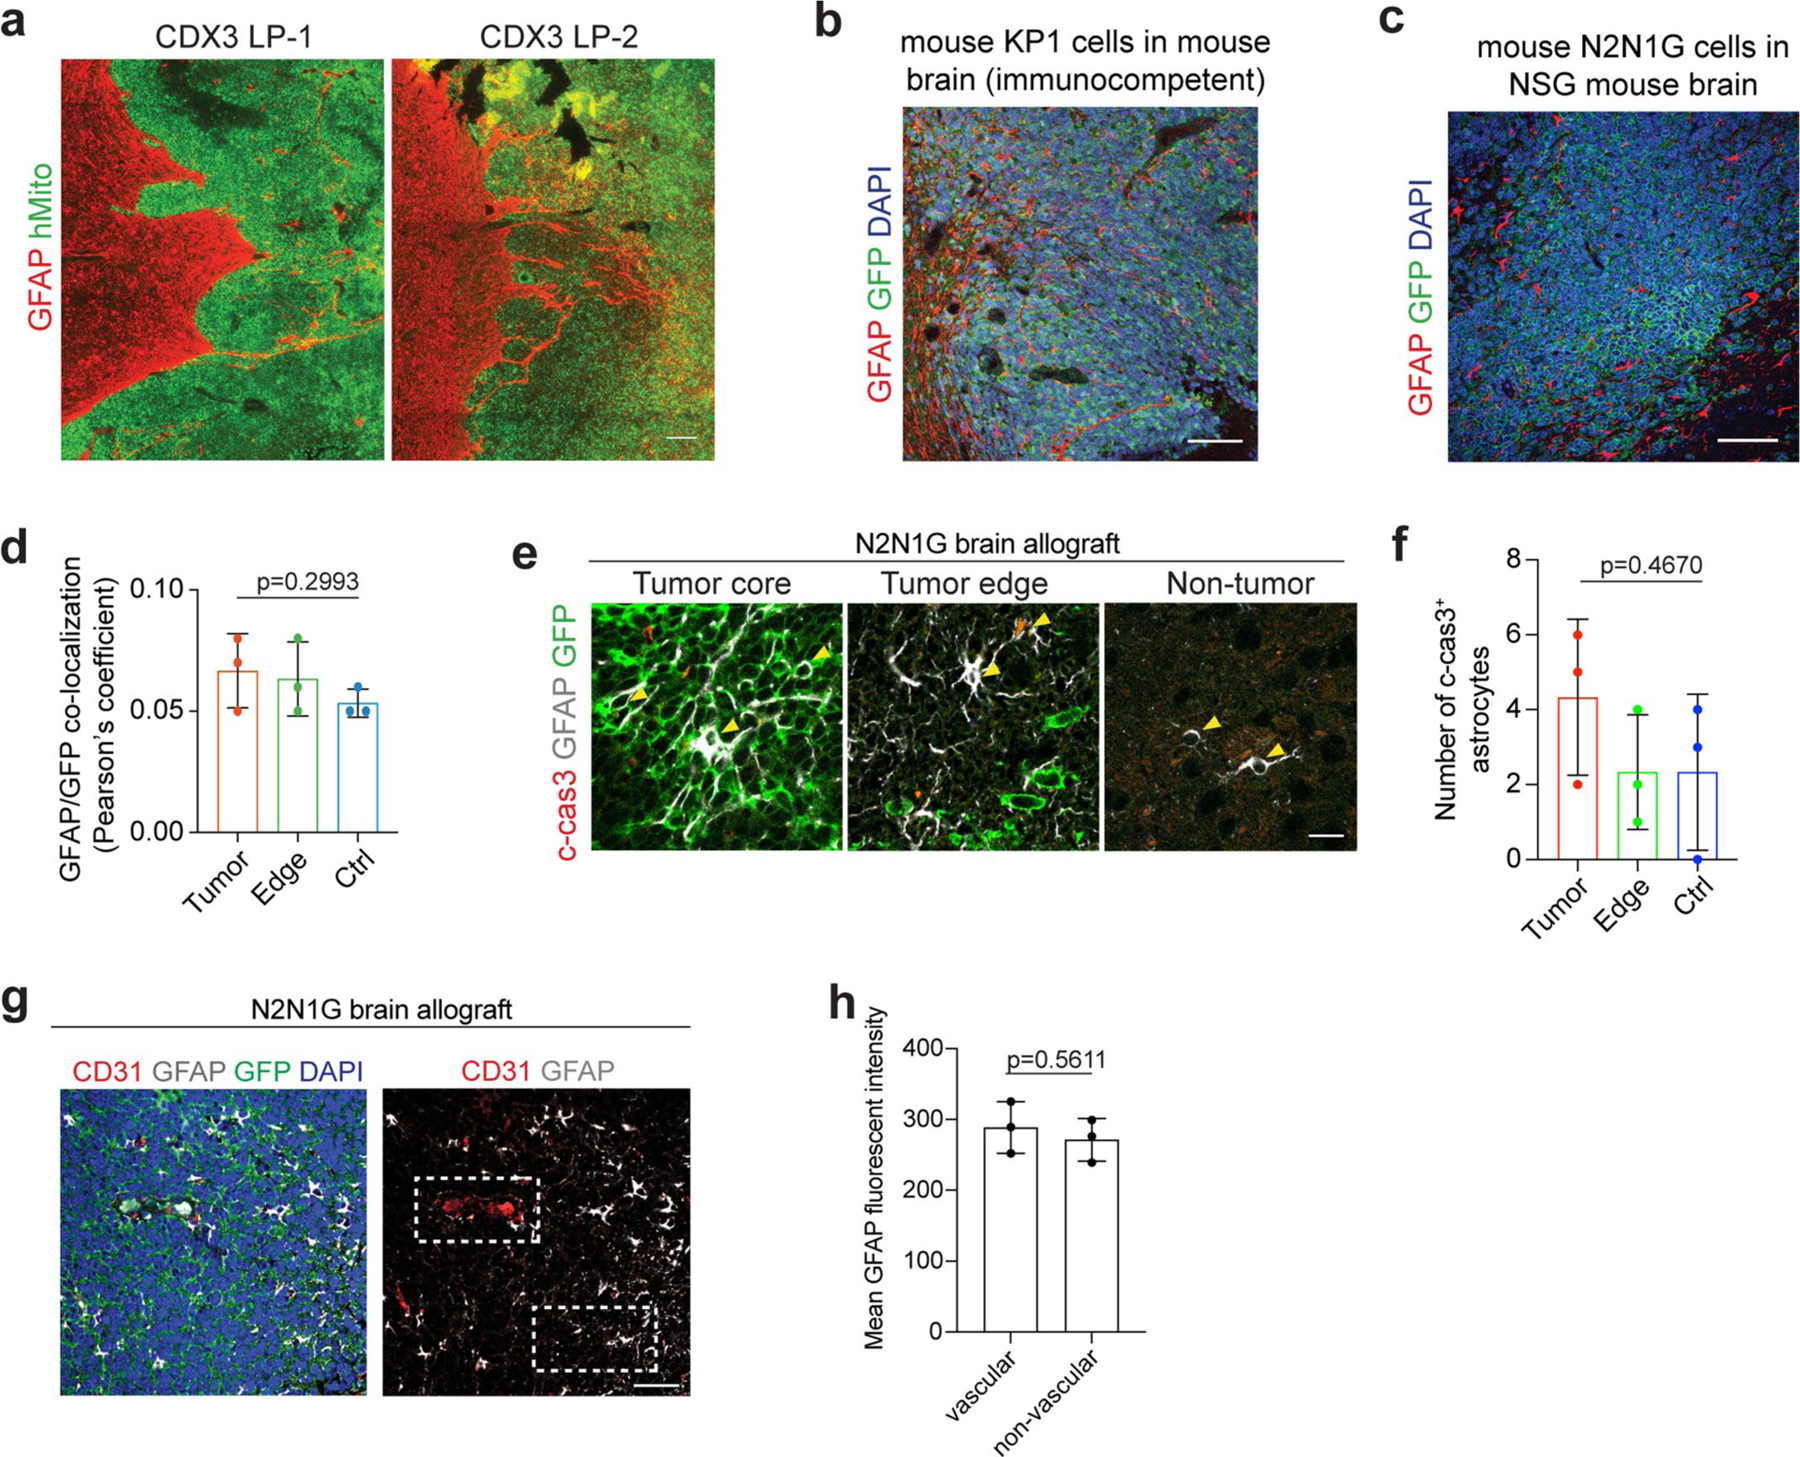
a. Representative images showing immunofluorescent staining of GFAP (red, astrocytes) and human mitochondria (hMito, green, SCLC CDX3 xenograft model) on sections from a leptomeningeal metastasis (LP). Scale, 100 μm. Similar results were observed from 3 biologically independent samples. b. Representative images showing immunofluorescent staining of GFAP (red) and GFP (green for SCLC cells) on sections from an immunocompetent mouse SCLC allograft model (KP1-GFP cells). Similar results were observed from 4 biologically independent samples. Blue, DAPI DNA stain. Scale, 50 μm. c, d. Representative images (c) showing immunofluorescent staining of GFAP (red) and GFP+ N2N1G SCLC cells (green) and quantification (d) of colocalization (Pearson’s coefficient for the red and green channels). n = 3 biologically independent samples. Blue, DAPI DNA stain. Scale, 50 μm. e, f. Representative immunofluorescent staining images (e) and quantification (f) of cleaved-caspase 3 (c-cas3) expression on a section from a GFP+ N2N1G SCLC brain allograft. n = 3 biologically independent samples. P values calculated by one-way ANOVA for (d) and (f). g-h. Representative immunofluorescent staining images (g) and quantification (h) of perivascular and non-perivascular astrocytes (GFAP+). CD31 stains endothelial cells in the vasculature. n = 3 biologically independent samples. Data show mean with SD. P values calculated by two-sided t-test when comparing two groups and one-way ANOVA when comparing three and more groups.
Extended Data Fig. 4 |. Astrocytes activated by SCLC cells promote the growth and survival of mouse and human SCLC cells.
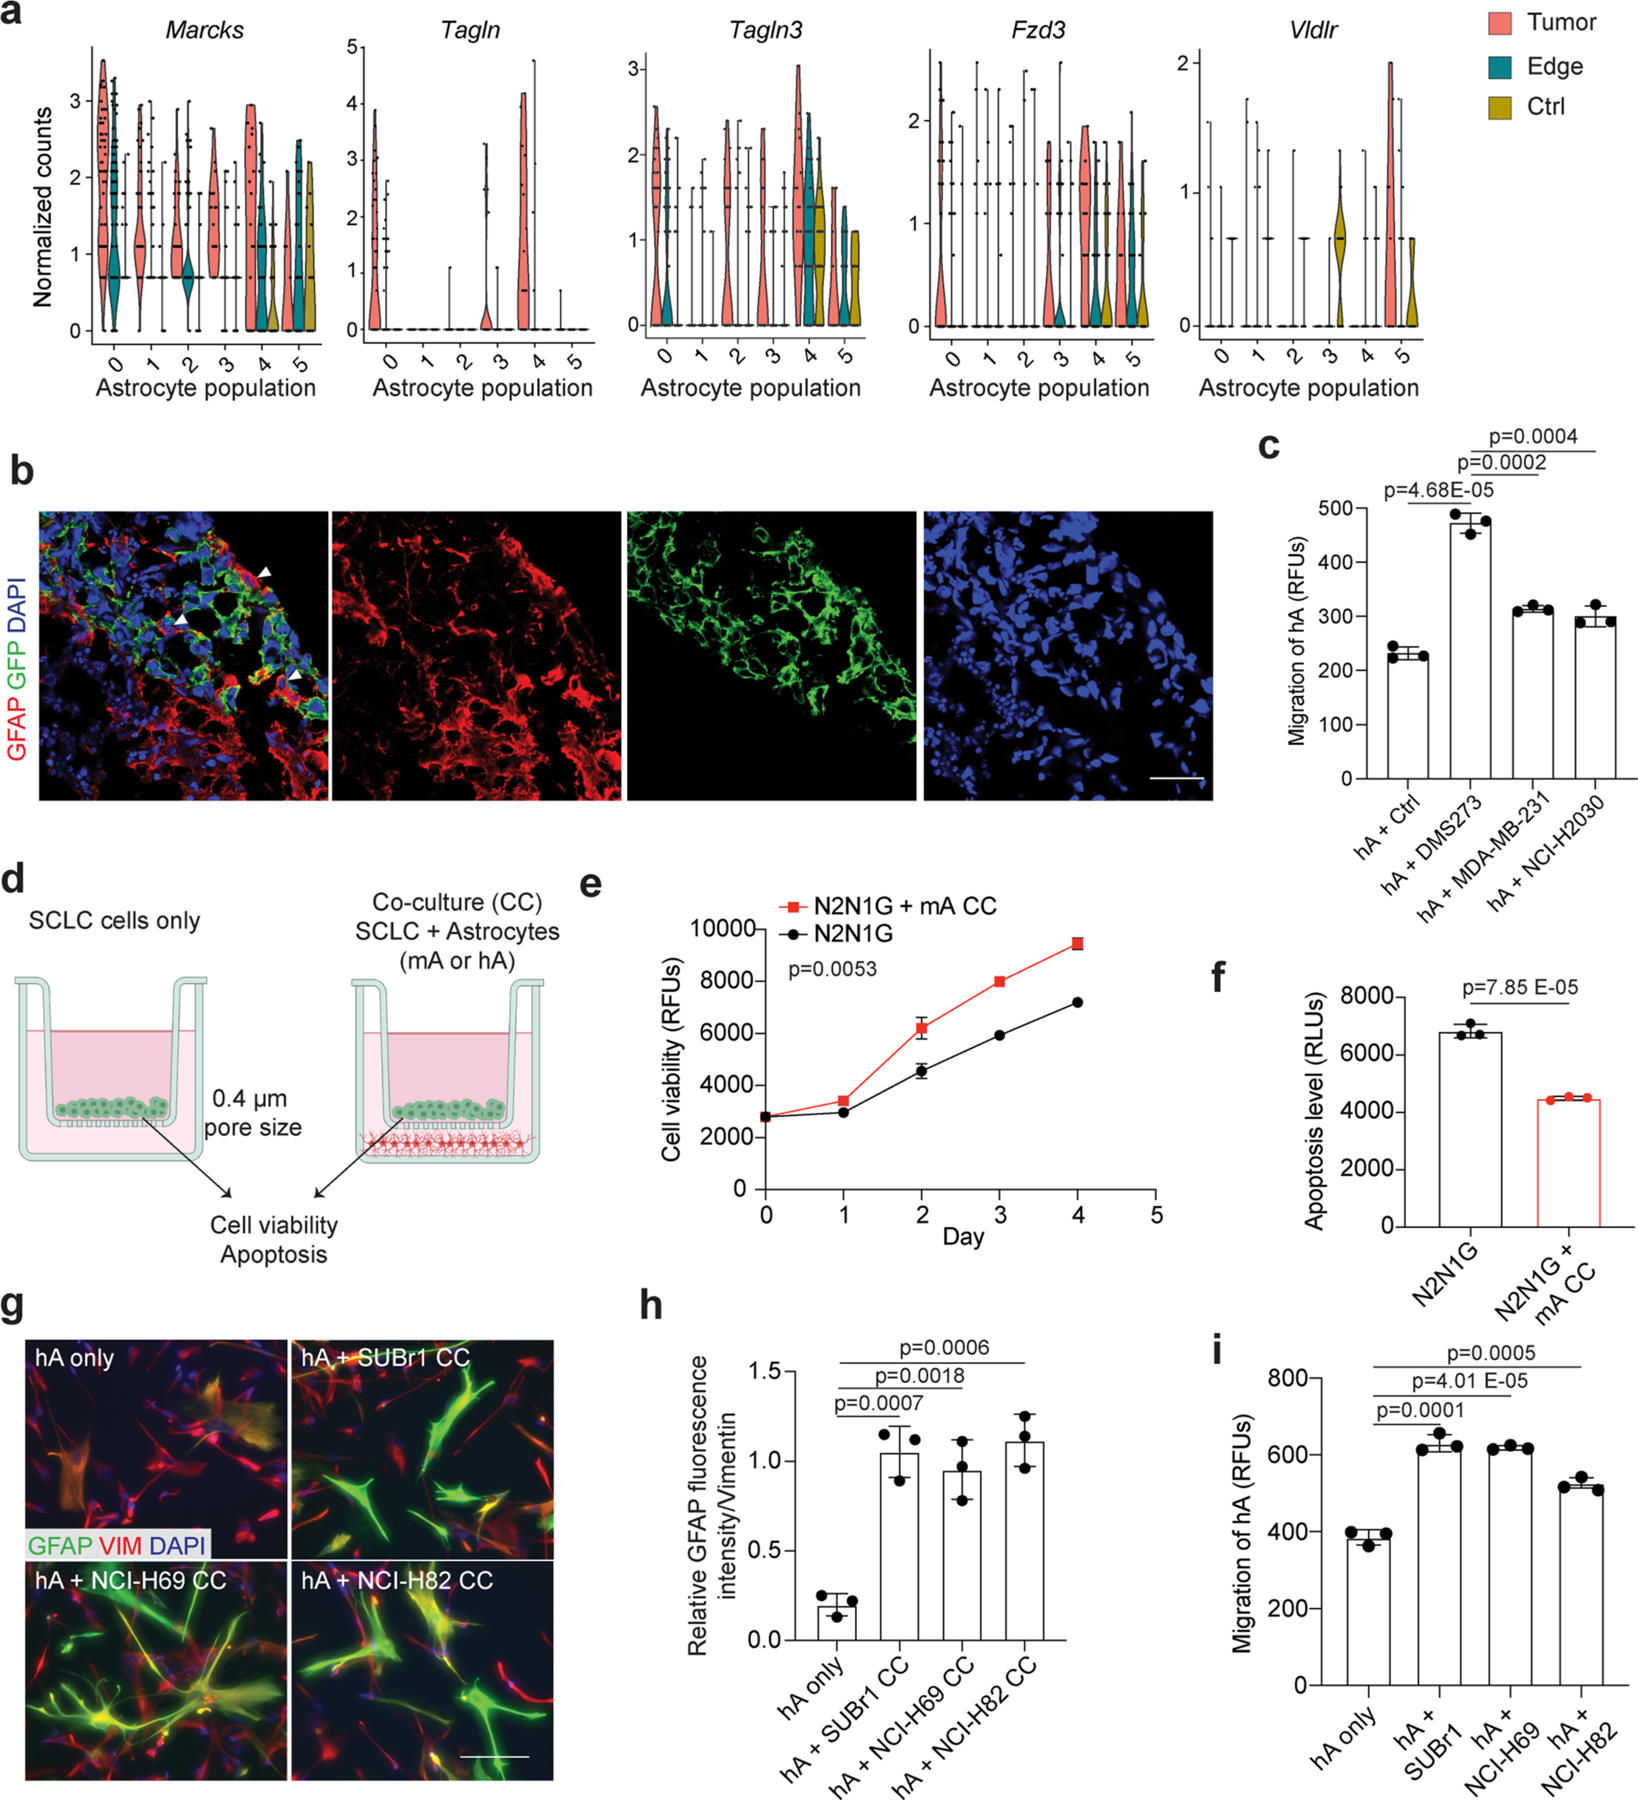
a. Expression of upregulated cell migration genes in astrocyte populations (as in Extended Data Fig. 2e) from tumor or tumor edge compared to a sham injection control. n = 3 animals. b. Representative high magnification images of immunofluorescent staining of GFAP (red) and GFP (green for human cancer cells) at an SCLC-hCO assembloid fusion interface showing the cell body of astrocytes within the SCLC aggregate. Showing separate channel images from Fig. 3d. Scale, 20 μm. c. Quantification of human astrocyte chemotaxis in control medium and human cancer cell-conditioned medium. d. Schematic description of the astrocyte-SCLC co-culture assay. Created with BioRender.com e, f. Cell viability (AlamarBlue assay, RFU: relative fluorescent unit) (d) and apoptosis (caspase3/7 activity, RLU: relative luminescence unit) (e) measured in N2N1G cells cultured with (red) or without (black) mouse astrocytes (mA). n = 3 independent experiments. g. Representative images showing immunofluorescent staining of human astrocytes (hA) cultured alone or co-cultured with human SCLC cell lines (SUBr1, NCI-H69, and NCI-H82). GFAP (green), Vimentin (VIM, red). Blue, DAPI DNA stain. Scale, 20 μm. h. Quantification of GFAP fluorescent intensity relative to Vimentin (n = 6 from 3 independent experiments). i. Quantification of hA chemotaxis toward human SCLC-conditioned medium. N = 3 independent experiments. Data show mean with SD. P values calculated by two-sided t-test for (c)(f)(h)(i), and two-way ANOVA for (e).
Extended Data Fig. 5 |. Paracrine mechanisms in the promotion of the growth and survival of SCLC cells by reactive astrocytes.
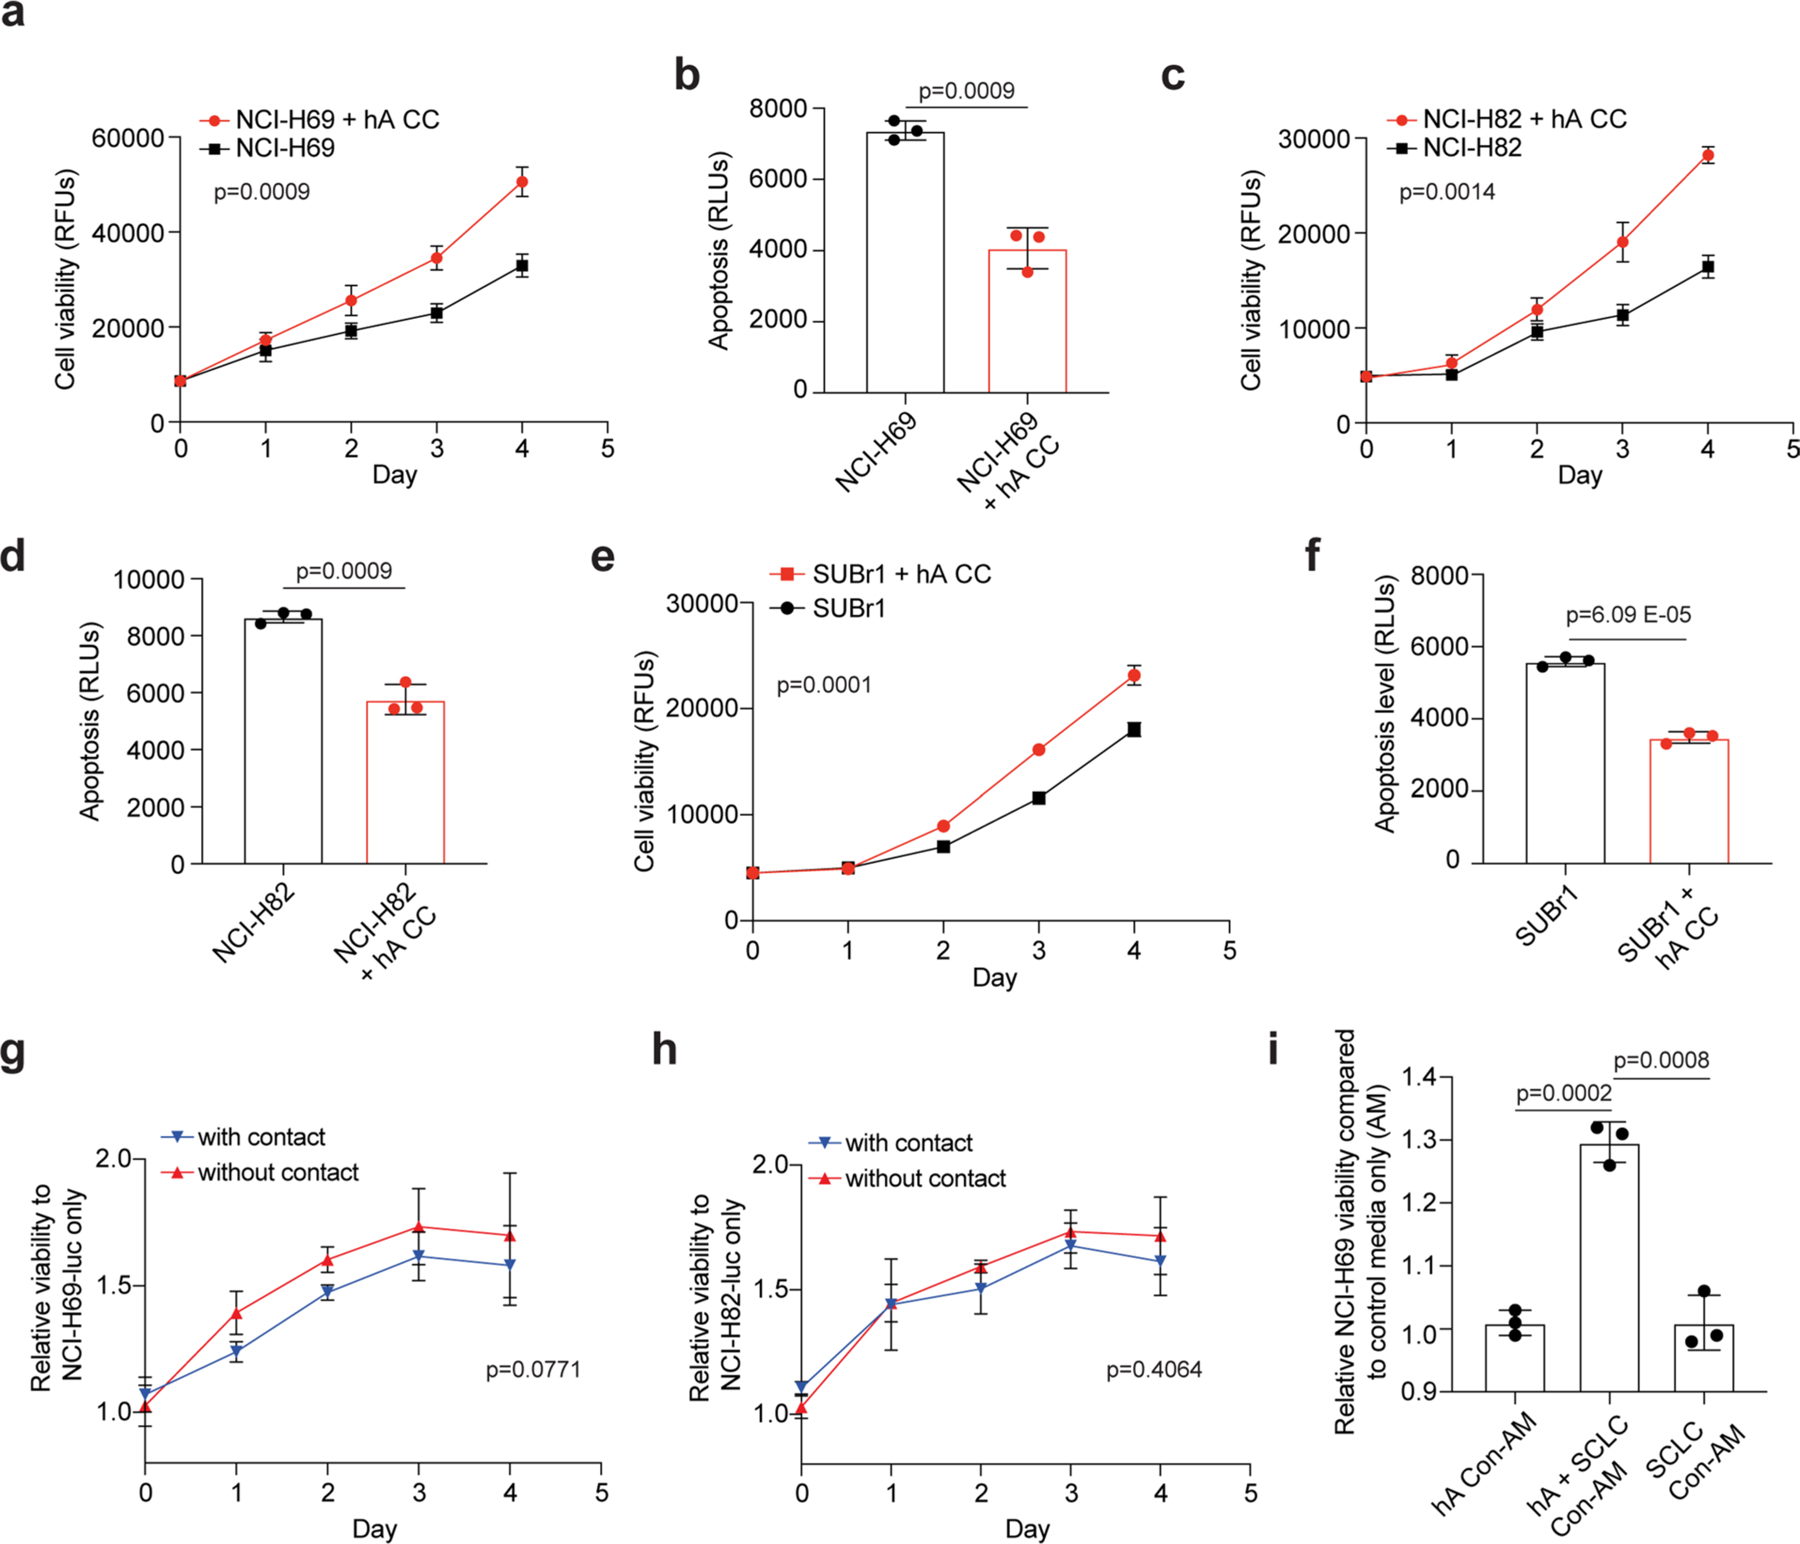
a, b. Cell viability (AlamarBlue assay, RFU: relative fluorescent unit) (a) and apoptosis (caspase3/7 activity, RLU: relative luminescence unit) (b) measured in NCI-H69 cells cultured with (red) or without (black) human astrocytes (hA), as in Extended Data Fig. 3c. c, d. As in (a-b) with NCI-H82 cells. e, f. As in (a-b) with SUBr1 cells. g, h. Relative cell viability (luciferase activity) of NCI-H69 (g) or NCI-H82 (h) cells co-cultured with (blue) or without (red) direct contact with hA during co-culture. i. Relative cell viability of NCI-H69 cells cultured in astrocyte-conditioned medium (hA Con-AM), SCLC-astrocyte co-culture-conditioned medium (hA + SCLC Con-AM), or SCLC-conditioned medium (SCLC Con-AM). n = 3 independent experiments. P values calculated by two-sided t-test for (b)(d)(f)(i) and two-way ANOVA for (a) (c)(e)(g)(h).
Extended Data Fig. 6 |. Correlation between NFIB levels and the growth of SCLC brain metastases.
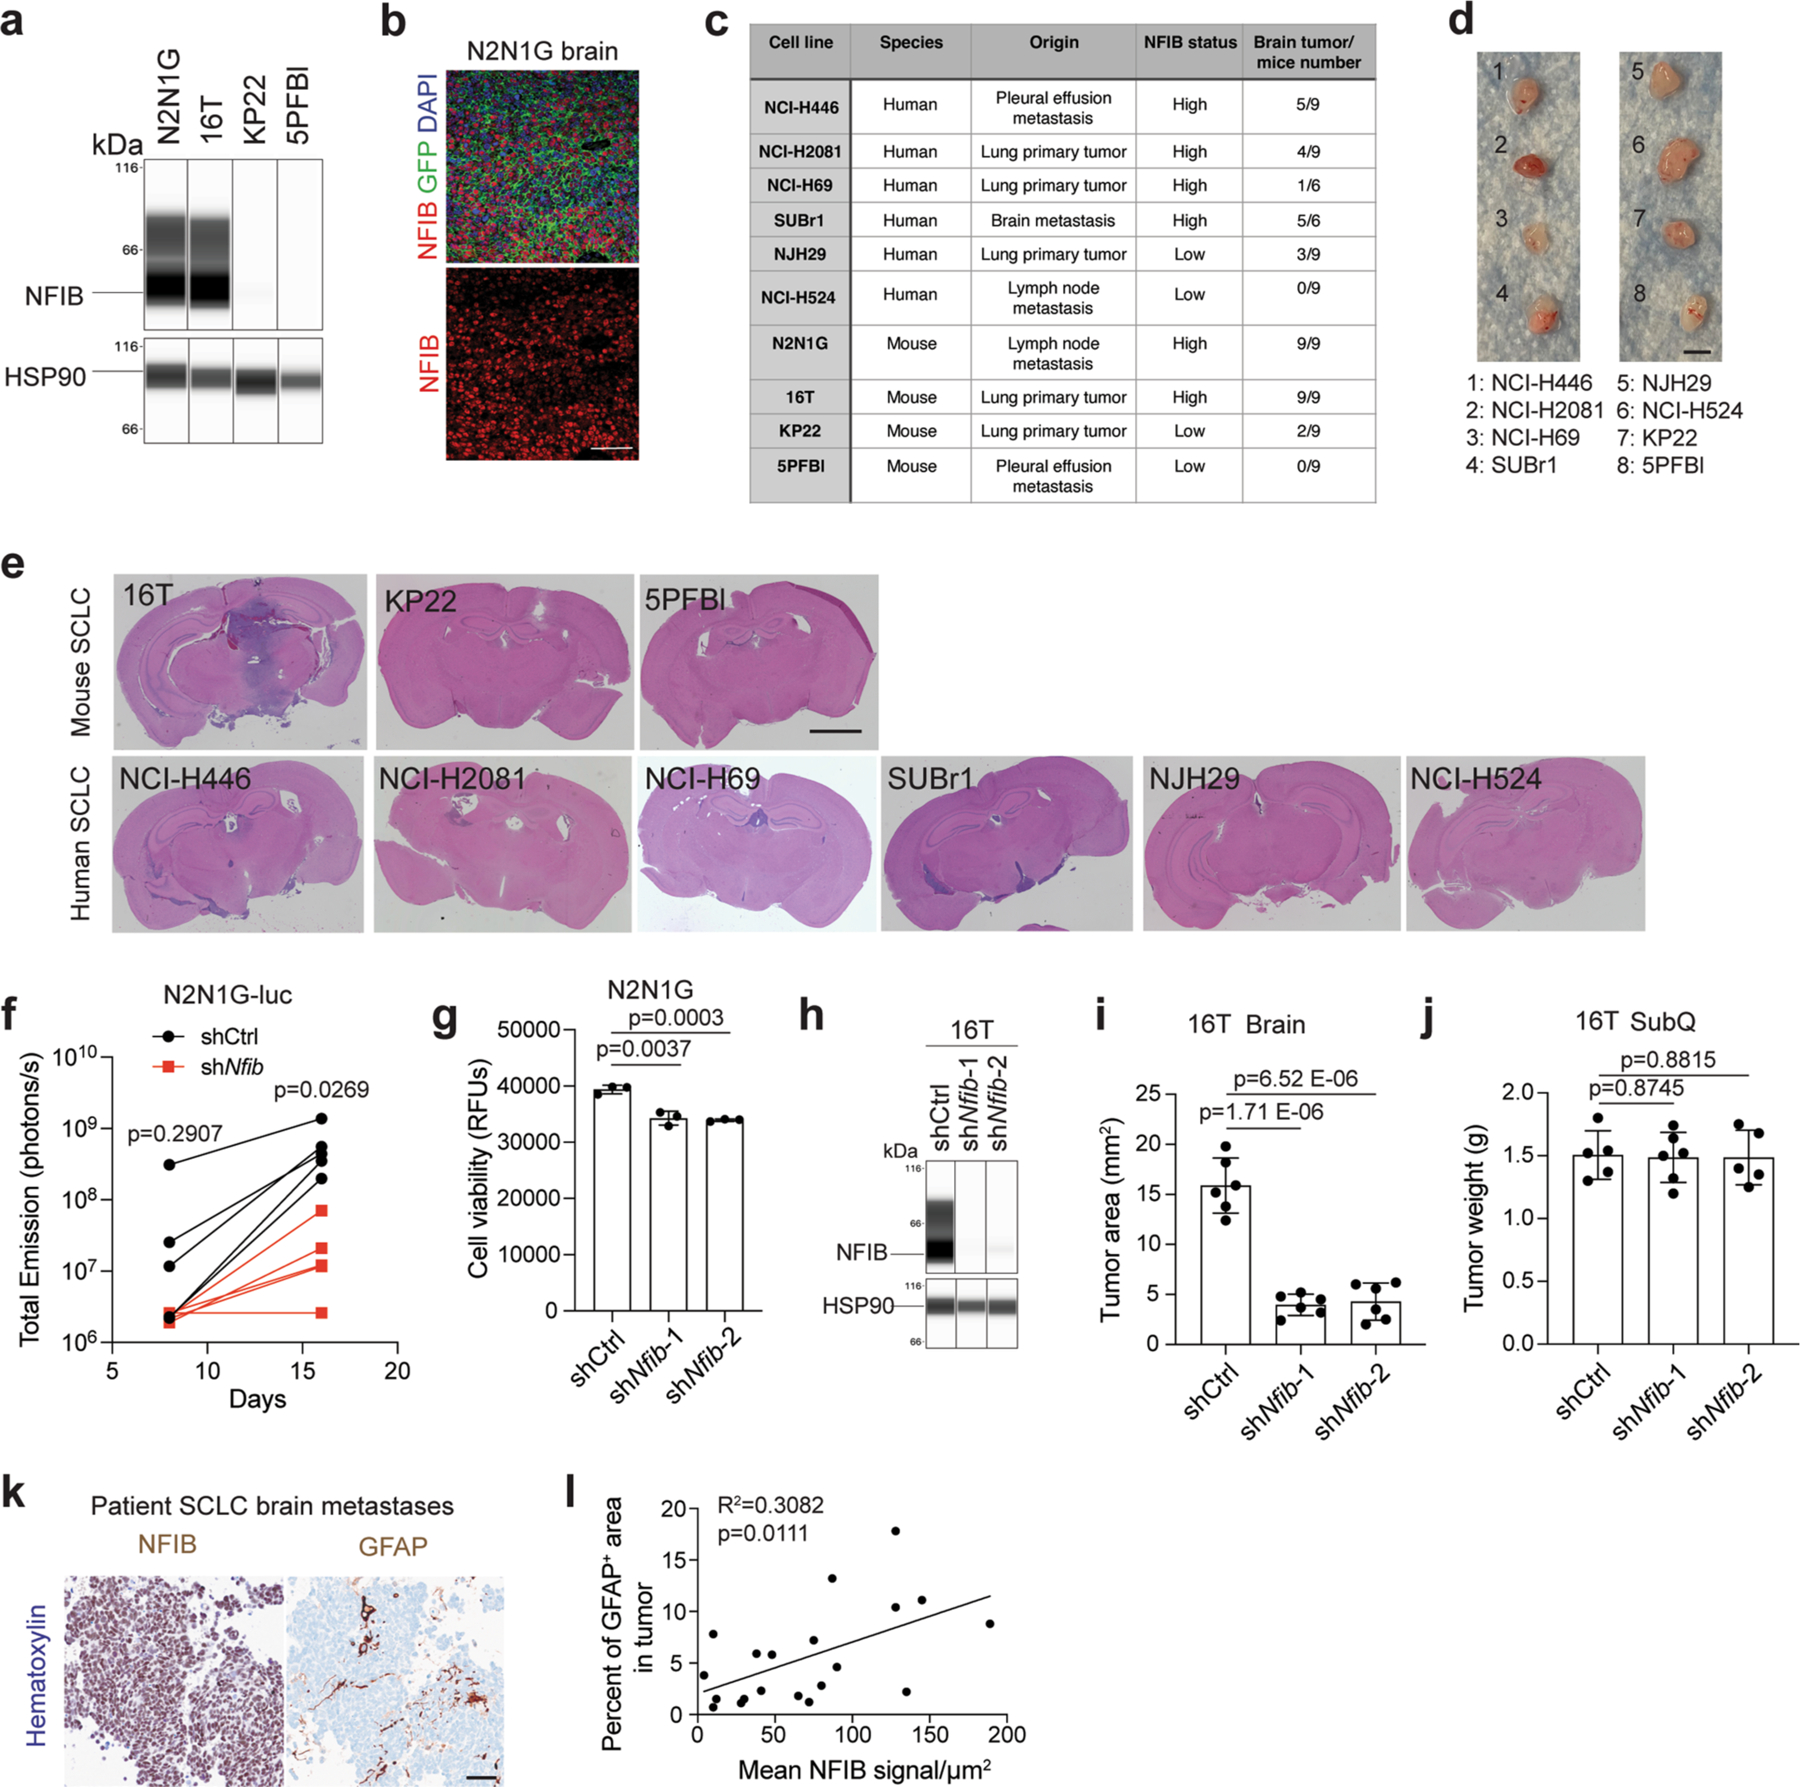
a. Immunoassay (by WES capillary transfer) for NFIB expression in NFIB-high 16 T and N2N1G mouse SCLC cells and in NFIB-low KP22 and 5PFBl cells. HSP90 serves as a loading control. Similar results were observed from 2 independent experiments. b. Representative image of immunofluorescent staining for NFIB (red) and N2N1G NFIB-high SCLC cells (green) on sections from a brain allograft (right). Similar results were observed from 3 biologically independent samples. Scale bar, 20 μm. c. Summary of the ability of various mouse and human SCLC tumors to grow in the brain following intra-cranial injection and subcutaneously. d. Representative images of subcutaneous xenografts and allografts from models in (c) after 14 days in NSG mice. Scale bar, 5 mm. e. Representative images of brains sections from models in (c) after 21 days. f. Quantification of tumor growth of shCtrl (control) and shNfib N2N1G-luc cells measured by bioluminescence imaging (n = 5 tumors from 5 mice each genotype). g. Cell viability measured by AlamarBlue assay of shCtrl and shNfib N2N1G cells at 48 hours in culture. n = 3 independent experiments. h. Immunoassay for NFIB expression in 16 T cells with control and shNfib shRNAs (n = 1 experiment). HSP90: loading control. i-j. Quantification of tumor size of control and shNfib 16 T brain allografts (i) and subcutaneous allografts ( j). n = 5 (control and shNfib-2) and 6 (shNfib-1) mice from 2 experiments. k. Representative immunohistochemistry (IHC) for NFIB and GFAP expression (brown signal) in brain metastases sections from SCLC patients. Scale bar, 50 μm. l. Quantification of (k) (n = 20 regions from 10 patient metastases) for GFAP staining area and NFIB intensity (brown signal). Data show mean with SD. P-values calculated by two-sided t-test when comparing two groups and by one-way ANOVA when comparing three groups.
Extended Data Fig. 7 |. NFIB levels and activity do not significantly change in the brain microenvironment compared to other tumor sites.
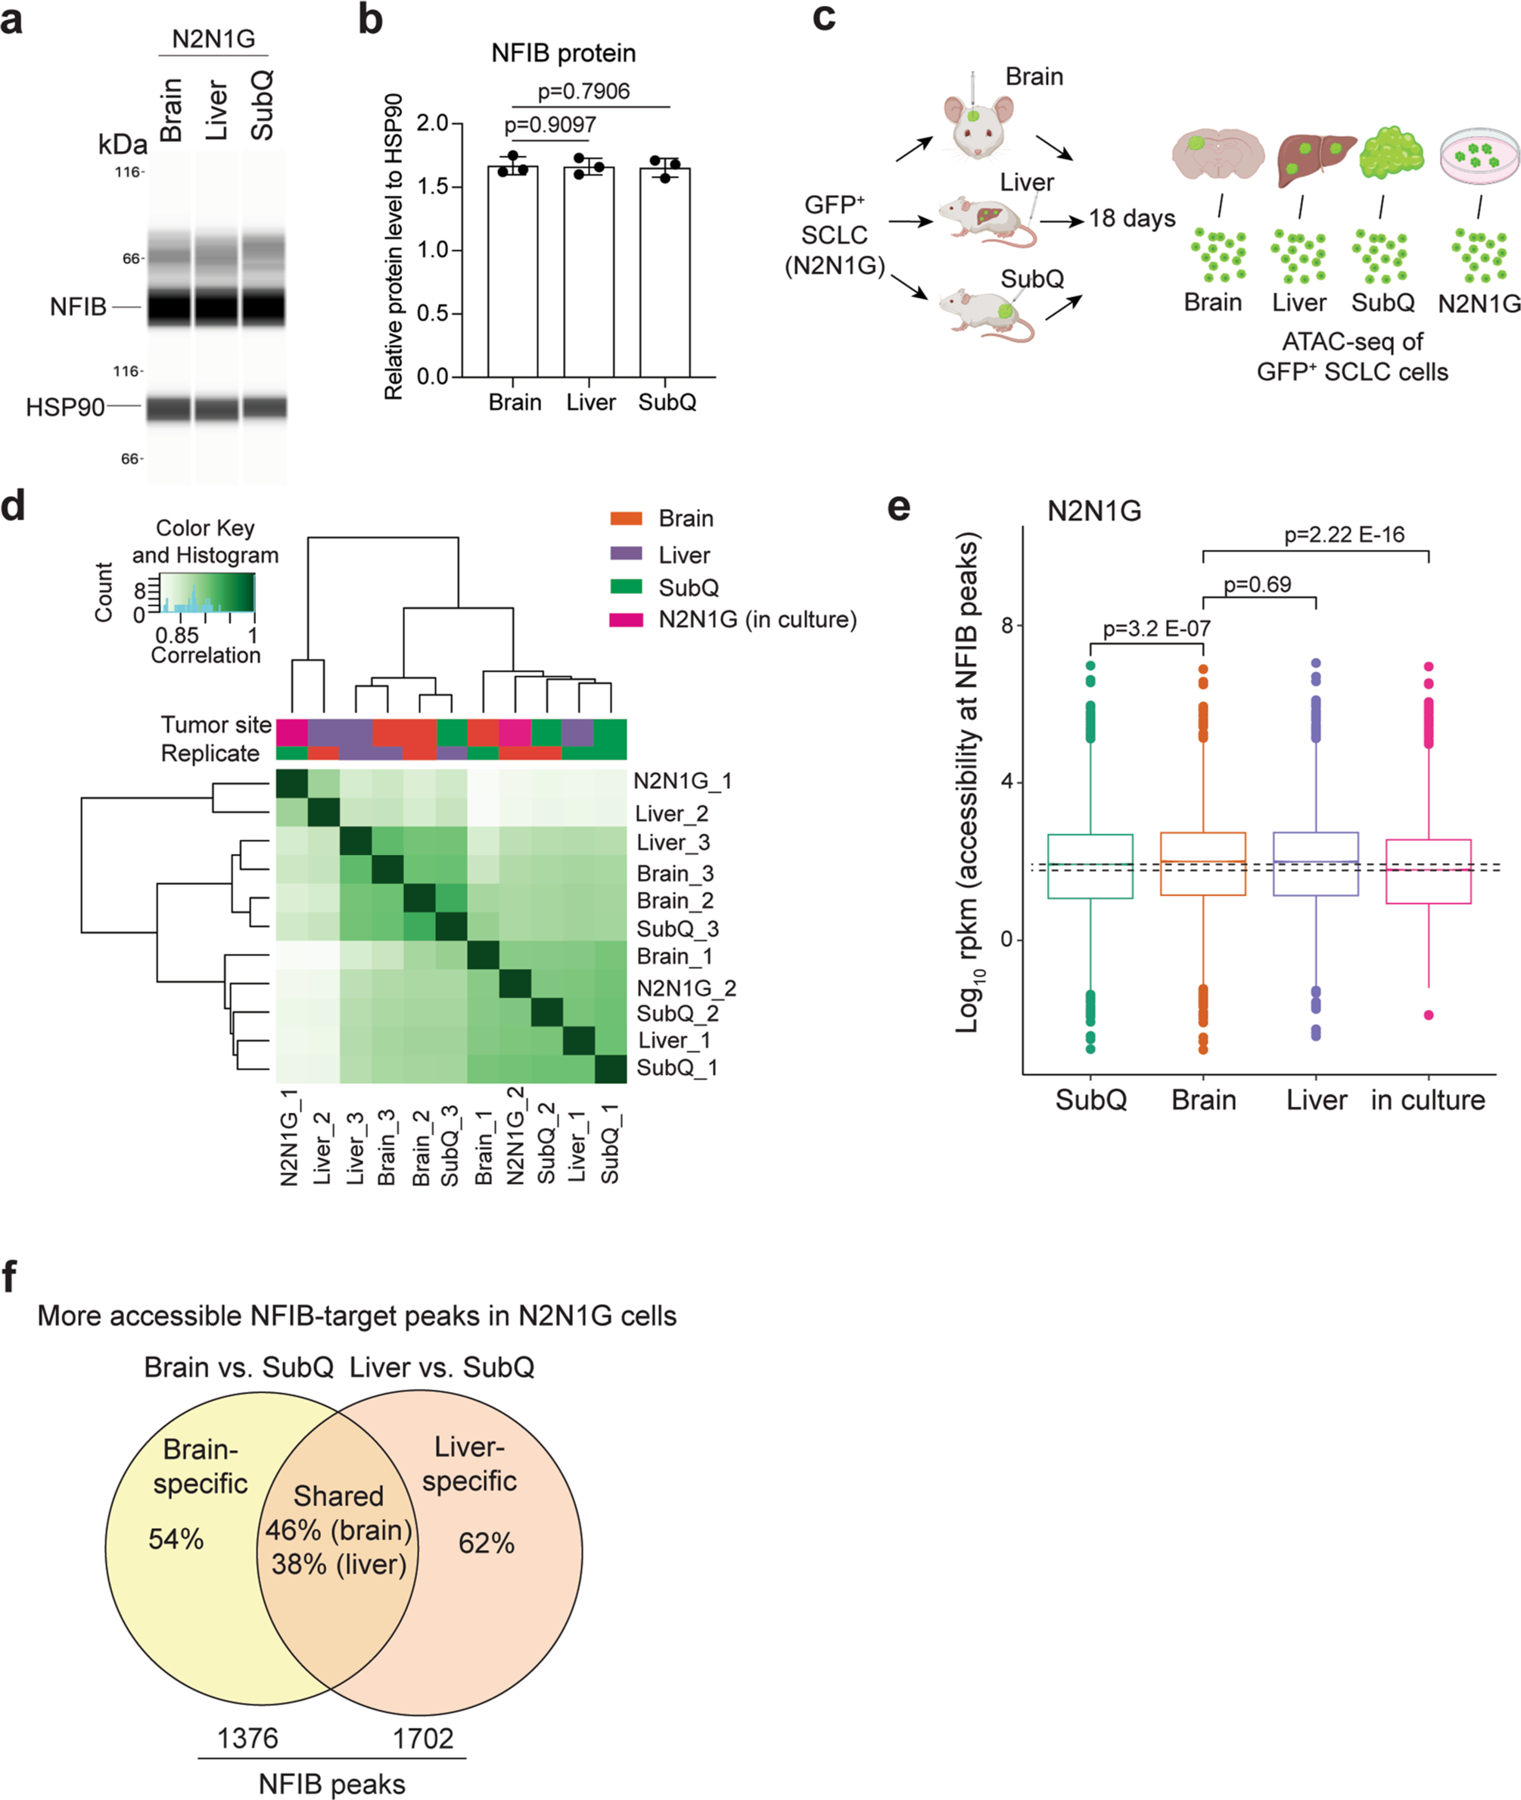
a. Immunoassay (by WES capillary transfer) for NFIB expression in N2N1G cells isolated from brain, liver, and subcutaneous (SubQ) tumors. HSP90 serves as a loading control. b. Quantification of NFIB protein levels from (a) (n = 3 tumors from 3 mice). Data show mean with SD. P values calculated by two-sided t-test. c. Schematic description for the ATAC-seq analysis of N2N1G cells isolated from brain allograft, liver metastases, SubQ tumors, and cells in culture. Created with BioRender.com d. Clustering of ATAC-seq data of 3 brains, 3 livers, 3 SubQ, and 2 N2N1G in culture. e. Box plot showing accessibility at NFIB peaks across the different samples, as indicated (ATAC-seq datasets). For each box, the line represents the median of the spread. Box, 75% of all peaks; whiskers, 25% outlier peaks. n = 3 biologically independent samples. P values calculated by two-sided Wilcox’s test for non-parametric data. f. Number and percentage of site-specific and shared peaks that are more accessible in N2N1G cells from brain and liver tumors compared to subcutaneous tumors (cut-off: 1.5x more accessible).
Extended Data Fig. 8 |. Reelin-Vldlr signaling regulates SCLC-induced astrocyte migration.
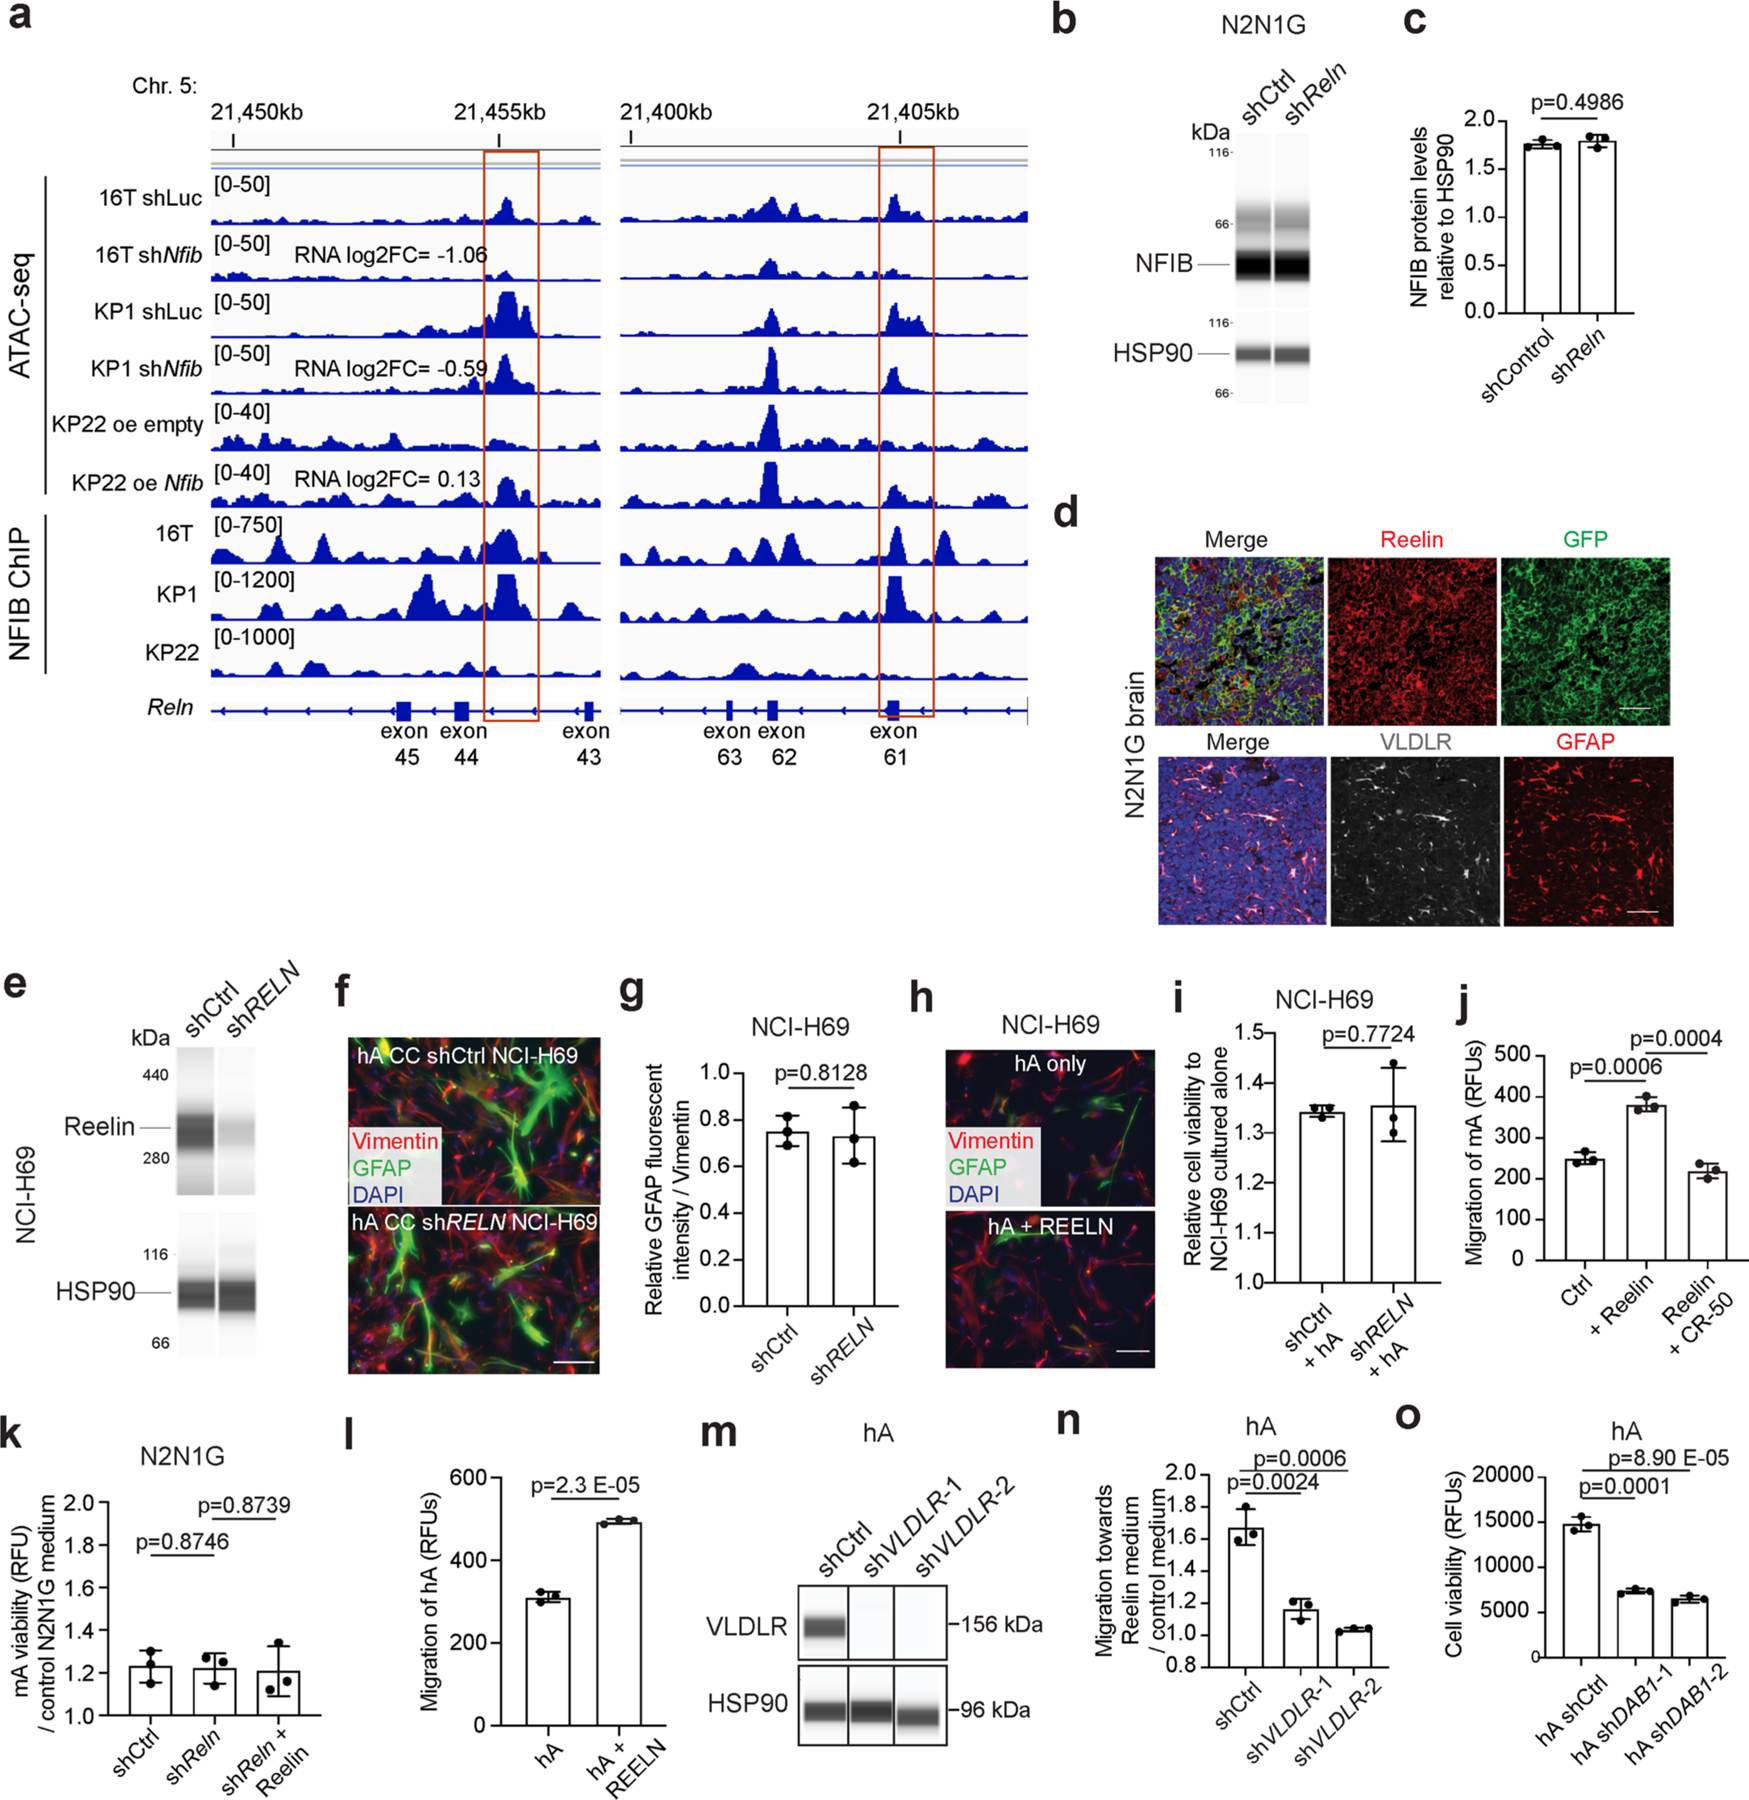
a. Chromatin accessibility at two sites in the Reln locus assessed by ATAC-seq in shCtrl (control) and shNfib 16 T and KP1 cells, and KP22 cells overexpressing empty vector (oe empty) or mouse NFIB (oe Nfib). Chromatin immunoprecipitation (ChIP) for NFIB in 16 T, KP1, and KP22 cells. b. Immunoassay for NFIB in shCtrl and shReln N2N1G cells. HSP90 serves as a loading control. c. Quantification of (b) (n = 3 independent experiments). d. Representative images showing immunofluorescence staining of Reelin (red) and GFP (green, cancer cells), or Vldlr (gray) and GFAP (red) on an N2N1G brain allograft section. Blue: DAPI DNA stain. Scale bar, 50 μm. Similar results were observed from 3 biologically independent samples. e. Immunoassay for Reelin in shCtrl and shRELN NCI-H69 cells. HSP90 serves as a loading control (n = 1). f. Representative images showing immunofluorescent staining of human astrocytes (hA, marked by Vimentin) for the reactivation marker GFAP (green) when co-cultured (CC) with shCtrl or shRELN NCI-H69 cells. Blue: DAPI to stain DNA. Scale bar, 20 μm. g. Quantification of fluorescent intensity for GFAP normalized to Vimentin (n = 3 independent experiments) as in (f). h. Representative images showing rare immunofluorescent staining of GFAP (green) in Vimentin+ (red) hA treated with or without recombinant human Reelin. Blue: DAPI DNA stain. Scale bar, 20 μm. Similar results were observed from 2 independent experiments. i. Cell viability (AlamarBlue assay) measured in shCtrl and shRELN NCI-H69 cells cultured with hA compared to without hA (n = 3 independent experiments). j. Chemotaxis of mouse astrocytes (mA) in control medium or medium with recombinant mouse Reelin protein and the mouse Reelin-blocking antibody CR-50. k. Relative viability of mA in shCtrl and shReln N2N1G-conditioned medium with or without the addition of recombinant mouse Reelin compared to control medium (n = 3 independent experiments). l. Same as (i) for hA and human Reelin. m. Immunoassay for VLDLR in shCtrl and shVLDLR hA. HSP90 serves as a loading control (n = 1 experiment). n. Chemotaxis assay for shCtrl and shVLDLR hA with or without hSCLC-conditioned medium (n = 3 independent experiments). o. Viability of shDAB1 hA cells at 48 hours. Data show mean with SD. n = 3 independent experiments. P values calculated via two-sided t-test when comparing two groups and via one-way ANOVA when comparing 3–4 groups.
Extended Data Fig. 9 |. Reelin expression is critical for the recruitment of GFAP+ astrocytes and the growth of SCLC brain metastases.
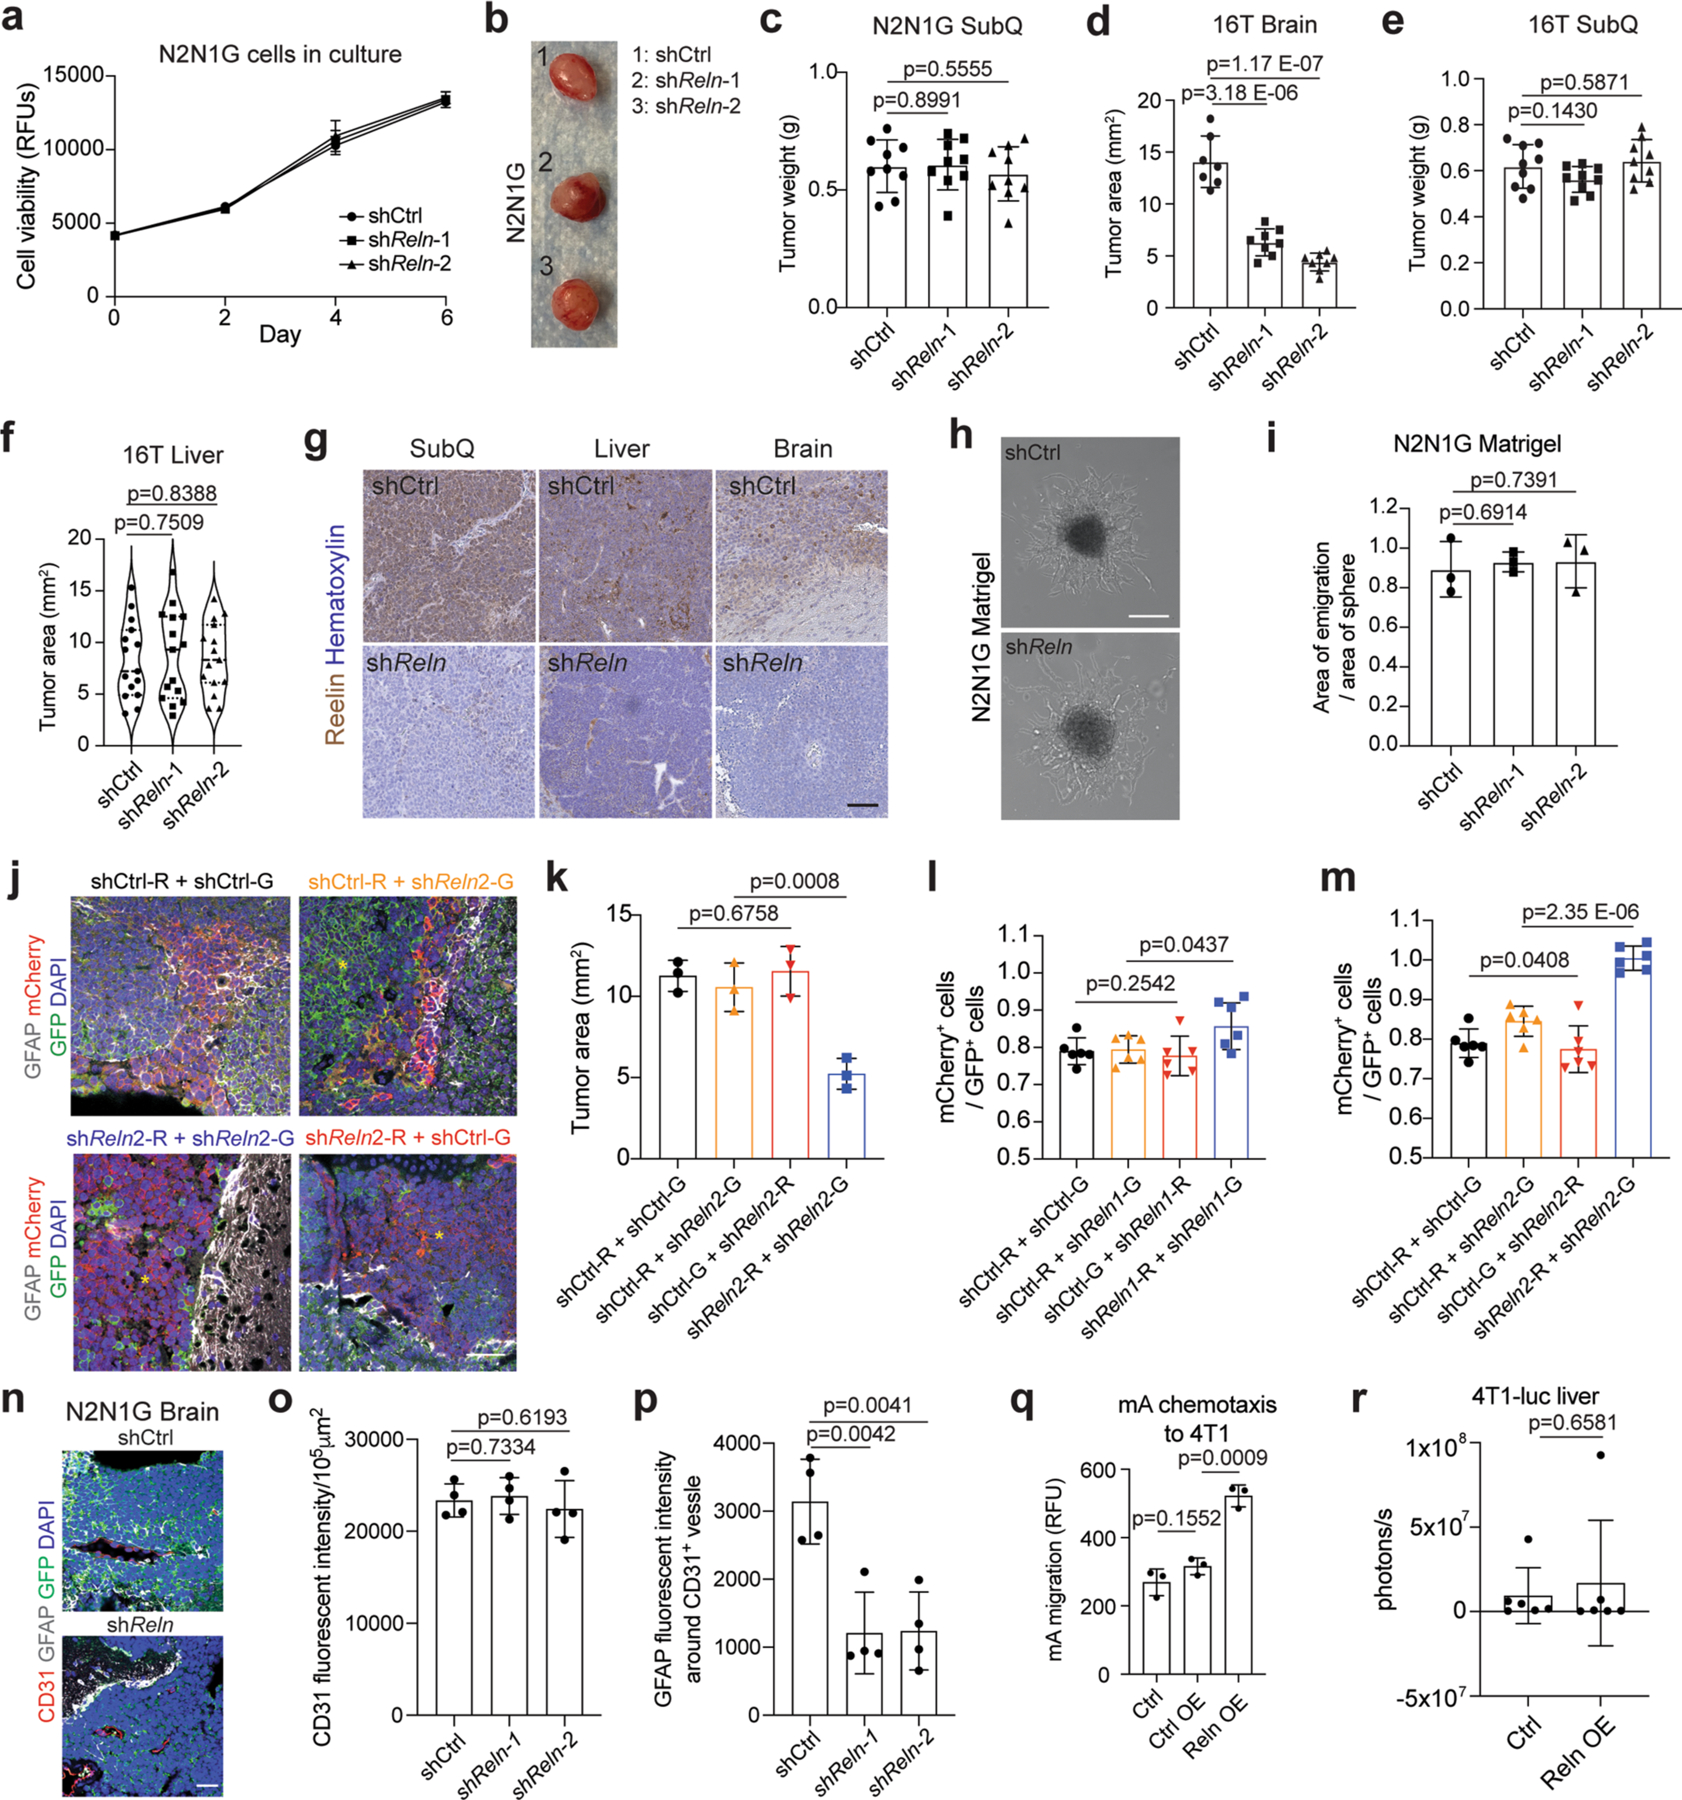
a. Cell viability of shCtrl (control) and shReln N2N1G cells measured by AlamarBlue assay (n = 3). b, c. Representative image and tumor size of shCtrl and shReln N2N1G subcutaneous allografts 21 days post-transplant. Scale bar, 5 mm. N = 9 from 2 experiments. d-f. Tumor size of shCtrl and shReln 16 T brain allografts (d), subcutaneous allografts (e), and liver metastases (f) 21 days post-transplant. N = 7 (shCtrl) and 8 (shReln) from 2 experiments in (d). N = 9 mice from 3 experiments in (e) and (f). g. Representative images of immunohistochemistry staining of Reelin (brown, with blue hematoxylin counterstain) on SCLC brain tumors generated by shCtrl and shReln N2N1G cells. Scale bar, 100 μm. Similar results were observed from 3 independent experiments. h-i. Representative images (h) and quantification (i, n = 3 independent experiments) of shCtrl and shReln SCLC cell migration from 3D cancer spheres in Matrigel. j. Representative images of immunofluorescent staining of GFAP (white) in SCLC brain tumors grown from a 1:1 mix of shCtrl and shReln2 16 T cells expressing mCherry (red) or GFP (green), as indicated. Blue: DAPI DNA stain. Scale bar, 20 μm. Yellow asterisk shows regions where astrocytes are absent. k. Quantification of tumor size in ( j). l-m. Quantification of the ratio between mCherry+ and GFP+ of 16T cells growing in the brain from (Fig. 6h and Extended Data Fig. 9j). N = 6 mice from 2 independent experiments. n. Representative images of immunofluorescent staining of CD31 and GFAP in shCtrl and shReln N2N1G brain allografts. GFP labels N2N1G cells, DAPI stain for nucleus. Scale bar, 20 μm. o-p. Quantification of CD31 level and perivascular GFAP-positive astrocytes in shCtrl and shReln N2N1G brain allografts. N = 4 tumors. q. Chemotaxis of mouse astrocytes in conditioned media from 4T1 cells, 4T1 cells expressing control vector, and 4T1 cells expressing mouse Reelin central domain. n = 3 independent experiments. r. Quantification of liver metastasis size by luciferase imaging of the abdomen of mice 14 days after intracardiac injections of 4T1 cells expressing control vector or mouse Reelin central domain (Leu1221-Ile 2661). N = 6 mice from 2 experiments. Data show mean with SD. P values calculated by two-sided t-test when comparing two groups and one-way ANOVA when comparing three or more groups.
Extended Data Fig. 10 |. Astrocytes activated by SCLC cells secrete factors promoting the survival of SCLC cells.
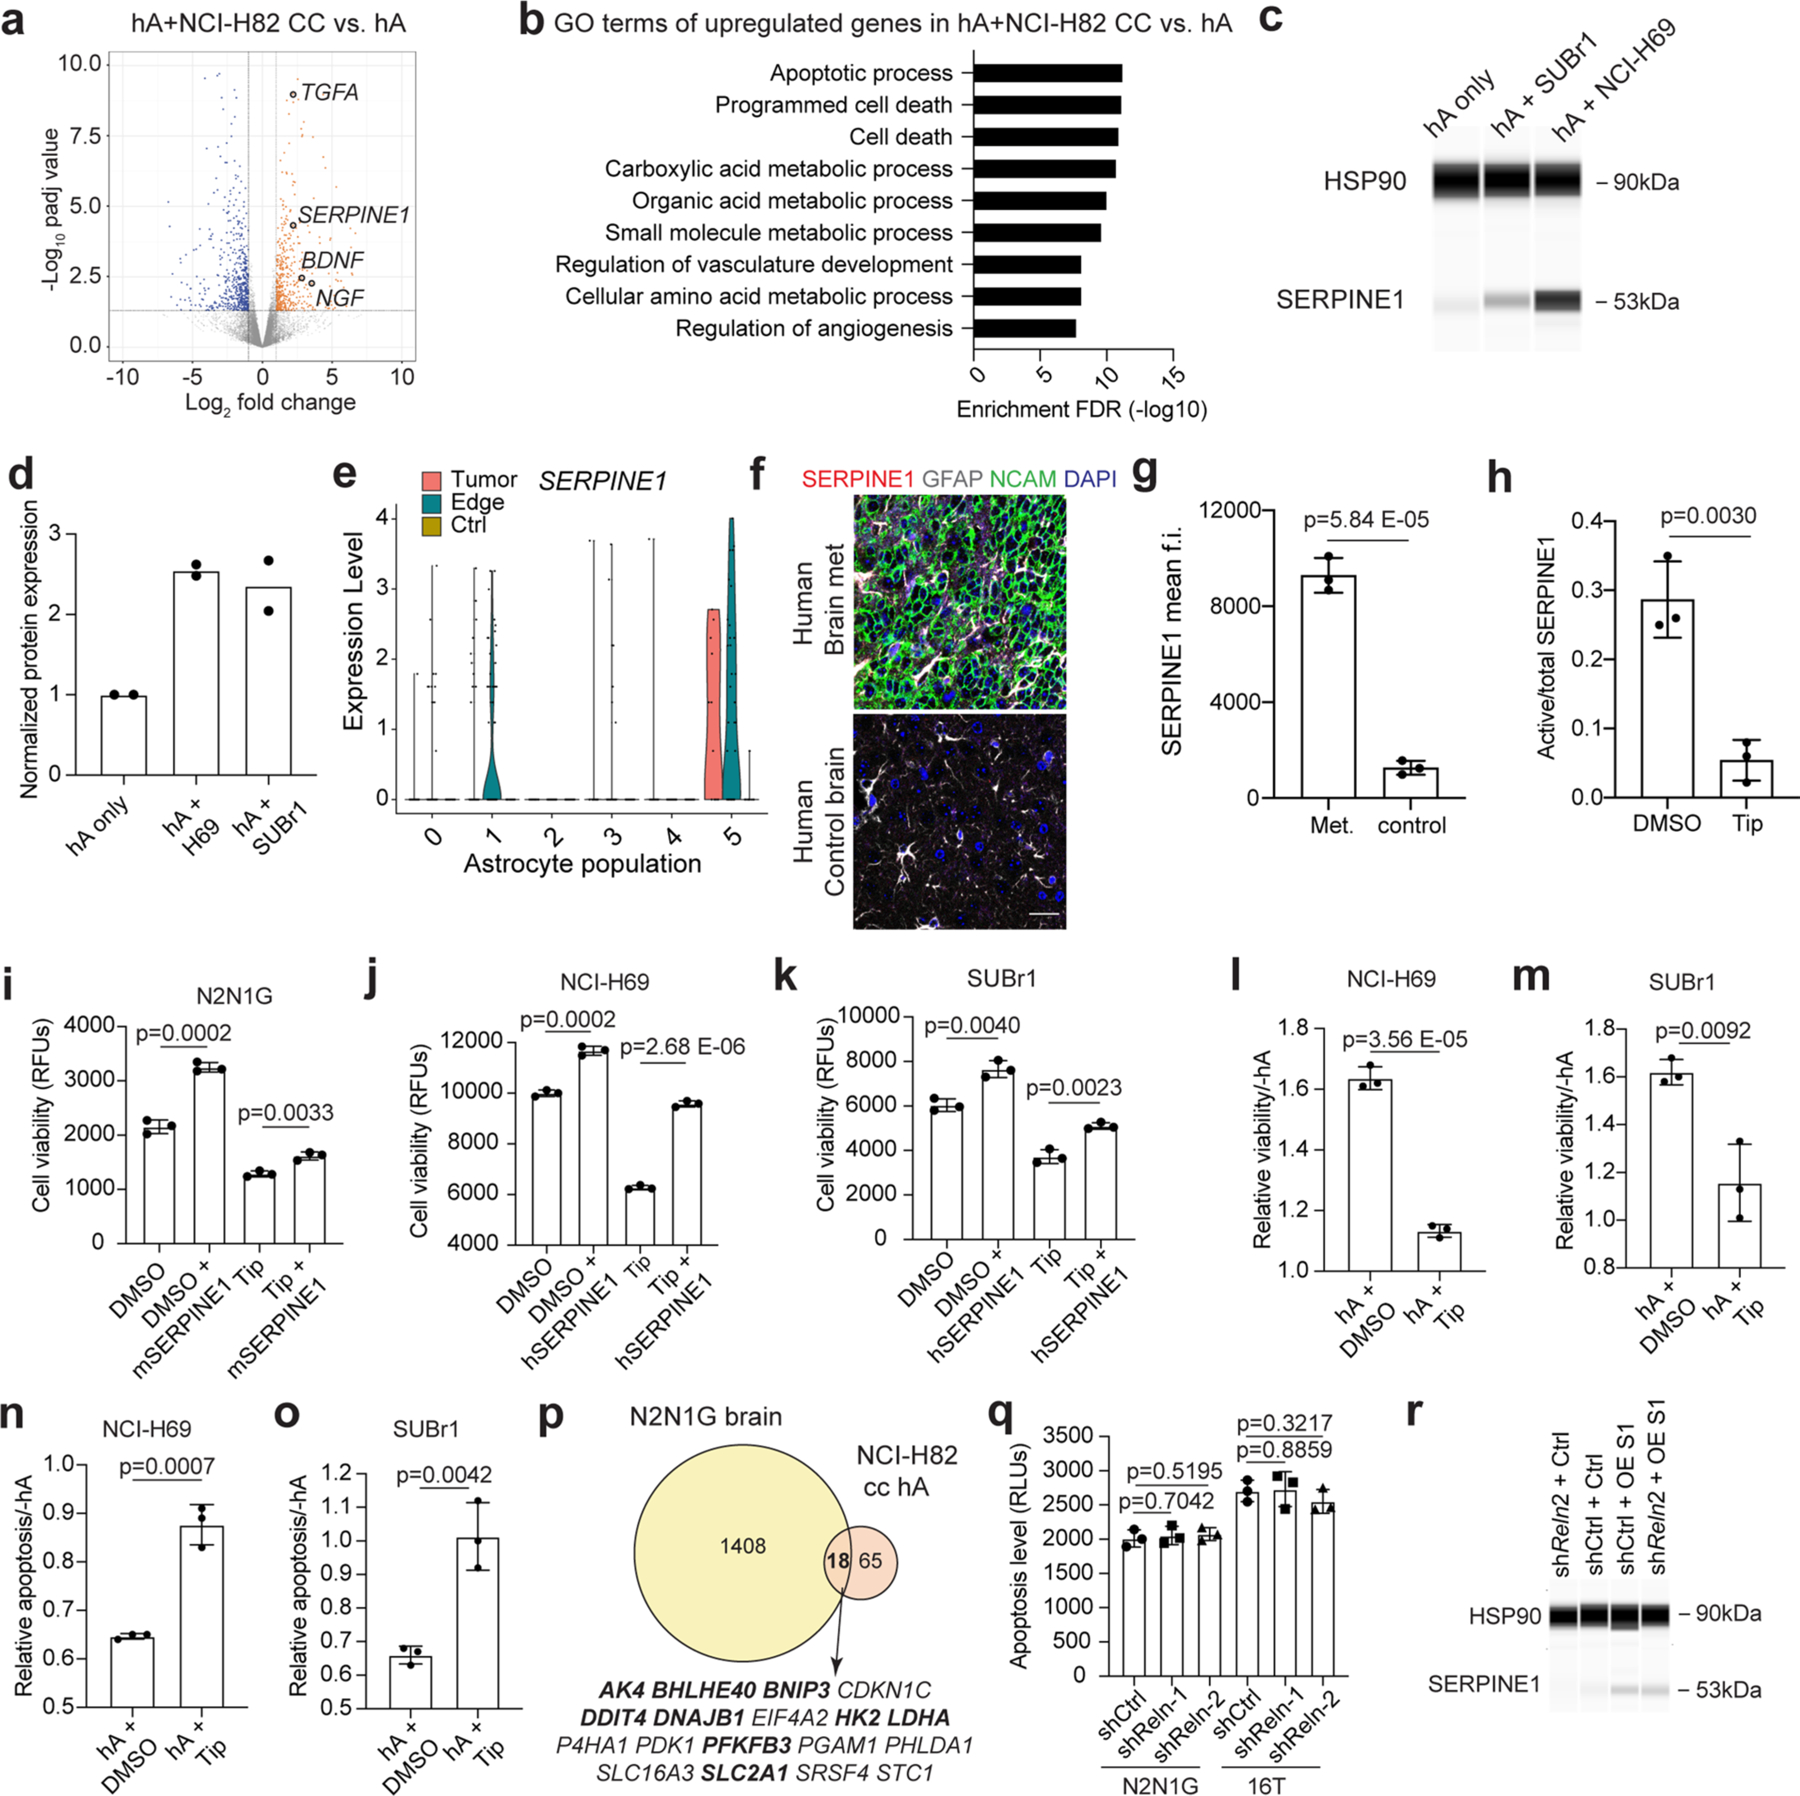
a. Volcano plot showing differentially expressed genes in hA co-cultured with NCI-H82 compared to hA alone. b. Gene ontology (GO) enrichment (top 9) for the genes that are upregulated in hA co-cultured with NCI-H82 compared to hA alone. c. Immunoassay (by WES capillary transfer) for SERPINE1 expression in naive hA and hA co-cultured with the NCI-H69 and SUBr1 human SCLC cell lines. HSP90 serves as a loading control. d. Quantification of (c) (n = 2 independent experiments). e. The expression level of SERPINE1 in astrocyte populations (as in Extended Data Fig. 2f) from N2N1G brain allograft tumor, tumor edge, and sham control brain. n = 3 biologically independent samples. f-g. Representative images and quantification of immunofluorescent staining of SERPINE1 in patient SCLC brain metastases. NCAM stains SCLC cells. GFAP stains astrocytes. DAPI stains nucleus. Scale bar, 20 μm. n = 3 samples. h. Ratio of active SERPINE1 measured by ELISA in culture medium from mouse astrocytes co-cultured with N2N1G cells for 2 days and then treated with DMSO (control) and Tiplaxtinin (5 μM). i. Cell viability (AlamarBlue assay) measured in N2N1G cells treated with recombinant mSERPINE1 and Tip (n = 3 experiments). j, k. Cell viability (AlamarBlue assay) measured in NCI-H69 cells ( j) and SUBr1 cells (k) treated with recombinant hSERPINE1 and the SERPINE1 inhibitor Tiplaxtinin (Tip) (n = 3 experiments). l-m. Relative cell viability (AlamarBlue assay) measured in NCI-H69 cells (l) and SUBr1 cells (m) cultured with hA compared to without hA, with or without Tiplaxtinin treatment (n = 3 experiments). n-o. Relative apoptosis (caspase3/7 activity) measured in NCI-H69 cells (n) and SUBr1 cells (o) cultured with hA compared to without hA, with or without Tip treatment (n = 3 experiments). p. Overlap between upregulated genes in NCI-H82 cultured with hA and N2N1G cells growing in the brain compared to subcutaneously. q. Apoptosis measured by cleaved caspase3/7 in shCtrl (control) and shReln N2N1G and 16T cells in culture. r. Immunoassay for SERPINE1 expression in N2N1G cells in Fig. 7m, n. Data show mean with SD. P values calculated via two-sided t-test when comparing two groups and one-way ANOVA when comparing three groups.
Supplementary Material
Acknowledgements
We thank members of the Sage laboratory for their help throughout this study (including A. He for his help with SUBr1 cells), P. Chu for her help with tissue sections and K. Guttenplan for his help with astrocyte cultures. We thank C. Paiato and M. Kleinberger for their technical assistance with immunostaining of patient brain metastasis samples. This work was supported by the NIH (J.S., CA231997 and CA217450; C.K., CA231997), a Damon Runyon Cancer Research Foundation fellowship (F.Q., DRG-2322–18), Stanford Graduate Fellowships (D.Y. and M.C.L.) and a Tobacco-Related Disease Research Program (TRDRP) Predoctoral Fellowship (M.C.L., T32DT4747). J.S. is the Elaine and John Chambers Professor in Pediatric Cancer. All illustrations were created with BioRender.com.
Footnotes
Reporting summary
Further information on research design is available in the Nature Portfolio Reporting Summary linked to this article.
Code availability
The code for the RNA sequencing analyses is available at Zenodo, https://doi.org/10.5281/zenodo.5068366.
Online content
Any methods, additional references, Nature Portfolio reporting summaries, source data, extended data, supplementary information, acknowledgements, peer review information; details of author contributions and competing interests; and statements of data and code availability are available at https://doi.org/10.1038/s41556-023-01241-6.
Additional information
Extended data is available for this paper at https://doi.org/10.1038/s41556-023-01241-6.
Supplementary information The online version contains supplementary material available at https://doi.org/10.1038/s41556-023-01241-6.
Competing interests
J.S. licensed a patent to Forty Seven/Gilead on the use of CD47-blocking strategies in SCLC and has equity in, and is an advisor for, DISCO Pharmaceuticals. M.M.W. has equity in, and is an advisor for, D2G Oncology. M.D. has received recent research support from Novartis, Abbvie, United Therapeutics, Verily and Varian, and has consulted with Beigene, Astra Zeneca and Jazz Pharmaceuticals. M.P. has received honoraria for lectures, consultation or advisory board participation from the following for-profit companies: Bayer, Bristol-Myers Squibb, Novartis, Gerson Lehrman Group (GLG), CMC Contrast, GlaxoSmithKline, Mundipharma, Roche, BMJ Journals, MedMedia, Astra Zeneca, AbbVie, Lilly, Medahead, Daiichi Sankyo, Sanofi, Merck Sharp & Dome, Tocagen, Adastra, Gan & Lee Pharmaceuticals and Servier. The other authors declare no competing interests.
Data availability
ATAC–seq and RNA-seq data have been deposited in the Gene Expression Omnibus (GSE179032 and GSE178743). All other data supporting the findings of this study are available from the corresponding author on reasonable request. The ENSEMBL mm10 genome (GRCm38) can be accessed at https://www.ncbi.nlm.nih.gov/datasets/genome/GCF_000001635.20/ Source data are provided with this paper.
References
- 1.Chaffer CL & Weinberg RA A perspective on cancer cell metastasis. Science 331, 1559–1564 (2011). [DOI] [PubMed] [Google Scholar]
- 2.Valiente M et al. The evolving landscape of brain metastasis. Trends Cancer 4, 176–196 (2018). [DOI] [PMC free article] [PubMed] [Google Scholar]
- 3.Suh JH et al. Current approaches to the management of brain metastases. Nat. Rev. Clin. Oncol 17, 279–299 (2020). [DOI] [PubMed] [Google Scholar]
- 4.Bos PD et al. Genes that mediate breast-cancer metastasis to the brain. Nature 459, 1005–1009 (2009). [DOI] [PMC free article] [PubMed] [Google Scholar]
- 5.Lorger M & Felding-Habermann B Capturing changes in the brain microenvironment during initial steps of breast-cancer brain metastasis. Am. J. Pathol 176, 2958–2971 (2010). [DOI] [PMC free article] [PubMed] [Google Scholar]
- 6.Zeng Q et al. Synaptic proximity enables NMDAR signalling to promote brain metastasis. Nature 573, 526–531 (2019). [DOI] [PMC free article] [PubMed] [Google Scholar]
- 7.Ebright RY et al. HIF1A signaling selectively supports proliferation of breast cancer in the brain. Nat. Commun 11, 6311 (2020). [DOI] [PMC free article] [PubMed] [Google Scholar]
- 8.Adler O et al. Reciprocal interactions between innate immune cells and astrocytes facilitate neuroinflammation and brain metastasis via lipocalin-2. Nat. Cancer 4, 401–418 (2023). [DOI] [PubMed] [Google Scholar]
- 9.Biermann J et al. Dissecting the treatment-naïve ecosystem of human melanoma brain metastasis. Cell 185, 2591–2608.e30 (2022). [DOI] [PMC free article] [PubMed] [Google Scholar]
- 10.Achrol AS et al. Brain metastases. Nat. Rev. Dis. Prim 5, 5 (2019). [DOI] [PubMed] [Google Scholar]
- 11.Hebert JD, Neal JW & Winslow MM Dissecting metastasis using preclinical models and methods. Nat. Rev. Cancer 23, 391–407 (2023). [DOI] [PubMed] [Google Scholar]
- 12.Rudin CM, Brambilla E, Faivre-Finn C & Sage J Small-cell lung cancer. Nat. Rev. Dis. Prim 7, 3 (2021). [DOI] [PMC free article] [PubMed] [Google Scholar]
- 13.Boire A, Brastianos PK, Garzia L & Valiente M Brain metastasis. Nat. Rev. Cancer 20, 4–11 (2020). [DOI] [PubMed] [Google Scholar]
- 14.Ko J, Winslow MM & Sage J Mechanisms of small-cell lung cancer metastasis. EMBO Mol. Med 13, e13122 (2021). [DOI] [PMC free article] [PubMed] [Google Scholar]
- 15.Megyesfalvi Z et al. The landscape of small-cell lung cancer metastases: organ specificity and timing. Thorac. Cancer 12, 914–923 (2021). [DOI] [PMC free article] [PubMed] [Google Scholar]
- 16.Rusthoven CG, Camidge DR, Robin TP & Brown PD Radiosurgery for small-cell brain metastases: challenging the last bastion of preferential whole-brain radiotherapy delivery. J. Clin. Oncol 38, 3587–3591 (2020). [DOI] [PubMed] [Google Scholar]
- 17.Neal JW, Gubens MA & Wakelee HA Current management of small-cell lung cancer. Clin. Chest Med 32, 853–863 (2011). [DOI] [PubMed] [Google Scholar]
- 18.Takahashi T et al. Prophylactic cranial irradiation versus observation in patients with extensive-disease small-cell lung cancer: a multicentre, randomised, open-label, phase 3 trial. Lancet Oncol 18, 663–671 (2017). [DOI] [PubMed] [Google Scholar]
- 19.Lukas RV, Gondi V, Kamson DO, Kumthekar P & Salgia R State-of-the-art considerations in small-cell lung cancer brain metastases. Oncotarget 8, 71223–71233 (2017). [DOI] [PMC free article] [PubMed] [Google Scholar]
- 20.Drapkin BJ & Rudin CM Advances in small-cell lung cancer (SCLC) translational research. Cold Spring Harb. Perspect. Med 11, a038240 (2020). [DOI] [PMC free article] [PubMed] [Google Scholar]
- 21.Ilhan-Mutlu A et al. Expression profiling of angiogenesis-related genes in brain metastases of lung cancer and melanoma. Tumour Biol 37, 1173–1182 (2016). [DOI] [PubMed] [Google Scholar]
- 22.Thompson EM, Pishko GL, Muldoon LL & Neuwelt EA Inhibition of SUR1 decreases the vascular permeability of cerebral metastases. Neoplasia 15, 535–543 (2013). [DOI] [PMC free article] [PubMed] [Google Scholar]
- 23.Li B et al. Elevated PLGF contributes to small-cell lung cancer brain metastasis. Oncogene 32, 2952–2962 (2013). [DOI] [PubMed] [Google Scholar]
- 24.Xu Z-H et al. Brain microvascular endothelial cell exosome-mediated S100A16 up-regulation confers small-cell lung cancer cell survival in brain. FASEB J 33, 1742–1757 (2019). [DOI] [PubMed] [Google Scholar]
- 25.Wang A & Komiya T Brain metastasis as exclusion criteria in clinical trials involving extensive-stage small-cell lung cancer. J. Cancer Res. Clin. Oncol 145, 3099–3104 (2019). [DOI] [PubMed] [Google Scholar]
- 26.Stewart CA et al. Single-cell analyses reveal increased intratumoral heterogeneity after the onset of therapy resistance in small-cell lung cancer. Nat. Cancer 1, 423–436 (2020). [DOI] [PMC free article] [PubMed] [Google Scholar]
- 27.Meuwissen R et al. Induction of small-cell lung cancer by somatic inactivation of both Trp53 and Rb1 in a conditional mouse model. Cancer Cell. 4, 181–189 (2003). [DOI] [PubMed] [Google Scholar]
- 28.Guo W-L et al. Clinical features of brain metastases in small-cell lung cancer: an implication for hippocampal sparing whole brain radiation therapy. Transl. Oncol 10, 54–58 (2017). [DOI] [PMC free article] [PubMed] [Google Scholar]
- 29.Seute T, Leffers P, ten Velde GPM & Twijnstra A Leptomeningeal metastases from small-cell lung carcinoma. Cancer 104, 1700–1705 (2005). [DOI] [PubMed] [Google Scholar]
- 30.Uña E Intraventricular metastases from small-cell carcinoma of the lung. BMJ Case Rep 2012, bcr1220115440 (2012). [DOI] [PMC free article] [PubMed] [Google Scholar]
- 31.Denny SK et al. Nfib promotes metastasis through a widespread increase in chromatin accessibility. Cell 166, 328–342 (2016). [DOI] [PMC free article] [PubMed] [Google Scholar]
- 32.Yang D et al. Axon-like protrusions promote small-cell lung cancer migration and metastasis. eLife 8, e50616 (2019). [DOI] [PMC free article] [PubMed] [Google Scholar]
- 33.Wasilewski D, Priego N, Fustero-Torre C & Valiente M Reactive astrocytes in brain metastasis. Front Oncol 7, 298 (2017). [DOI] [PMC free article] [PubMed] [Google Scholar]
- 34.Escartin C et al. Reactive astrocyte nomenclature, definitions, and future directions. Nat. Neurosci 24, 312–325 (2021). [DOI] [PMC free article] [PubMed] [Google Scholar]
- 35.Henrik Heiland D et al. Tumor-associated reactive astrocytes aid the evolution of immunosuppressive environment in glioblastoma. Nat. Commun 10, 2541 (2019). [DOI] [PMC free article] [PubMed] [Google Scholar]
- 36.Zhang Y et al. Purification and characterization of progenitor and mature human astrocytes reveals transcriptional and functional differences with mouse. Neuron 89, 37–53 (2016). [DOI] [PMC free article] [PubMed] [Google Scholar]
- 37.Sirkisoon SR et al. TGLI1 transcription factor mediates breast-cancer brain metastasis via activating metastasis-initiating cancer stem cells and astrocytes in the tumor microenvironment. Oncogene 39, 64–78 (2020). [DOI] [PMC free article] [PubMed] [Google Scholar]
- 38.Priego N et al. STAT3 labels a subpopulation of reactive astrocytes required for brain metastasis. Nat. Med 24, 1024–1035 (2018). [DOI] [PubMed] [Google Scholar]
- 39.Williamson SC et al. Vasculogenic mimicry in small-cell lung cancer. Nat. Commun 7, 13322 (2016). [DOI] [PMC free article] [PubMed] [Google Scholar]
- 40.Simpson KL et al. A biobank of small-cell lung cancer CDX models elucidates inter- and intratumoral phenotypic heterogeneity. Nat. Cancer 1, 437–451 (2020). [DOI] [PubMed] [Google Scholar]
- 41.Jahchan NS et al. Identification and targeting of long-term tumor-propagating cells in small-cell lung cancer. Cell Rep 16, 644–656 (2016). [DOI] [PMC free article] [PubMed] [Google Scholar]
- 42.Guo D et al. Tumor cells generate astrocyte-like cells that contribute to SHH-driven medulloblastoma relapse. J. Exp. Med 218, e20202350 (2021). [DOI] [PMC free article] [PubMed] [Google Scholar]
- 43.Yao M et al. Astrocytic trans-differentiation completes a multicellular paracrine feedback loop required for medulloblastoma tumor growth. Cell 180, 502–520.e19 (2020). [DOI] [PMC free article] [PubMed] [Google Scholar]
- 44.Voskuhl RR et al. Reactive astrocytes form scar-like perivascular barriers to leukocytes during adaptive immune inflammation of the CNS. J. Neurosci 29, 11511–11522 (2009). [DOI] [PMC free article] [PubMed] [Google Scholar]
- 45.Taylor X et al. Activated endothelial cells induce a distinct type of astrocytic reactivity. Commun. Biol 5, 282 (2022). [DOI] [PMC free article] [PubMed] [Google Scholar]
- 46.Liddelow SA & Barres BA Reactive astrocytes: production, function, and therapeutic potential. Immunity 46, 957–967 (2017). [DOI] [PubMed] [Google Scholar]
- 47.Weimer JM et al. MARCKS modulates radial progenitor placement, proliferation and organization in the developing cerebral cortex. Development 136, 2965–2975 (2009). [DOI] [PMC free article] [PubMed] [Google Scholar]
- 48.Luo J Dysregulation of polarity proteins in astrocyte reactivity. Ageing Res. Rev 86, 101869 (2023). [DOI] [PMC free article] [PubMed] [Google Scholar]
- 49.Paçca AM et al. Functional cortical neurons and astrocytes from human pluripotent stem cells in 3D culture. Nat. Methods 12, 671–678 (2015). [DOI] [PMC free article] [PubMed] [Google Scholar]
- 50.Yoon S-J et al. Reliability of human cortical organoid generation. Nat. Methods 16, 75–78 (2019). [DOI] [PMC free article] [PubMed] [Google Scholar]
- 51.Sloan SA et al. Human astrocyte maturation captured in 3D cerebral cortical spheroids derived from pluripotent stem cells. Neuron 95, 779–790.e6 (2017). [DOI] [PMC free article] [PubMed] [Google Scholar]
- 52.Tsai H-H et al. Regional astrocyte allocation regulates CNS synaptogenesis and repair. Science 337, 358–362 (2012). [DOI] [PMC free article] [PubMed] [Google Scholar]
- 53.Allen NJ & Lyons DA Glia as architects of central nervous system formation and function. Science 362, 181–185 (2018). [DOI] [PMC free article] [PubMed] [Google Scholar]
- 54.Jacobsen CT & Miller RH Control of astrocyte migration in the developing cerebral cortex. Dev. Neurosci 25, 207–216 (2003). [DOI] [PubMed] [Google Scholar]
- 55.Yang D et al. Intertumoral heterogeneity in SCLC is influenced by the cell type of origin. Cancer Discov 8, 1316–1331 (2018). [DOI] [PMC free article] [PubMed] [Google Scholar]
- 56.Carney DN et al. Serum neuron-specific enolase: a marker for disease extent and response to therapy of small-cell lung cancer. Lancet 1, 583–585 (1982). [DOI] [PubMed] [Google Scholar]
- 57.van Zandwijk N, Jassem E, Bonfrer JM, Mooi WJ & van Tinteren H Serum neuron-specific enolase and lactate dehydrogenase as predictors of response to chemotherapy and survival in non-small-cell lung cancer. Semin. Oncol 19, 37–43 (1992). [PubMed] [Google Scholar]
- 58.Semenova EA et al. Transcription factor NFIB is a driver of small-cell lung cancer progression in mice and marks metastatic disease in patients. Cell Rep 16, 631–643 (2016). [DOI] [PMC free article] [PubMed] [Google Scholar]
- 59.Wu N et al. NFIB overexpression cooperates with Rb/p53 deletion to promote small-cell lung cancer. Oncotarget 7, 57514–57524 (2016). [DOI] [PMC free article] [PubMed] [Google Scholar]
- 60.Dooley AL et al. Nuclear factor I/B is an oncogene in small-cell lung cancer. Genes Dev 25, 1470–1475 (2011). [DOI] [PMC free article] [PubMed] [Google Scholar]
- 61.Zhan JS et al. Astrocytes in migration. Neurochem. Res 42, 272–282 (2017). [DOI] [PubMed] [Google Scholar]
- 62.Brunkhorst R, Bock H & Derouiche A Reelin induces process growth in cultured astrocytes: implication for glia-synaptic plasticity. Arch. Ital. Biol 153, 249–254 (2015). [DOI] [PubMed] [Google Scholar]
- 63.Courtès S et al. Reelin controls progenitor cell migration in the healthy and pathological adult mouse brain. PLoS ONE 6, e20430 (2011). [DOI] [PMC free article] [PubMed] [Google Scholar]
- 64.Niu S, Renfro A, Quattrocchi CC, Sheldon M & D’Arcangelo G Reelin promotes hippocampal dendrite development through the VLDLR/ApoER2-Dab1 pathway. Neuron 41, 71–84 (2004). [DOI] [PubMed] [Google Scholar]
- 65.Khialeeva E et al. Reelin deficiency delays mammary tumor growth and metastatic progression. J. Mammary Gland Biol. Neoplasia 22, 59–69 (2017). [DOI] [PMC free article] [PubMed] [Google Scholar]
- 66.Wang Y, Ye F, Liang Y & Yang Q Breast-cancer brain metastasis: insight into molecular mechanisms and therapeutic strategies. Br. J. Cancer 125, 1056–1067 (2021). [DOI] [PMC free article] [PubMed] [Google Scholar]
- 67.Yasui N et al. Structure of a receptor-binding fragment of reelin and mutational analysis reveal a recognition mechanism similar to endocytic receptors. Proc. Natl Acad. Sci. USA 104, 9988–9993 (2007). [DOI] [PMC free article] [PubMed] [Google Scholar]
- 68.Davies AM Regulation of neuronal survival and death by extracellular signals during development. EMBO J 22, 2537–2545 (2003). [DOI] [PMC free article] [PubMed] [Google Scholar]
- 69.Gabriel C et al. Transforming growth factor α-induced expression of type-1 plasminogen activator inhibitor in astrocytes rescues neurons from excitotoxicity. FASEB J 17, 277–279 (2003). [DOI] [PubMed] [Google Scholar]
- 70.Pavón M et al. uPA/uPAR and SERPINE1 in head and neck cancer: role in tumor resistance, metastasis, prognosis and therapy. Oncotarget 7, 57351–57366 (2016). [DOI] [PMC free article] [PubMed] [Google Scholar]
- 71.Che Y et al. Cisplatin-activated PAI-1 secretion in the cancer-associated fibroblasts with paracrine effects promoting esophageal squamous cell carcinoma progression and causing chemoresistance. Cell Death Dis 9, 759 (2018). [DOI] [PMC free article] [PubMed] [Google Scholar]
- 72.Schneider DJ, Chen Y & Sobel BE The effect of plasminogen activator inhibitor type 1 on apoptosis. Thromb. Haemost 100, 1037–1040 (2008). [PubMed] [Google Scholar]
- 73.Valiente M et al. Serpins promote cancer cell survival and vascular Co-option in brain metastasis. Cell 156, 1002–1016 (2014). [DOI] [PMC free article] [PubMed] [Google Scholar]
- 74.Elokdah H et al. Tiplaxtinin, a novel, orally efficacious inhibitor of plasminogen activator inhibitor-1: design, synthesis, and preclinical characterization. J. Med. Chem 47, 3491–3494 (2004). [DOI] [PubMed] [Google Scholar]
- 75.Bydoun M, Sterea A, Weaver ICG, Bharadwaj AG & Waisman DM A novel mechanism of plasminogen activation in epithelial and mesenchymal cells. Sci. Rep 8, 14091 (2018). [DOI] [PMC free article] [PubMed] [Google Scholar]
- 76.Caino MC et al. A neuronal network of mitochondrial dynamics regulates metastasis. Nat. Commun 7, 13730 (2016). [DOI] [PMC free article] [PubMed] [Google Scholar]
- 77.Neman J et al. Human breast-cancer metastases to the brain display GABAergic properties in the neural niche. Proc. Natl Acad. Sci. USA 111, 984–989 (2014). [DOI] [PMC free article] [PubMed] [Google Scholar]
- 78.Tan R et al. Neural functions play different roles in triple negative breast cancer (TNBC) and non-TNBC. Sci. Rep 10, 3065 (2020). [DOI] [PMC free article] [PubMed] [Google Scholar]
- 79.Wingrove E et al. Transcriptomic hallmarks of tumor plasticity and stromal interactions in brain metastasis. Cell Rep 27, 1277–1292.e7 (2019). [DOI] [PMC free article] [PubMed] [Google Scholar]
- 80.Quail D & Joyce J Microenvironmental regulation of tumor progression and metastasis. Nat. Med 19, 1423–1437 (2013). [DOI] [PMC free article] [PubMed] [Google Scholar]
- 81.Sevenich L et al. Analysis of tumour- and stroma-supplied proteolytic networks reveals a brain-metastasis-promoting role for cathepsin S. Nat. Cell Biol 16, 876–888 (2014). [DOI] [PMC free article] [PubMed] [Google Scholar]
- 82.Schmitt A et al. Functional synapses between small-cell lung cancer and glutamatergic neurons. Preprint at bioRxiv 10.1101/2023.01.19.524045 (2023). [DOI] [Google Scholar]
- 83.Savchuk S, et al. Neuronal-activity dependent mechanisms of small-cell lung cancer progression. Preprint at bioRxiv 10.1101/2023.01.19.524430 (2023). [DOI] [Google Scholar]
- 84.Lim JS et al. Intratumoral heterogeneity generated by Notch signaling promotes small-cell lung cancer. Nature 545, 360–364 (2017). [DOI] [PMC free article] [PubMed] [Google Scholar]
- 85.Pan Y et al. NF1 mutation drives neuronal activity-dependent initiation of optic glioma. Nature 594, 277–282 (2021). [DOI] [PMC free article] [PubMed] [Google Scholar]
- 86.Hodgkinson CL et al. Tumorigenicity and genetic profiling of circulating tumor cells in small-cell lung cancer. Nat. Med 20, 897–903 (2014). [DOI] [PubMed] [Google Scholar]
- 87.Calbo J et al. A functional role for tumor cell heterogeneity in a mouse model of small-cell lung cancer. Cancer Cell 19, 244–256 (2011). [DOI] [PubMed] [Google Scholar]
- 88.Seike T et al. Interaction between lung-cancer cells and astrocytes via specific inflammatory cytokines in the microenvironment of brain metastasis. Clin. Exp. Metastasis 28, 13–25 (2011). [DOI] [PMC free article] [PubMed] [Google Scholar]
- 89.Chen Q et al. Carcinoma-astrocyte gap junctions promote brain metastasis by cGAMP transfer. Nature 533, 493–498 (2016). [DOI] [PMC free article] [PubMed] [Google Scholar]
- 90.Kim S-J et al. Astrocytes upregulate survival genes in tumor cells and induce protection from chemotherapy. Neoplasia 13, 286–298 (2011). [DOI] [PMC free article] [PubMed] [Google Scholar]
- 91.Berghoff AS et al. Tumor infiltrating lymphocytes and PD-L1 expression in brain metastases of small-cell lung cancer (SCLC). J. Neurooncol 130, 19–29 (2016). [DOI] [PubMed] [Google Scholar]
- 92.Hohensee I et al. PTEN mediates the cross talk between breast and glial cells in brain metastases leading to rapid disease progression. Oncotarget 8, 6155–6168 (2017). [DOI] [PMC free article] [PubMed] [Google Scholar]
- 93.Strickland MR, Alvarez-Breckenridge C, Gainor JF & Brastianos PK Tumor immune microenvironment of brain metastases: toward unlocking antitumor immunity. Cancer Discov 12, 1199–1216 (2022). [DOI] [PMC free article] [PubMed] [Google Scholar]
- 94.Placencio VR & DeClerck YA Plasminogen activator inhibitor-1 in cancer: rationale and insight for future therapeutic testing. Cancer Res 75, 2969–2974 (2015). [DOI] [PMC free article] [PubMed] [Google Scholar]
- 95.Lee SH, Eren M, Vaughan DE, Schleimer RP & Cho SH A plasminogen activator inhibitor-1 inhibitor reduces airway remodeling in a murine model of chronic asthma. Am. J. Respir. Cell Mol. Biol 46, 842–846 (2012). [DOI] [PMC free article] [PubMed] [Google Scholar]
- 96.Brown NJ Therapeutic potential of plasminogen activator inhibitor-1 inhibitors. Ther. Adv. Cardiovasc Dis 4, 315–324 (2010). [DOI] [PubMed] [Google Scholar]
- 97.Kutz SM, Higgins CE & Higgins PJ Novel combinatorial therapeutic targeting of PAI-1 (SERPINE1) gene expression in Alzheimer’s disease. Mol. Med Ther 1, 106 (2012). [DOI] [PMC free article] [PubMed] [Google Scholar]
- 98.Jacobsen JS et al. Enhanced clearance of Ap in brain by sustaining the plasmin proteolysis cascade. Proc. Natl Acad. Sci. USA 105, 8754–8759 (2008). [DOI] [PMC free article] [PubMed] [Google Scholar]
- 99.Lin L et al. Reelin promotes the adhesion and drug resistance of multiple myeloma cells via integrin p1 signaling and STAT3. Oncotarget 7, 9844–9858 (2016). [DOI] [PMC free article] [PubMed] [Google Scholar]
- 100.Qin X et al. Extracellular matrix protein Reelin promotes myeloma progression by facilitating tumor cell proliferation and glycolysis. Sci. Rep 7, 45305 (2017). [DOI] [PMC free article] [PubMed] [Google Scholar]
- 101.Jandial R, Choy C, Levy DM, Chen MY & Ansari KI Astrocyte-induced Reelin expression drives proliferation of Her2+-breast-cancer metastases. Clin. Exp. Metastasis 34, 185–196 (2017). [DOI] [PMC free article] [PubMed] [Google Scholar]
- 102.Deshpande K et al. Neuronal exposure induces neurotransmitter signaling and synaptic mediators in tumors early in brain metastasis. Neurooncol 24, 914–924 (2022). [DOI] [PMC free article] [PubMed] [Google Scholar]
- 103.Park K-S et al. A crucial requirement for Hedgehog signaling in small-cell lung cancer. Nat. Med 17, 1504–1508 (2011). [DOI] [PMC free article] [PubMed] [Google Scholar]
- 104.Jahchan NS et al. A drug repositioning approach identifies tricyclic antidepressants as inhibitors of small-cell lung cancer and other neuroendocrine tumors. Cancer Discov 3, 1364–1377 (2013). [DOI] [PMC free article] [PubMed] [Google Scholar]
- 105.Butler A, Hoffman P, Smibert P, Papalexi E & Satija R Integrating single-cell transcriptomic data across different conditions, technologies and species. Nat. Biotechnol 36, 411–420 (2018). [DOI] [PMC free article] [PubMed] [Google Scholar]
- 106.Stuart T et al. Comprehensive integration of single-cell data. Cell 177, 1888–1902.e21 (2019). [DOI] [PMC free article] [PubMed] [Google Scholar]
- 107.Corces MR et al. An improved ATAC–seq protocol reduces background and enables interrogation of frozen tissues. Nat. Methods 14, 959–962 (2017). [DOI] [PMC free article] [PubMed] [Google Scholar]
- 108.Langmead B & Salzberg SL Fast gapped-read alignment with Bowtie 2. Nat. Methods 9, 357–359 (2012). [DOI] [PMC free article] [PubMed] [Google Scholar]
- 109.Li H et al. The Sequence Alignment/Map format and SAMtools. Bioinforma. Oxf. Engl 25, 2078–2079 (2009). [DOI] [PMC free article] [PubMed] [Google Scholar]
- 110.Zhang Y et al. Model-based analysis of ChIP–seq (MACS). Genome Biol 9, R137 (2008). [DOI] [PMC free article] [PubMed] [Google Scholar]
- 111.Stark R, Brown G DiffBind: differential binding analysis of ChIP–seq peak data. v. 3.17 (Bioconductor, 2023). [Google Scholar]
- 112.Patro R, Duggal G, Love MI, Irizarry RA & Kingsford C Salmon provides fast and bias-aware quantification of transcript expression. Nat. Methods 14, 417–419 (2017). [DOI] [PMC free article] [PubMed] [Google Scholar]
- 113.Love MI, Huber W & Anders S Moderated estimation of fold change and dispersion for RNA-seq data with DESeq2. Genome Biol 15, 550 (2014). [DOI] [PMC free article] [PubMed] [Google Scholar]
- 114.Yu G, Wang L-G, Han Y & He Q-Y clusterProfiler: an R Package for comparing biological themes among gene clusters. OMICS 16, 284–287 (2012). [DOI] [PMC free article] [PubMed] [Google Scholar]
- 115.Ge SX, Jung D & Yao R ShinyGO: a graphical gene-set enrichment tool for animals and plants. Bioinformatics 36, 2628–2629 (2020). [DOI] [PMC free article] [PubMed] [Google Scholar]
- 116.Zamanian JL et al. Genomic analysis of reactive astrogliosis. J. Neurosci 32, 6391–6410 (2012). [DOI] [PMC free article] [PubMed] [Google Scholar]
- 117.Durinck S, Spellman PT, Birney E & Huber W Mapping identifiers for the integration of genomic datasets with the R/Bioconductor package biomaRt. Nat. Protoc 4, 1184–1191 (2009). [DOI] [PMC free article] [PubMed] [Google Scholar]
- 118.Subramanian A et al. Gene set enrichment analysis: a knowledge-based approach for interpreting genome-wide expression profiles. Proc. Natl Acad. Sci. USA 102, 15545–15550 (2005). [DOI] [PMC free article] [PubMed] [Google Scholar]
Associated Data
This section collects any data citations, data availability statements, or supplementary materials included in this article.
Supplementary Materials
Data Availability Statement
ATAC–seq and RNA-seq data have been deposited in the Gene Expression Omnibus (GSE179032 and GSE178743). All other data supporting the findings of this study are available from the corresponding author on reasonable request. The ENSEMBL mm10 genome (GRCm38) can be accessed at https://www.ncbi.nlm.nih.gov/datasets/genome/GCF_000001635.20/ Source data are provided with this paper.


