Many cardiac and systemic illnesses can affect the left side of the heart. After a careful history and examination, electrocardiography and chest radiography are first line investigations. Electrocardiography can provide supportive evidence for conditions such as aortic stenosis, hypertension, and mitral stenosis. Recognition of the associated electrocardiographic abnormalities is important as misinterpretation may lead to diagnostic error. This article describes the electrocardiographic changes associated with left atrial hypertrophy, left ventricular hypertrophy, valvular disease, and cardiomyopathies.
Conditions affecting left side of heart covered in this article
Left atrial hypertrophy
Left ventricular hypertrophy
Valvular disease
Cardiomyopathies (hypertrophic, dilated, restrictive)
Left ventricular hypertrophy
Voltage criteria
Limb leads
R wave in lead 1 plus S wave in lead III >25 mm
R wave in lead aVL >11 mm
R wave in lead aVF >20 mm
S wave in lead aVR >14 mm
Precordial leads
R wave in leads V4, V5, or V6 >26 mm
R wave in leads V5 or 6 plus S wave in lead V1 >35 mm
Largest R wave plus largest S wave in precordial leads >45 mm
Non-voltage criteria
Delayed ventricular activation time ⩾0.05 s in leads V5 or V6 ⩾0.05 s
ST segment depression and T wave inversion in the left precordial leads
The specificity of these criteria is age and sex dependent
Left atrial abnormality
The term left atrial abnormality is used to imply the presence of atrial hypertrophy or dilatation, or both. Left atrial depolarisation contributes to the middle and terminal portions of the P wave. The changes of left atrial hypertrophy are therefore seen in the late portion of the P wave. In addition, left atrial depolarisation may be delayed, which may prolong the duration of the P wave.
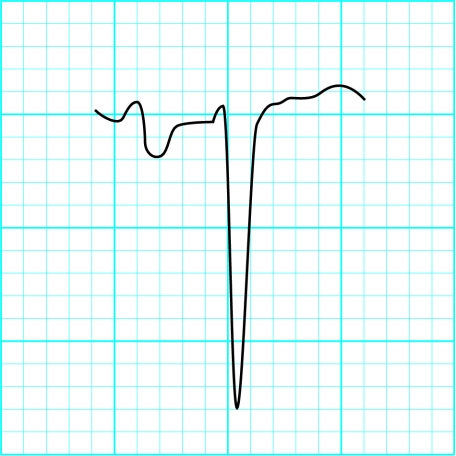
The P wave in lead V1 is often biphasic. Early right atrial forces are directed anteriorly giving rise to an initial positive deflection; these are followed by left atrial forces travelling posteriorly, producing a later negative deflection. A large negative deflection (>1 small square in area) suggests a left atrial abnormality. Prolongation of P wave duration to greater than 0.12 s is often found in association with a left atrial abnormality. Normal P waves may be bifid, the minor notch probably resulting from slight asynchrony between right and left atrial depolarisation. However, a pronounced notch with a peak-to-peak interval of >0.04 s suggests left atrial enlargement.
Any condition causing left ventricular hypertrophy may produce left atrial enlargement as a secondary phenomenon. Left atrial enlargement can occur in association with systemic hypertension, aortic stenosis, mitral incompetence, and hypertrophic cardiomyopathy.
Left ventricular hypertrophy
Systemic hypertension is the most common cause of left ventricular hypertrophy, but others include aortic stenosis and co-arctation of the aorta. Many electrocardiographic criteria have been suggested for the diagnosis of left ventricular hypertrophy, but none is universally accepted. Scoring systems based on these criteria have been developed, and although they are highly specific diagnostic tools, poor sensitivity limits their use.
Electrocardiographic findings
The electrocardiographic features of left ventricular hypertrophy are classified as either voltage criteria or non-voltage criteria.
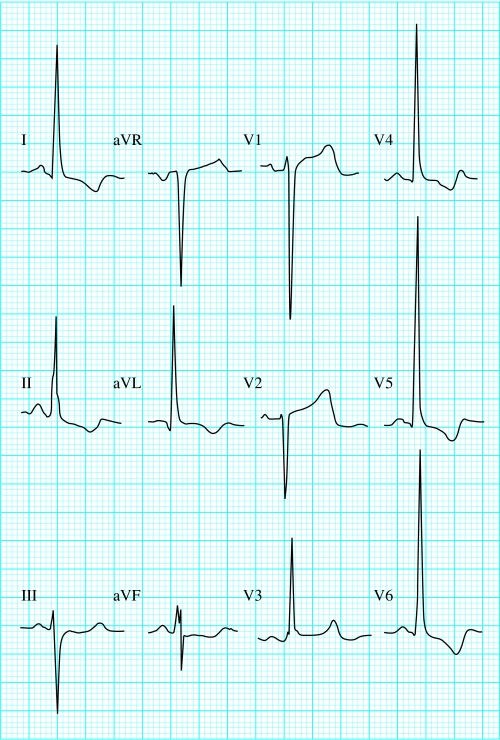
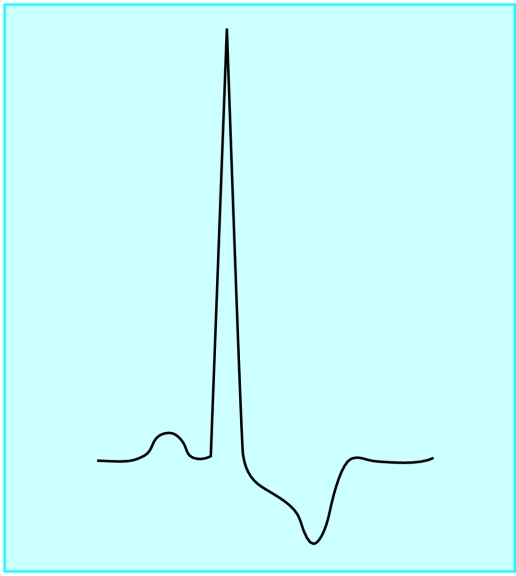
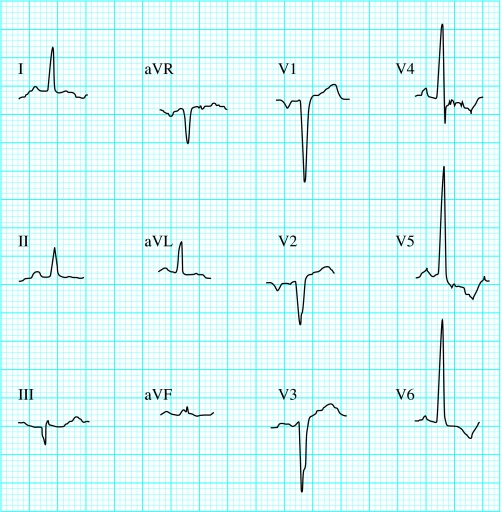
The electrocardiographic diagnosis of left ventricular hypertrophy is difficult in individuals aged under 40. Voltage criteria lack specificity in this group because young people often have high amplitude QRS complexes in the absence of left ventricular disease. Even when high amplitude QRS complexes are seen in association with non-voltage criteria—such as ST segment and T wave changes—a diagnosis cannot be made with confidence. Typical repolarisation changes seen in left ventricular hypertrophy are ST segment depression and T wave inversion. This “strain” pattern is seen in the left precordial leads and is associated with reciprocal ST segment elevation in the right precordial leads.
The presence of these ST segment changes can cause diagnostic difficulty in patients complaining of ischaemic-type chest pain; failure to recognise the features of left ventricular hypertrophy can lead to the inappropriate administration of thrombolytic therapy.
Furthermore, in patients known to have left ventricular hypertrophy it can be difficult to diagnose confidently acute ischaemia on the basis of ST segment changes in the left precordial leads. It is an advantage to have old electrocadiograms for comparison. Other non-voltage criteria are common in left ventricular hypertrophy. Left atrial hypertrophy or prolonged atrial depolarisation and left axis deviation are often present; and poor R wave progression is commonly seen.
The electrocardiogram is abnormal in almost 50% of patients with hypertension, with minimal changes in 20% and obvious features of left ventricular hypertrophy in 30%. There is a linear correlation between the electrocardiographic changes and the severity and duration of the hypertension. High amplitude QRS complexes are seen first, followed by the development of non-voltage criteria.
The specificity of the electrocardiographic diagnosis of left ventricular hypertrophy is improved if a scoring system is used.
Scoring system for left ventricular hypertrophy (LVH) —suggested if points total ⩾5
Electrocardiographic feature No of points
Amplitude (any of the following) 3
Largest R or S wave in limb leads ⩾20 mm
S wave in leads V1 or V2 ⩾30 mm
R wave in leads V5 or V6 ⩾30 mm
ST-T wave segment changes typical for LVHin the absence of digitalis 3
Left atrial involvement 3
Left axis deviation 2
QRS duration of ⩾0.09 s 1
Delayed ventricular activation time in leadsV5 and V6 of ⩾0.05 s 1
Valvular problems
A normal electrocardiogram virtually rules out the presence of severe aortic stenosis, except in congenital valve disease, where the trace may remain normal despite a substantial degree of stenosis. Left ventricular hypertrophy is seen in about 75% of patients with severe aortic stenosis. Left atrial enlargement may also be seen in the electrocardiogram. Left axis deviation and left bundle branch block may occur.
Electrocardiographic features of valvular disease
The electrocardiographic features of aortic regurgitation include the features of left ventricular hypertrophy, often with the strain pattern
Mitral stenosis is associated with left atrial abnormality or atrial fibrillation and right ventricular hypertrophy
Mitral regurgitation is associated with atrial fibrillation, though again the features of left atrial hypertrophy may be seen if the patient is in sinus rhythm. Evidence of left ventricular hypertrophy may be seen
The cardiomyopathies
Diseases of the myocardium are classified into three types on the basis of their functional effects: hypertrophic (obstructed), dilated (congestive), or restrictive cardiomyopathy. In cardiomyopathy the myocardium is diffusely affected, and therefore the resulting electrocardiographic abnormalities may be diverse.
Common features of cardiomyopathy include electrical holes (Q waves), conduction defects (bundle branch block and axis deviation), and arrhythmias
Hypertrophic cardiomyopathy
This is characterised by marked myocardial thickening predominantly affecting the interventricular septum and/or the apex of the left ventricle. Electrocardiographic evidence of left ventricular hypertrophy is found in 50% of patients. A characteristic abnormality is the presence of abnormal Q waves in the anterolateral or inferior chest leads, which may mimic the appearance of myocardial infarction. As the left ventricle becomes increasingly less compliant, there is increasing resistance to atrial contraction, and signs of left atrial abnormality are commonly seen. Atrial fibrillation and supraventricular tachycardias are common arrhythmias in patients with hypertrophic cardiomyopathy. Ventricular tachycardias may also occur and are a cause of sudden death in these patients.
Main electrocardiographic changes associated with hypertrophic cardiomyopathy
Left ventricular hypertrophy
Left atrial enlargement
Abnormal inferior and anterior and/or lateral Q waves
Bizarre QRS complexes masquerading, for example, as pre-excitation and bundle branch block
Dilated cardiomyopathy
Many patients with dilated cardiomyopathy have anatomical left ventricular hypertrophy, though the electrocardiographic signs of left ventricular hypertrophy are seen in only a third of patients. In some patients the signs of left ventricular hypertrophy may be masked as diffuse myocardial fibrosis can reduce the voltage of the QRS complexes. If right ventricular hypertrophy is also present the increased rightward forces of depolarisation may cancel out some of the leftward forces, again masking the signs of left ventricular hypertrophy.
ECG changes in dilated cardiomyopathy
Left bundle branch block
Left atrial enlargement
Abnormal Q waves in leads V1 to V4
Left ventricular hypertrophy
Arrhythmias—ventricular premature beats, ventricular tachycardia, atrial fibrillation
Signs of left atrial enlargement are common, and often there is evidence of biatrial enlargement. Abnormal Q waves may be seen, though less commonly than in hypertrophic cardiomyopathy. Abnormal Q waves are most often seen in leads V1 to V4 and may mimic the appearance of a myocardial infarction.
Restrictive cardiomyopathy
Restrictive cardiomyopathy is the least common form of cardiomyopathy and is the end result of several different diseases associated with myocardial infiltration—for example, amyloidosis, sarcoidosis, and haemochromatosis. The most common electrocardiographic abnormality is the presence of low voltage QRS complexes, probably due to myocardial infiltration. Both supraventricular and ventricular arrhythmias are common.
Electrocardiographic findings in restrictive cardiomyopathy
Low voltage QRS complexes
Conduction disturbance
Arrhythmias—supraventricular, ventricular
Figure.
Biphasic P wave in V1. The large negative deflection indicates left atrial abnormality (enlarged to show detail)
Figure.
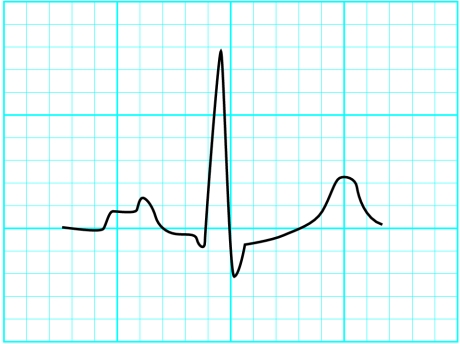
P mitrale in lead II. P mitrale is a P wave that is abnormally notched and wide and is usually most prominent in lead II; it is commonly seen in association with mitral valve disease, particularly mitral stenosis (enlarged to show detail)
Figure.
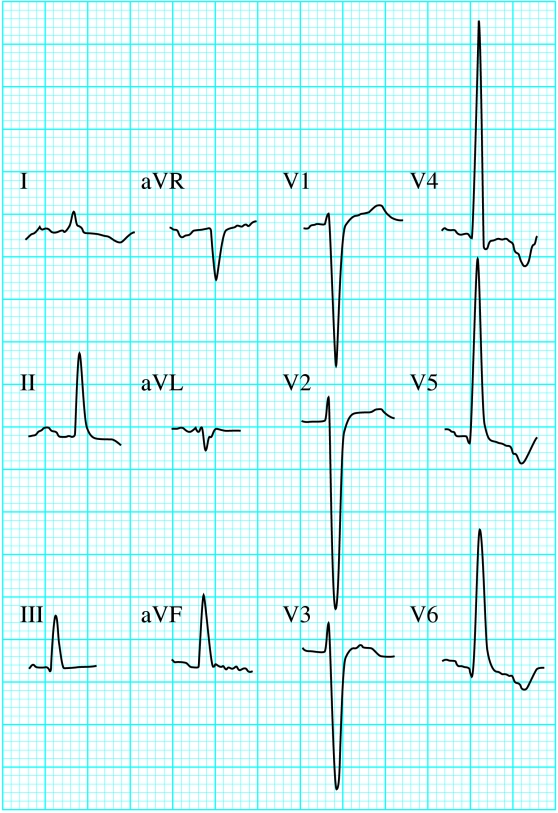
Left ventricular hypertrophy in patient who had presented with chest pain and was given thrombolytic therapy inappropriately because of the ST segment changes in V1 and V2
Figure.
Left ventricular hypertrophy with strain (note dominant R wave and repolarisation abnormality)
Figure.
Left ventricular hypertrophy without voltage criteria—in a man who presented with heart failure secondary to severe aortic stenosis (gradient 125 mm Hg). The ST segment changes are typical for left ventricular hypertrophy and there is evidence of left atrial enlargement. If the scoring system is used, these findings suggest left ventricular hypertrophy even though none of the R or S waves meets voltage criteria
Figure.
Abnormal Q waves in patient with hypertrophic cardiomyopathy
Figure.
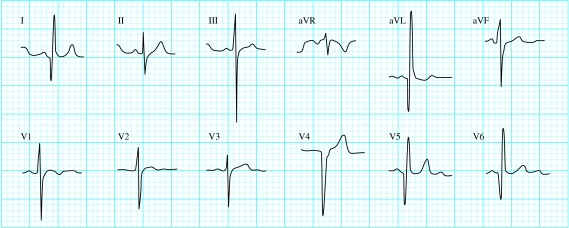
Dilated cardiomyopathy (note left ventricular hypertrophy pattern)
Figure.
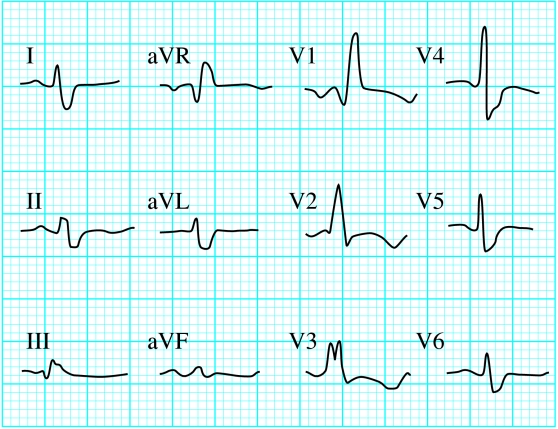
Patient with restrictive cardiomyopathy due to amyloidosis (note the low voltage QRS complexes and the right bundle branch block)
Acknowledgments
The box showing voltage criteria for left ventricular hypertrophy and the box showing the scoring system are adapted from Chou T, Knilans TK. Electrocardiography in clinical practice. 4th ed. Philadelphia, PA: Saunders, 1996.
Footnotes
R K Thakur is professor of medicine, Thoracic and Cardiovascular Institute, Michigan State University, Lancing, MI, USA, where Jihad M Khalil also worked at the time of submission.
The ABC of clinical electrocardiography is edited by Francis Morris, consultant in emergency medicine at the Northern General Hospital, Sheffield; June Edhouse, consultant in emergency medicine, Stepping Hill Hospital, Stockport; William J Brady, associate professor, programme director, and vice chair, department of emergency medicine, University of Virginia, Charlottesville, VA, USA; and John Camm, professor of clinical cardiology, St George's Hospital Medical School, London. The series will be published as a book in the summer.


