

Abstract
Inferring gene regulatory networks (GRNs) allows us to obtain a deeper understanding of cellular function and disease pathogenesis. Recent advances in single-cell RNA sequencing (scRNA-seq) technology have improved the accuracy of GRN inference. However, many methods for inferring individual GRNs from scRNA-seq data are limited because they overlook intercellular heterogeneity and similarities between different cell subpopulations, which are often present in the data. Here, we propose a deep learning-based framework, DeepGRNCS, for jointly inferring GRNs across cell subpopulations. We follow the commonly accepted hypothesis that the expression of a target gene can be predicted based on the expression of transcription factors (TFs) due to underlying regulatory relationships. We initially processed scRNA-seq data by discretizing data scattering using the equal-width method. Then, we trained deep learning models to predict target gene expression from TFs. By individually removing each TF from the expression matrix, we used pre-trained deep model predictions to infer regulatory relationships between TFs and genes, thereby constructing the GRN. Our method outperforms existing GRN inference methods for various simulated and real scRNA-seq datasets. Finally, we applied DeepGRNCS to non-small cell lung cancer scRNA-seq data to identify key genes in each cell subpopulation and analyzed their biological relevance. In conclusion, DeepGRNCS effectively predicts cell subpopulation-specific GRNs. The source code is available at https://github.com/Nastume777/DeepGRNCS.
Keywords: gene regulatory networks, single-cell RNA sequencing, deep learning model, intercellular heterogeneity
Introduction
Crucial biological processes, such as cell development, proliferation and differentiation, are dependent on the regulation of gene expression. Genes form complex relationships with each other. Gene regulatory networks (GRNs) provide insights into these complex regulatory interactions among genes, helping us study the mechanisms and causes of diseases as well as the function and status of cells. The rapid advancement of single-cell RNA sequencing (scRNA-seq) has allowed the inference of GRNs from gene expression data at the single-cell level, enabling the determination of gene expression levels across different cells.
Various computational methods, such as correlation-based techniques [1], information theory [2, 3], Bayesian networks [4, 5], Boolean models [6, 7], regression methods [8–10] and methods based on differential equations [11–13], have been developed to infer GRNs using scRNA-seq data. However, the complexity of regulatory relationships between genes and experimental noise in scRNA-seq data leads to difficulty in precisely determining GRNs using traditional mathematical models, resulting in high error rates.
In recent years, deep learning has been used to infer GRNs. Yuan et al. [14] developed a convolutional neural network (CNN) for coexpression (CNNC), providing a supervised approach for inferring GRNs. However, the CNNC requires the conversion of each gene pair into a normalized empirical probability function matrix involving a large number of genes, making it a labor-intensive task. Moreover, if data transformation is insufficient, the CNN model might not be effectively trained. Hantao et al. [15] proposed the DeepSEM model to simulate regulatory relationships between genes using structural equation modeling. However, when the number of genes is substantially large, the curse of dimensionality may affect the GRN neighborhood matrix. In addition, deep learning has also been used for drug synergy prediction and Drug–Target Interaction prediction. Rafiei et al. [16] utilized transformer-based architecture and deep neural networks to extract drugs and cell line features, respectively, and ultimately predicted the synergy value using XGBoost. Dehghan et al. [17] fused multimodal knowledge based on attention based modules and fed the results into the utilization of multilayer perceptron to predict the affinity values.
Tissues consist of various cell types, resulting in diverse cell subpopulations within scRNA-seq data, with each subpopulation characterized by unique GRNs [18]. All of the aforementioned methods used for inferring GRNs from gene expression data often overlook this cellular heterogeneity. In addition, these methods may miss shared information within data from the same source when inferring GRNs for each cell subpopulation independently. Thus, the joint inference of GRNs across multiple cell subpopulations can yield precise results [19]. The joint Gaussian graphical model has been used to estimate cell-type-specific gene networks [20–22]. However, these methods assume that data follow a Gaussian distribution, which is not always accurate because scRNA-seq data typically follow a negative binomial distribution [23]. Although many models, such as the non-paranormal Gaussian graphical model, have been extended to handle non-Gaussian data, their effectiveness in accurately representing real data remains to be validated. Furthermore, these methods assume that all nodes have an equal probability of being connected, overlooking the fact that transcription factors (TFs) typically regulate other genes or TFs in real gene networks.
Here, we propose a deep learning-based framework, DeepGRNCS, for jointly inferring GRNs across cell subpopulations. Inspired by SIGNET [24], we used a deep neural network to predict the expression value of a target gene based on the expression values of TFs (Fig. 1A). In contrast to the deep model in SIGNET, which uses binary input data, we used the raw expression data of TFs as input data, thereby preserving a higher amount of feature information than the deep model to efficiently infer the regulatory relationship between TFs and genes. Subsequently, we discretized the expression values of target genes using the equal-width method, with the processed results serving as output labels for the deep model. Finally, we used the strategy of individually ‘knocking out’ TFs to evaluate the impact of each TF on the target gene using the pre-trained deep model. This approach eliminates the need for a priori information in the GRN inference process. Similar to many common machine learning algorithms [25], the DeepGRNCS follows a two-step process: training and inference. During training, the model learns from the input data. In the inference step, the trained model uses its learned knowledge to map modified data onto the output space.
Figure 1.

Overview of DeepGRNCS. (A) The scRNA-seq data of subpopulations were divided into TF and gene expression data. The TF expression data were used as input for the deep model, where the data of the primary subpopulation were input into the Network Main and the data of other subpopulations were input into the Network Pair. The expression data of the target gene g in the primary subpopulation were used as output labels to train a pre-trained deep model for gene g. (B) The TFs in the primary subpopulation and other subpopulations were assigned a value of 0 sequentially, whereas the other TFs remained unchanged. The updated matrices were then used as input for the pre-trained deep model to obtain the accuracy rate of predicting the target gene g. Finally, the regulatory weight of each TF on gene g was calculated based on the accuracy rate using the ZSCORE method.
We evaluated the performance of DeepGRNCS against four Gaussian graphical model-based methods, namely JEGN [20], SRMDG [21], NETI2 [22] and DKGN [26], for cell-specific GRN construction. The results of our framework were superior to those produced by the four studied methods. Subsequently, we simulated scRNA-seq data using BoolODE [27] and compared DeepGRNCS with four optimal GRN inference methods, namely PIDC [2], GENIE3 [8] SINCERITIES [10] and SOCDE [11]. DeepGRNCS outperformed these methods in terms of the area under the receiver operating characteristic curve (AUROC) and the area under the precision-recall curve (AUPRC). In addition, when compared with five other GRN inference methods, including DeepSEM [15], mutual information (MI), GRNBoost2 [9], GENIE3 [8] and DKGN [26], using ground truth networks from six scRNA-seq single-cell datasets, DeepGRNCS showed slightly better performance. Finally, we applied DeepGRNCS to a non-small cell carcinoma (NSCLC) scRNA-seq dataset [28] to identify key genes in malignant and non-malignant AT2 cells in lung adenocarcinoma (LUAD) patients and to investigate the varying functional states of basal cells in both early- and late-stage squamous adenocarcinoma (LUSC) patients.
Our proposed DeepGRNCS method jointly constructs GRNs using data from multiple subpopulations, in contrast to most previous deep model-based methods [14, 15]. In addition, compared with algorithms used for the joint construction of GRNs [20–22], our approach enhances the biological relevance of the constructed network by distinguishing between TFs and genes. Moreover, we employ an in silico gene perturbation strategy, simulating the effect of removing a TF on a target gene, thereby enabling a systematic and efficient assessment of each TF’s regulatory influence. However, DeepGRNCS has some limitations. The method requires the categorization information of cellular subpopulations to construct subpopulation-specific networks. In addition, DeepGRNCS needs a large number of cell samples to train the deep model, and the presence of a substantially small number of cells can affect the accuracy.
Materials and methods
Datasets
Using the method reported by Zhang et al. [20], we simulated scRNA-seq data for various cell subpopulations. We established a common network, R, for all subpopulations and a unique network,  , specific to each subpopulation. This approach enabled the GRN for subpopulation k to be represented as
  . The random networks were created on the basis of the Erdős-Rényi model. Using these available GRNs specific to each cell subpopulation, we generated simulated scRNA-seq data based on a Gaussian distribution. In total, we generated two simulated scRNA-seq datasets, one with 50 genes and the other with 100 genes, each containing four subpopulations. The 50-gene dataset had 1000 cells per subpopulation, whereas the 100-gene dataset had 2000 cells per subpopulation.
We used synthetic networks and published Boolean networks from BEELINE [27] and the BoolODE [27] method to generate simulated scRNA-seq datasets. We selected three synthetic networks, namely bifurcation (BF), bifurcation convergence (BFC) and trifurcation (TF), and two published Boolean networks, namely hematopoietic stem cell differentiation (HSC) and gonadal sex determination (GSD). Because of the complex structure of these networks, we modified certain network edges to simulate different cell subpopulations. We ensured that all of the modified networks retained at least 0.7 similarity to the original network to account for subpopulation similarities. Finally, each network generated scRNA-seq data for three cell subpopulations, with 1000 cells in each subpopulation, allowing us to assess the performance of DeepGRNCS and other methods.
Six real scRNA-seq datasets were derived from BEELINE [27] to evaluate our method: human embryonic stem cells (hESC), human mature hepatocytes (hHEP), mouse dendritic cells (mDC), mouse hematopoietic stem cells with erythroid lineage (mHSC-E), mouse hematopoietic stem cells with granulocyte-monocyte lineage (mHSC-GM) and mouse hematopoietic stem cells with lymphoid lineage (mHSC-L). We used cell-type-specific ChIP-seq networks from BEELINE as the ground truth, including all significantly varying TFs and the 500 and 1000 most-varying genes. We used the scRNA-seq data of TFs and genes in these ground truth networks to infer GRNs. The number of cells in each dataset and the corresponding ground truth network statistics are provided in Table 1.
Table 1.
Statistics of single-cell transcriptomic datasets and ground-truth networks with TFs and 500 (1000) most-varying genes
| hESC | hHEP | mDC | mHSC-E | mHSC-GM | mHSC-L | |
|---|---|---|---|---|---|---|
| TFs | 34(34) | 30(31) | 20(21) | 29(33) | 22(23) | 16(16) |
| Genes | 815(1260) | 874(1331) | 443(684) | 691(1177) | 618(1089) | 525(640) |
| Cells | 759 | 426 | 384 | 1,072 | 890 | 848 |
| Edges | 436,563 | 342,862 | 30,658 | 1,078,888 | 1,078,888 | 1,078,888 |
| Density | 0.186 | 0.243 | 0.077 | 0.407 | 0.407 | 0.407 |
We obtained the scRNA-seq datasets of AT2 cells from LUAD patients and basal cells from LUSC patients from the study conducted by Zhang et al. [28]. We selected all AT2 cells in stage 1 and identified differentially expressed genes between malignant and non-malignant cells as reported by Zhang et al. [28]. From these genes, we chose a set of TFs from the catalog of likely human TFs [29] along with related genes from the Kyoto Encyclopedia of Genes and Genomes [30]. For model training, only the top 2000 high-expression cells were chosen. For the LUSC dataset, we derived seven clusters of basal cells from the study by Zhang et al. [28], focusing on clusters 1, 2, and 3. Clusters 1 and 3 mainly consisted of basal cells from early-stage (stage I and II) patients, whereas cluster 2 was composed entirely of cells from stage III patients. We identified the top 1000 differentially expressed genes in each cluster and obtained the corresponding TFs using the previously mentioned method. For each cluster, we selected the top 1000 cells with abundant expression for further analysis. The statistical information of LUAD and LUSC groups is provided in Table 2.
Table 2.
Statistical information on the NSCLC single-cell dataset. The first two columns represent the malignant and non-malignant cells from AT2 cells from LUAD patients, and the last three columns represent the three clusters of basal cells from LUSC patients
| mali | non-mali | Clu-1 | Clu-2 | Clu-3 | |
|---|---|---|---|---|---|
| TFs | 37 | 37 | 30 | 82 | 74 |
| Genes | 450 | 450 | 928 | 883 | 837 |
| Cells | 11 222 | 6189 | 3275 | 1409 | 1272 |
The DeepGRNCS framework
In this study, we propose the DeepGRNCS framework, which infers cell subpopulation-specific GRNs from scRNA-seq data (Fig. 1). The framework consists of three main steps: (i) preprocessing gene expression data for subpopulations, (ii) training a deep model to predict the expression value of the target gene g by using the expression values of TFs and (iii) investigating the regulatory effects of TFs on the target gene g by sequentially excluding their data.
Data preprocessing
As shown in Fig. 1(A), the scRNA-seq data of the primary subpopulation and other subpopulations were divided into TF expression data and target gene expression data. The raw expression data of TFs were used as input for training the deep model, which allows for the preservation of more original information. Furthermore, we considered designing classification models that require the target gene data from the primary subpopulation were used as output labels for the deep model. The raw data of the target gene were normalized and discretized according to the following equation, similar to [31].
 |
(1) |
where  represents the expression of gene g in cell c in the scRNA-seq expression matrix M and
  represents the number of cells in subpopulation k. We sequentially processed the primary subpopulation data for each target gene. Initially, a small number
  was added to prevent empty entries before applying logarithmic normalization. The data were then normalized to all cell data for a gene by using logarithms and divided by the number of cells
  . Finally, the result was expanded by a factor of 10 and rounded to produce an integer output as a label.
The deep neural network for gene expression prediction
The deep neural network in the DeepGRNCS framework consists of two parts: the Network Main and Network Pair (Fig. 1A). The Network Main has two hidden layers that use the TF expression data of the primary subpopulation as input. The Network Pair contains a hidden layer with the same number of neurons as the hidden layer in the Network Main and uses the TF expression data of other subpopulations as input. The outputs of these two networks are then combined and passed through a fully connected layer to predict the expression value of the target gene g in a cell from the primary subpopulation. We use PyTorch to build the underlying neural network and employ GPUs to improve computational efficiency. Each hidden layer processes input data through eight neuron nodes, followed by normalization and ReLu() activation functions, to produce the output. The cross-entropy loss function is used to measure the difference between the predicted and actual values of gene g, so we implemented this process using the CrossEntropyLoss() from the torch package. The results based on the loss function are backpropagated to update each model parameter using the Adam optimiser and reduce the loss between predicted and actual values. Thus, the pre-trained deep model represents an unknown non-linear function that can predict the expression value of the target gene g by regressing the expression value of TFs (equation 2), where  denotes the vector of expression values for gene g and N denotes the number of genes.
 |
(2) |
Zhang et al. suggested that similar gene interactions exist across subpopulations because they typically originate from the same tissue [20]. However, these similarities are often overlooked when constructing GRNs for individual subpopulations. To enhance prediction accuracy, the DeepGRNCS framework also uses datasets from different subpopulations. Data from the primary subpopulation are fed into the Network Main, whereas feature information from other subpopulations is processed using the Network Pair. This process is repeated to obtain a pre-trained deep model for each gene in the primary subpopulation, and this model is then used in subsequent steps of the DeepGRNCS framework.
Prediction of the relationship between genes
We assume that the expression value of each gene can be modeled as a complex function of the expression value of TFs. If certain TFs significantly regulate gene g, removing them would affect the accuracy of the pre-trained deep model in inferring the expression values of gene g. We trained a deep model for the target gene g (Fig. 1A) and then sequentially set the TFs in the primary subpopulation to 0, simulating the removal of that TF (Fig. 1B). For example, the first matrix in Fig. 1B represents the outcome of removing the first TF while ensuring that the other TFs remain unchanged. Subsequently, the modified TF expression matrix and data from other TF subpopulations are fed into the pre-trained deep model for gene g. If the accuracy of the pre-trained deep model in inferring gene g in the absence of a particular TF is significantly lower than that in the presence of that TF, it indicates a strong regulatory relationship between that TF and gene g. Conversely, if accuracy remains largely unffected, the relationship is weak. Thus, the regulatory weights of TFs on the target gene g can be calculated based on accuracy (Fig. 1B). The error rate is obtained from the accuracy (equation 3), and a higher error rate indicates that the TF h has a significant regulatory effect on gene g. Finally, the regulatory weight of the TF h on gene g was calculated using the ZSCORE method (equation 4). By repeating this process for each TF, we obtained its regulatory weight for gene g. Because the error rates are calculated for all TFs for a single target gene at a time, we used the ZSCORE method to standardize the error rates and ensure the comparability of the regulatory weights of all TFs for all genes (equation 4):
 |
(3) |
 |
(4) |
where  represents the prediction accuracy of gene g expression by the deep model without the TF h,
  represents the regulatory weight of the TF h on gene g, and
  and
and  represent the mean and standard deviation of the error rate vector, respectively.
By repeating the aforementioned process, we used the pre-trained deep model for each gene to determine the regulatory weights between each TF and each gene and finally constructed the GRN for the primary subpopulation. To infer different GRNs for each cell subpopulation, we used each subpopulation’s data as input for the Network Main and data from the remaining subpopulations as input for the Network Pair.
Results
Performance of DeepGRNCS on simulated datasets and real datasets
We first evaluated the effectiveness of the DeepGRNCS framework in inferring cell subpopulation-specific networks by comparing it with NETI2 [22], JEGN [20], SRMDG [21] and DKGN [26]. The first three methods use joint Gaussian graphical models to estimate multiple GRNs simultaneously. The DKGN method uses a priori knowledge (a subset of edges) to estimate individual networks, where we consider a random selection of  of the edges. Because the simulated dataset did not distinguish between TFs and genes, we treated all non-target genes as regulatory genes. The simulated scRNA-seq datasets generated by JEGN contained two datasets with varying numbers of genes as described above. Overall, DeepGRNCS significantly outperformed these four methods in terms of AUROC and AUPRC (Fig. 2A and B). The prediction accuracy of each method decreased as the number of genes increased. Specifically, DeepGRNCS obtained AUROC and AUPRC values that were on average
  and
and  higher than the next best method (SRMDG) in both datasets. In addition, we calculated the early precision ratio (EPR) [27] and F1-score evaluation metrics, which are shown in Supplementary Table S1 and Fig. S1. DeepGRNCS outperformed the next best method (DKGN) by
  and
and  for EPR and F1 values, respectively. Next, we evaluated common and unique interactions in each subpopulation separately (Fig. 2A and B) and found that each method was more effective in predicting common edges than unique edges. Specifically, DeepGRNCS, SRMDG and DKGN had very high AUROC and AUPRC values for predicting common edges that were very close to 1. In addition, the AUROC values of DeepGRNCS for predicting subpopulation-unique edges were on average
  and
and  higher than those of the next best methods (SRMDG and DKGN), and the AUPRC values were on average
  and
and  higher, respectively.
Figure 2.

(A and B) GRN inference performance comparison on two simulated scRNA-seq datasets with a Gaussian distribution. The dataset gene50-com contains 50 genes and evaluates only edges that are common to all subpopulations, whereas the dataset gene50-uni assesses edges that are unique to each subpopulation. Box plots show the median, interquartile range, and whisker plots (extending to 1.5 times the interquartile range). (C and D) GRN inference performance comparison on five simulated scRNA-seq datasets derived from two synthetic networks and three Boolean networks. (E and F) GRN inference performance comparison on six real scRNA-seq datasets, each with the 500 or 1000 most varying TFs and genes.
A simulated dataset containing 100 genes was analyzed from two perspectives. First, we investigated the effect of the number of cells on the prediction of GRNs (Supplementary Fig. S2). When the number of cells was less than the number of regulatory genes, the prediction of DeepGRNCS was very low and showed almost no growth. As the number of cells increased, the prediction of GRNs improved, with an average improvement of  for a cell number of 1000 compared to a cell number of 500. Finally, the effect of the number of cells was minimal after reaching a certain threshold, with a cell number of 2000 being on average
  lower than a cell number of 1500 for F1 and on average
  higher for the other metrics (AUROC, AUPRC and EPR). Second, 10-fold cross-validation was performed for evaluation (Supplementary Table S2). The DeepGRNCS method demonstrated satisfactory stability when evaluated with a 9:1 training-to-test split of the dataset. Among them, the EPR value of the assessment indicator with the largest variance is only 0.027, and the smallest AUROC variance value is 0.007.
To further validate the capability of DeepGRNCS, we specifically selected four methods, namely (PIDC [2], GENIE3 [8], SINCERITIES [10] and SOCDE [11]), that produced outstanding results in research on GRN inference benchmarking algorithms [27]. Among them, SINCERITIES and SOCDE rely on pseudotime information, whereas GENIE3 is highly effective in reconstructing GRNs using scRNA-seq data. We evaluated their performance on simulated scRNA-seq datasets derived from three synthetic networks (BF, BFC and TF) and two published Boolean networks (HSC and GSD), which served as the ground truth networks. DeepGRNCS outperformed all of the other methods in terms of AUROC and AUPRC (Fig. 2C and D). Specifically, the DeepGRNCS method improves the AUROC values by  and
and  over the sub-optimal algorithms (PIDC and GENIE3), and by
  and
and  over their AUPRC values. The EPR and F1-score values were calculated on the basis of the number of positive samples in each simulated dataset (Supplementary Table S3). Our method enhanced prediction accuracy by using data from simulated cell subpopulations, which were created by modifying the edges of the original network.
Finally, we assessed the generality of the methods by applying them to real scRNA-seq datasets. Because real scRNA-seq datasets often lack cell timing information, some methods requiring pseudotime, such as SINCERITIES [10] and SOCDE [11], cannot be used here. For comparison, we used DeepSEM [15], MI, GRNBoost2 [9], GENIE3 [8] and DKGN [26], randomly selecting  of the edges as prior knowledge. Real scRNA-seq datasets often lack information on cell subpopulations. Thus, our method treated all data as a single cell type due to the absence of other relevant cell subpopulations that could contribute additional valuable inputs (Fig. 1A). The six real scRNA-seq datasets we used, as mentioned in the GRN inference benchmarking algorithm research, were hESC, hHEP, mDC, mHSC-E, mHSC-GM and mHSC-L (Table 1). In addition, we selected interactions with
  (outliers determined by the z-score) as predicted interactions, considering the substantial number of interactions in the ground truth network. DeepGRNCS resulted in AUPRC values that were, on average,
  higher than those produced by the suboptimal method but
  lower than those produced by the DKGN algorithm in the mHSC-GM dataset at TFs+500, as shown in Fig. 2(E) and (F). Moreover, we calculated EPR values and F1-scores for the top 500 (1000) ranked regulatory weights for the TFs+500 (TFs+1000) dataset, as shown in Supplementary Tables S4 and S5. The EPR and F1 values obtained by DeepGRNCS are, on average,
  and
and  higher than the sub-optimal algorithm DeepSEM, respectively.
In addition, we conducted a Wilcoxon signed-rank test to compare the performance difference between DeepGRNCS and other methods. The results showed that DeepGRNCS significantly outperformed other methods in 88.4% of the cases across AUROC and AUPRC metrics on the simulated and real datasets ( -value
  ) (Supplementary Table S6).
Impact of cell subpopulation quantity and discretization methods on performance
Incorporating data from additional cell subpopulations can improve the accuracy of GRN inference. The scRNA-seq datasets generated by Zhang et al. [20] in our study effectively simulated multiple cell subpopulations and enabled a reliable assessment of the influence of the number of cell subpopulations. The results revealed that optimal prediction is achieved by adding two additional subpopulations (totaling three subpopulations) (Fig. 3A). The AUROC and AUPRC values of the three subpopulations were  and
and  higher than those of one subpopulation, respectively. Thus, we employed two modified versions of the synthetic and Boolean networks in BEELINE [27], along with the original one, to generate three simulated cell subpopulations for each network.
Figure 3.

(A) Evaluation of the impact of different subpopulation numbers on the predicted GRN. AUROC and AUPRC were calculated from a single subpopulation to additional three subpopulations. (B) Evaluation of the impact of different discretization methods for output on the predicted GRN. AUROC for the original data, equal-width discretization, equal-frequency discretization and mean clustering were calculated.
During the training and prediction of the DeepGRNCS deep model, we converted the target gene expression data into discrete values (Fig. 1A). We evaluated three data discretization methods: equal-width discretization, equal-frequency discretization and K-means clustering. Equal-width discretization employs a logarithmic approach. Upon evaluating the simulated dataset, we determined that logarithmic equal-width discretization provided the best results (Fig. 3B). The AUROC obtained by the logarithmic equal-frequency discretization method is on average  higher than the next best method.
Key genes from the inferred GRNs in NSCLC patients
Lung cancer, a devastating and deadly disease, poses a significant challenge due to its biological complexity, often leading to treatment failure. Lung cancer is classified into two main types: NSCLC and small-cell lung cancer. NSCLC is the most prevalent type and includes LUAD and LUSC. Using the differentially expressed genes from the AT2 cells of LUAD patients [28], we inferred TF regulatory networks for both malignant and non-malignant cells based on upregulated genes. We selected edges with  to infer the networks, identifying 244 and 331 edges for malignant and non-malignant cells, respectively. Subsequently, we chose genes with a degree of at least 3 as hub genes and their neighboring genes to form local networks. The local networks of malignant and non-malignant cells contained 234 and 328 edges, respectively, as shown in Fig. 4. The important nodes in our inferred network were closely related to LUAD. Among them, ELF3 is a lineage-specific amplified oncogene and a potential therapeutic target in LUAD [32]. William et al. found that HOPX can suppress metastasis in LUAD. These factors and their target genes establish a direct correlation between airway specification mechanisms and the pathogenesis of NSCLC [33]. CASC15 enhances the expression of its neighboring gene, SOX4, located on the same chromosome. SOX4 stabilizes the
  -catenin protein, thereby boosting the proliferation and migration of NSCLC cells [34]. ELF3, HOPX and SOX4 regulate more genes in malignant cells than in non-malignant cells (Fig. 4) and may thus contribute to LUAD progression. The literature demonstrates the association of these genes with LUAD. These findings indicate the effectiveness of DeepGRNCS in inferring GRNs and determining associations between crucial genes and LUAD.
Figure 4.

(A) The regulatory network of malignant AT2 cells from LUAD upregulated DEGs. (B) The regulatory network of non-malignant AT2 cells from LUAD upregulated DEGs. Regulatory relationships with weights greater than three were selected.
We used DeepGRNCS to infer GRNs for the three clusters of basal cells in patients with LUSC. All regulators in these GRNs were selected as key genes with edge’s  (Table 3). We combined the key gene lists from Clusters 1 and 3 because they correspond to the early stage, whereas the list from Cluster 2 represents the late stage. We used CancerSEA to analyze the functional states of cells in both early and late stages, comprehensively exploring the diverse functional states of cancer cells at the single-cell level [35]. The correlation between the average expression levels of key genes and the activity of six functional states was examined for both early and late stages of NSCLC, as depicted in Fig. 5. We selected functional states that were closely related to the key genes obtained from the late stage, and all of them had correlation values greater than 0.3. We then examined correlations between the early key genes and these functional states and found that their correlations had lower absolute values than those of the late-stage genes. In addition, we observed that key genes in the late-stage basal cells were strongly associated with both DNA repair and DNA damage status. Angiogenesis is a complex biological process that plays a crucial role in maintaining the microenvironment, growth and metastasis of NSCLC [36]. We found that the key genes in the late stage were strongly correlated with the epithelial-mesenchymal transition (EMT) state. EMT can drive metastasis in various cancer types, including NSCLC. Guang et al. [37] reported an inverse association of the EMT signature with T-cell infiltration in NSCLC. SOX2, a stemness gene, may be an invaluable therapeutic target for NSCLC [38]. The findings indicate that SOX2 contributes to anchorage-independent growth and chemoresistance through its downstream signaling mediator, AKT kinase, during the progression of NSCLC. Although most of the top 1000 differentially expressed genes in each cluster were distinct, resulting in different gene lists, the genes we identified through inferred GRNs could detect biologically meaningful functional states for NSCLC.
Table 3.
Key genes identified in three clusters in the basal cells of LUSC patients
| Cluster-1 | ZNF706,DRAP1,CDKN2A,FOS,CCND1 |
| Cluster-2 | SOX2,PLSCR1,HMGN3,ATF4,HMGA1, JUND,IRF6,EGR1,MYC,TP63,NFE2L2 |
| Cluster-3 | ATF3,PITX1,YBX3,JUN,CEBPD,ELF3,JUNB |
Figure 5.
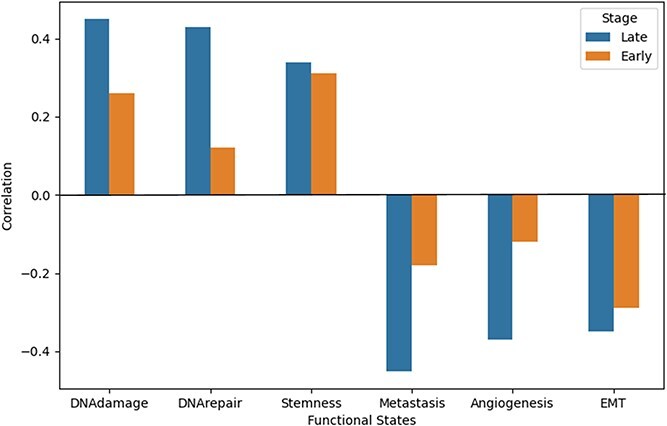
Comparison of correlations between the functional state and key genes derived from the inferred GRNs of the early- and late-stage LUSC basal cells. The functional states with  in the late stage were selected.
Discussion and conclusion
GRN inference is fundamental to studying biological processes and enables a comprehensive investigation of disease and cancer mechanisms. Despite being an active research area for over two decades, inferring GRNs from scRNA-seq data remains challenging. The complexity arises from the fact that scRNA-seq data typically contain multiple cell subpopulations. Inferring a single GRN for all subpopulations or one for each subpopulation is not optimal because the use of a single GRN for all subpopulations overlooks subpopulation heterogeneity, whereas the use of one GRN for each subpopulation disregards similarities.
In this study, we proposed the DeepGRNCS framework, which offers two major advancements. First, we leveraged gene expression data from multiple cell subpopulations to derive the network, capturing the similarities between cell subpopulations. Each subpopulation can serve as the primary input for the model, enabling the construction of a specific network. Second, we used the strategy of individually excluding regulators to investigate its effect on the target gene, ensuring that the network inference process does not rely on any prior information, such as existing interactions, gene attributes and network topology [31, 39, 40]. We benchmarked DeepGRNCS against existing single-cell GRN inference methods and cell-subpopulation-specific GRN inference methods using simulated datasets, where it demonstrated favorable performance. Furthermore, we applied DeepGRNCS to real datasets to explore tumor heterogeneity and showed the efficacy of DeepGRNCS in GRN inference from scRNA-seq data.
Our research is limited by the need to train a deep model for each gene to predict its expression profile. An increase in the number of genes leads to an increase in the runtime. Thus, we recommend focusing on genes with biological significance or differentially expressed genes. Training deep models requires a substantial amount of data, and as the number of genes increases, a greater number of cells is needed. However, with advancements in scRNA-seq technology, large-scale cell sequencing data will soon be available in the near future. We investigated the regulatory effect of each TF on a gene by eliminating TFs one by one, which might obscure direct and indirect regulatory relationships. However, many deep models lack transparency. Thus, better ways to analyze model parameters should be identified. In addition, we can consider using self-encoders as a model for inferring GRNs because self-encoders generalize well and act as unsupervised models. The application of deep learning is expanding in areas such as cell clustering [41] and scRNA-seq data interpolation [42]. Our study demonstrated that deep learning can effectively infer GRNs. Thus, combining deep learning with extensive gene expression and multi-omics data holds promising prospects for GRN inference.
Key Points
We designed a deep learning-based framework (DeepGRNCS) to infer cell subpopulation-specific GRNs from scRNA-seq data.
The framework considers intercellular heterogeneity and similarities between different cell subpopulations.
Incorporating data from additional cell subpopulations can enhance the accuracy of GRN inference.
Supplementary Material
Contributor Information
Yahui Lei, School of Computer Science and Technology, Xidian University, Xi’an 710071, Shaanxi, China.
Xiao-Tai Huang, School of Computer Science and Technology, Xidian University, Xi’an 710071, Shaanxi, China.
Xingli Guo, School of Computer Science and Technology, Xidian University, Xi’an 710071, Shaanxi, China.
Kei Hang Katie Chan, Department of Electrical Engineering, City University of Hong Kong, Hong Kong SAR, China; Department of Biomedical Sciences, City University of Hong Kong, Hong Kong SAR, China; Department of Epidemiology and Center for Global Cardiometabolic Health, Brown University, Providence, RI, United States.
Lin Gao, School of Computer Science and Technology, Xidian University, Xi’an 710071, Shaanxi, China.
Funding
This work is supported by funds from the National Natural Science Foundation of China (Grant Nos 62372349, 61702396, 62132015, 61873198 and U22A2037) and the Fundamental Research Funds for the Central Universities (ZYTS23208).
Data availability
The simulated datasets used in this study were generated from JEGN [20] and BoolODE [27] algorithms. The scRNA-seq datasets of NSCLC patients are available at http://lungcancer.chenlulab.com.
Code availability
Source codes are available at https://github.com/Nastume777/DeepGRNCS.
References
- 1. Specht AT, Li J. LEAP: constructing gene co-expression networks for single-cell RNA-sequencing data using pseudotime ordering. Bioinformatics 2017;33:764–6. 10.1093/bioinformatics/btw729. [DOI] [PMC free article] [PubMed] [Google Scholar]
- 2. Chan TE, Stumpf MPH, Babtie AC. Gene regulatory network inference from single-cell data using multivariate information measures. Cell Syst 2017;5:251–267.e3. 10.1016/j.cels.2017.08.014. [DOI] [PMC free article] [PubMed] [Google Scholar]
- 3. Qiu X, Rahimzamani A, Wang L. et al.. Inferring causal gene regulatory networks from coupled single-cell expression dynamics using scribe. Cell Syst 2020;10:265–274.e11. 10.1016/j.cels.2020.02.003. [DOI] [PMC free article] [PubMed] [Google Scholar]
- 4. Sanchez-Castillo M, Blanco D, Tienda-Luna IM. et al.. A bayesianBayesian framework for the inference of gene regulatory networks from time and pseudo-time series data. Bioinformatics 2018;34:964–70. 10.1093/bioinformatics/btx605. [DOI] [PubMed] [Google Scholar]
- 5. Sekula M, Gaskins J, Datta S. A sparse bayesianBayesian factor model for the construction of gene co-expression networks from single-cellbayesian RNA sequencing count data. BMC Bioinf 2020;21:1–19. 10.1186/s12859-020-03707-y. [DOI] [PMC free article] [PubMed] [Google Scholar]
- 6. Woodhouse S, Piterman N, Wintersteiger CM. et al.. Scns: a graphical tool for reconstructing executable regulatory networks from single-cell genomic data. BMC Syst Biol 2018;12:1–7. [DOI] [PMC free article] [PubMed] [Google Scholar]
- 7. Malekpour SA, Alizad-Rahvar AR, Sadeghi M. Logicnet: probabilistic continuous logics in reconstructing gene regulatory networks. BMC Bioinf 2020;21:318. [DOI] [PMC free article] [PubMed] [Google Scholar]
- 8. Huynh-Thu VA, Irrthum A, Wehenkel L. et al.. Inferring regulatory networks from expression data using tree-based methods. PloS One 2010;5:e12776. 10.1371/journal.pone.0012776. [DOI] [PMC free article] [PubMed] [Google Scholar]
- 9. Moerman T, Santos SA, González-Blas CB. et al.. Grnboost2 and arboreto: efficient and scalable inference of gene regulatory networks. Bioinformatics 2019;35:2159–61. 10.1093/bioinformatics/bty916. [DOI] [PubMed] [Google Scholar]
- 10. Gao NP, Minhaz Ud-Dean SM, Gandrillon O. et al.. Sincerities: inferring gene regulatory networks from time-stamped single cell transcriptional expression profiles. Bioinformatics 2018;34:258–66. [DOI] [PMC free article] [PubMed] [Google Scholar]
- 11. Matsumoto H, Kiryu H, Furusawa C. et al.. Scode: an efficient regulatory network inference algorithm from single-cell RNA-seq during differentiation. Bioinformatics 2017;33:2314–21. 10.1093/bioinformatics/btx194. [DOI] [PMC free article] [PubMed] [Google Scholar]
- 12. Aubin-Frankowski P-C, Vert J-P. Gene regulation inference from single-cell RNA-seq data with linear differential equations and velocity inference. Bioinformatics 2020;36:4774–80. 10.1093/bioinformatics/btaa576. [DOI] [PubMed] [Google Scholar]
- 13. Huynh-Thu VA, Geurts P. dyngenie3: dynamical genie3 for the inference of gene networks from time series expression data. Sci Rep 2018;8:3384. 10.1038/s41598-018-21715-0. [DOI] [PMC free article] [PubMed] [Google Scholar]
- 14. Yuan Y, Bar-Joseph Z. Deep learning for inferring gene relationships from single-cell expression data. Proc Natl Acad Sci 2019;116:27151–8. 10.1073/pnas.1911536116. [DOI] [PMC free article] [PubMed] [Google Scholar]
- 15. Shu H, Zhou J, Lian Q. et al.. Modeling gene regulatory networks using neural network architectures. Nat Comput Sci 2021;1:491–501. 10.1038/s43588-021-00099-8. [DOI] [PubMed] [Google Scholar]
- 16. Rafiei F, Zeraati H, Abbasi K. et al.. Cfssynergy: combining feature-based and similarity-based methods for drug synergy prediction. J Chem Inf Model 2024;64:2577–85. 10.1021/acs.jcim.3c01486. [DOI] [PubMed] [Google Scholar]
- 17. Dehghan A, Abbasi K, Razzaghi P. et al.. CCL-DTI: contributing the contrastive loss in drug–target interaction prediction. BMC Bioinf 2024;25:48. 10.1186/s12859-024-05671-3. [DOI] [PMC free article] [PubMed] [Google Scholar]
- 18. Grubman A, Chew G, Ouyang JF. et al.. A single-cell atlas of entorhinal cortex from individuals with alzheimer’s disease reveals cell-type-specific gene expression regulation. Nat Neurosci 2019;22:2087–97. 10.1038/s41593-019-0539-4. [DOI] [PubMed] [Google Scholar]
- 19. Castro DM, De Veaux NR, Miraldi ER. et al.. Multi-study inference of regulatory networks for more accurate models of gene regulation. PLoS Comput Biol 2019;15:e1006591. 10.1371/journal.pcbi.1006591. [DOI] [PMC free article] [PubMed] [Google Scholar]
- 20. Zhang X-F, Ou-Yang L, Yan T. et al.. A joint graphical model for inferring gene networks across multiple subpopulations and data types. IEEE Trans Cybern 2019;51:1043–55. 10.1109/TCYB.2019.2952711. [DOI] [PubMed] [Google Scholar]
- 21. Jia-Juan T, Ou-Yang L, Yan H. et al.. Joint reconstruction of multiple gene networks by simultaneously capturing inter-tumor and intra-tumor heterogeneity. Bioinformatics 2020;36:2755–62. 10.1093/bioinformatics/btaa014. [DOI] [PubMed] [Google Scholar]
- 22. Chen Y, Zhang X-F, Ou-Yang L. Inferring cancer common and specific gene networks via multi-layer joint graphical model. Comput Struct Biotechnol J 2023;21:974–90. 10.1016/j.csbj.2023.01.017. [DOI] [PMC free article] [PubMed] [Google Scholar]
- 23. Hafemeister C, Satija R. Normalization and variance stabilization of single-cell RNA-seq data using regularized negative binomial regression. Genome Biol 2019;20:296. 10.1186/s13059-019-1874-1. [DOI] [PMC free article] [PubMed] [Google Scholar]
- 24. Luo Q, Yongzhen Y, Lan X. Signet: single-cell RNA-seq-based gene regulatory network prediction using multiple-layer perceptron bagging. Brief Bioinform 2022;23:bbab547. [DOI] [PMC free article] [PubMed] [Google Scholar]
- 25. Razzaghi P, Abbasi K, Ghasemi JB. Multivariate pattern recognition by machine learning methods. In: Jahan B. Ghasemi (ed.), Machine Learning and Pattern Recognition Methods in Chemistry from Multivariate and Data Driven Modeling. Tehran, Iran: Elsevier, 2023, 47–72. [Google Scholar]
- 26. Abbaszadeh O, Azarpeyvand A, Khanteymoori A. et al.. Data-driven and knowledge-based algorithms for gene network reconstruction on high-dimensional data. IEEE/ACM Trans Comput Biol Bioinform 2020;19:1545–57. 10.1109/TCBB.2020.3034861. [DOI] [PubMed] [Google Scholar]
- 27. Pratapa A, Jalihal AP, Law JN. et al.. Benchmarking algorithms for gene regulatory network inference from single-cell transcriptomic data. Nat Methods 2020;17:147–54. 10.1038/s41592-019-0690-6. [DOI] [PMC free article] [PubMed] [Google Scholar]
- 28. Zhang L, Zhang Y, Wang C. et al.. Integrated single-cellbayesian RNA sequencing analysis reveals distinct cellular and transcriptional modules associated with survival in lung cancer. Signal Transduct Target Ther 2022;7:9. 10.1038/s41392-021-00824-9. [DOI] [PMC free article] [PubMed] [Google Scholar]
- 29. Lambert SA, Jolma A, Campitelli LF. et al.. The human transcription factors. Cell 2018;172:650–65. 10.1016/j.cell.2018.01.029. [DOI] [PubMed] [Google Scholar]
- 30. Kanehisa M, Goto S. KEGG: Kyoto Encyclopedia of Genes and Genomes. Nucleic Acids Res 2000;28:27–30. 10.1093/nar/28.1.27. [DOI] [PMC free article] [PubMed] [Google Scholar]
- 31. Chen J, Cheong CW, Lan L. et al.. DeepDRIM: a deep neural network to reconstruct cell-type-specific gene regulatory network using single-cell RNA-seq data. Brief Bioinform 2021;22:bbab325. 10.1093/bib/bbab325. [DOI] [PMC free article] [PubMed] [Google Scholar]
- 32. Enfield KSS, Marshall EA, Anderson C. et al.. Epithelial tumor suppressor ELF3 is a lineage-specific amplified oncogene in lung adenocarcinoma. Nat Commun 2019;10:5438. 10.1038/s41467-019-13295-y. [DOI] [PMC free article] [PubMed] [Google Scholar]
- 33. Cheung WKC, Zhao M, Liu Z. et al.. Control of alveolar differentiation by the lineage transcription factors gata6 and hopx inhibits lung adenocarcinoma metastasis. Cancer Cell 2013;23:725–38. 10.1016/j.ccr.2013.04.009. [DOI] [PMC free article] [PubMed] [Google Scholar]
-
34.
Sun J, Xiong Y, Jiang K. et al..
Hypoxia-sensitive long noncoding RNA CASC15 promotes lung tumorigenesis by regulating the SOX4/
 -catenin axis. J Exp Clin Cancer Res 2021;40:1–14. 10.1186/s13046-020-01806-5.
[DOI] [PMC free article] [PubMed] [Google Scholar]
-catenin axis. J Exp Clin Cancer Res 2021;40:1–14. 10.1186/s13046-020-01806-5.
[DOI] [PMC free article] [PubMed] [Google Scholar] - 35. Yuan H, Yan M, Zhang G. et al.. Cancersea: a cancer single-cell state atlas. Nucleic Acids Res 2019;47:D900–8. 10.1093/nar/gky939. [DOI] [PMC free article] [PubMed] [Google Scholar]
- 36. Manzo A, Montanino A, Carillio G. et al.. Angiogenesis inhibitors in NSCLC. Int J Mol Sci 2017;18. 10.3390/ijms18102021. [DOI] [PMC free article] [PubMed] [Google Scholar]
- 37. Chae YK, Chang S, Ko T. et al.. Epithelial-mesenchymal transition (EMT) signature is inversely associated with t-cell infiltration in non-small cell lung cancer (NSCLC). Sci Rep 2018;8. 10.1038/s41598-018-21061-1. [DOI] [PMC free article] [PubMed] [Google Scholar]
- 38. Choe C, Kim H, Min S. et al.. Sox2, a stemness gene, induces progression of NSCLC A549 cells toward anchorage-independent growth and chemoresistance to vinblastine. Onco Targets Ther 2018;11:6197–207. 10.2147/OTT.S175810. [DOI] [PMC free article] [PubMed] [Google Scholar]
- 39. Chen G, Liu Z-P. Graph attention network for link prediction of gene regulations from single-cell RNA-sequencing data. Bioinformatics 2022;38:4522–9. 10.1093/bioinformatics/btac559. [DOI] [PubMed] [Google Scholar]
- 40. Mao G, Pang Z, Zuo K. et al.. Predicting gene regulatory links from single-cell RNA-seq data using graph neural networks. Brief Bioinform 2023;24. 10.1093/bib/bbad414. [DOI] [PMC free article] [PubMed] [Google Scholar]
- 41. Liu Q, Chen S, Jiang R. et al.. Simultaneous deep generative modelling and clustering of single-cell genomic data. Nat Mach Intell 2021;3:536–44. 10.1038/s42256-021-00333-y. [DOI] [PMC free article] [PubMed] [Google Scholar]
- 42. Yungang X, Zhang Z, You L. et al.. scIGANs: single-cell RNA-seq imputation using generative adversarial networks. Nucleic Acids Res 2020;48:e85–5. [DOI] [PMC free article] [PubMed] [Google Scholar]
Associated Data
This section collects any data citations, data availability statements, or supplementary materials included in this article.
Supplementary Materials
Data Availability Statement
The simulated datasets used in this study were generated from JEGN [20] and BoolODE [27] algorithms. The scRNA-seq datasets of NSCLC patients are available at http://lungcancer.chenlulab.com.