Abstract
Background and Purpose:
Follow-up imaging of gliomas is crucial to look for residual or recurrence and to differentiate them from nontumoral tissue. Positron emission tomography (PET)-magnetic resonance imaging (MRI) is the problem-solving tool in such cases. We investigated the role of dual point contrast (DPC)-enhanced MRI to discriminate tumoral from the nontumoral tissue compared to PET-MRI taken as the gold standard.
Materials and Methods:
The institutional ethics committee approved the study, and consent was obtained from all the patients included in the study. We prospectively did immediate and 75-min delayed contrast MRI in glioma cases who came for follow-up as a part of PET-MRI study in our institute. Subtracted images were obtained using immediate and 75-min delayed contrast images. Color-coded subtracted images were compared with PET-MRI images. 75-min delayed contrast MRI and diffusion-weighted imaging (DWI) images with Gray Scale inversion were compared with PET attenuation-corrected images.
Results:
We included 23 PET MRI cases done with different radiotracers in our study. Overall, we found PET-DPC correlation in (20/20 ~ 100%) cases of enhancing tumors. In two cases (DOPA and fluorodeoxyglucose), since they were nonenhancing low-grade gliomas and the other one was melanoma with intrinsic T1 hyperintensity and the DPC technique could not be used. DWI-PET correlated in 17/19 (~89.4%) cases, and perfusion-weighted imaging (PWI)-PET dynamic susceptibility contrast (DSC)/ASL correlated in 14/18 (~77.7%) cases after cases with hemorrhage were excluded.
Conclusion:
DPC MRI showed a good correlation with PET MRI in discriminating tumoral from the nontumoral tissue. DPC MRI can act as a potential alternative to PET MRI in peripheral hospitals where PET is not available. However, the DPC technique is limited in low-grade nonenhancing gliomas.
Keywords: Brain tumors, dual point contrast magnetic resonance imaging, positron emission tomography
Introduction
Surveillance imaging plays a big role in the management of brain tumors and it is necessary to look for tumor response to treatment, pseudoprogression, radiation necrosis (RN), and recurrence. The postoperative tumor tissue bed is heterogeneous with tumoral and nontumoral components such as RN, recurrence with surrounding edema and bleeding and postoperative contrast enhancement. Tumors (tumoral areas) and areas of RN (nontumoral areas) can induce similar changes in enhancement and, hence, are difficult to differentiate. Pseudoprogression (nontumoral) is another challenge encountered following temozolomide and radiation therapy. Pseudoprogression and pseudoregression have similar contrast enhancement magnetic resonance imaging (MRI) patterns.
It is technically challenging to distinguish these areas even with advanced imaging methods such as perfusion and diffusion-weighted MRI and magnetic resonance spectroscopy (MRS).[1] The pitfall of structural and advanced MRI techniques is bleed causes signal loss, and hence, positron emission tomography (PET) has an important role in postoperative cases for this distinction between tumoral and nontumoral areas. Fluorodeoxyglucose (FDG) and amino acid PET is the gold standard to differentiate necrosis versus recurrence based on upregulation of glucose transporter (GLUT) receptor expression and amino acid metabolism. FDG can be false negative in low-grade tumors, and there is a lot of background uptake. Amino acid tracers such as methionine and fluoroethyl-L-tyrosine (FET) are good for any grade of tumor and have good tumor-to-background contrast.[2]
In this study, we used the novel imaging technique of dual point T1contrast imaging to differentiate tumoral and nontumoral foci based on the fact that the washout of contrast is different.[3] This dual point contrast (DPC) technique is a simple radiation-free, cost-effective, and safe for multiple surveillance without requiring advanced MRI or amino acid PET imaging.
Aims and objective
To identify the areas showing unique temporal enhancement characteristics on DPC-subtraction maps and label brain tumors/tumoral components from nontumoral areas
To compare the above-labeled areas – tumoral versus nontumoral group and correlate with clinical FDG and amino acid PET images.
Materials and Methods
This is a prospective study, an approved project from the local ethics committee at our institute. Written informed consent was obtained from all patients. Most of the cases were postoperative, with clinical indication to identify tumor recurrence.
We included 23 PET MRI cases in the study. Four were 18F-FDG-PET cases and the rest were amino acid PET studies with various radiotracers such as 10 were C11 methionine PET cases, 6 were 18F-FET cases, and 3 were 18F-dihydroxyphenylalanine (DOPA) PET cases.
Images were acquired using 3T Biograph mMR–magnetic resonance (MR)/PET system. MRI images were acquired simultaneously with PET using various PET tracers. The contrast media used was nonionic, either Clariscan or Gadovist, and the dose calculated was 0.1 mmoL/kg.
Dual point contrast technique
In all cases, immediate T1 contrast and 75-min delayed T1 contrast images were acquired with zero angle acquisition. All the Immediate, delayed T1 contrast and GrayScale PET images were reoriented, followed by coregistering these reoriented delayed and PET images with the Immediate T1 contrast image as a reference image using SPM12 software(Functional Imaging Laboratory, UCL Queen Square Institute of Neurology, London, UK).
Later, this coregistered delayed T1 contrast image was subtracted from the immediate T1 contrast image using FSL 6.0.2 software(Analysis group, FMRIB, Oxford, UK). These were then correlated with the subtracted images with the simultaneous MR-PET images. For correlation, subtracted images and PET were color-coded in general electronics (GE) color in MricroGL software(McCausland Center for Brain Imaging, University of South Carolina).
In addition, 75-min delayed contrast T1-weighted MRI images after doing gray scale inversion were correlated with PET-AC(attenuation corrected) images. GrayScale images and inverted GrayScale diffusion-weighted imaging (DWI) images.
As a part of advanced imaging on MR/PET as tumor protocol, DWI, dynamic susceptibility contrast (DSC) perfusion-weighted imaging (PWI)-cerebral blood volume (CBV) and arterial spin labeling (ASL) images were available in a few cases and they were also correlated.
By using the subtraction technique, the contrast is amplified between the tumoral and nontumoral areas. However, since this technique is sensitive to misregistration and motion artifact, with many artifacts in the white matter and ventricles. In this scenario, visual analysis can be done for interpretation by the fact that tumor will be bright in baseline– less bright in delayed, whereas nontumoral tissue will be bright at baseline– more bright in delayed. Hence, on subtracting baseline minus delayed imaging, the tumor tissue will have a positive contrast, and nontumoral will have a negative contrast. We suggest baseline minus delayed subtraction so that the tumor tissue will have a positive contrast similar to the PET tumor uptake and the nontumoral part of the lesion will have a negative contrast similar to amino acid PET.
Interpretation technique
Areas of increased radioactive tracer uptake on PET images were considered tumoral tissue. Areas of absent radioactive tracer uptake were considered as non-tumoral areas.
Immediate T1 contrast images show enhancement of both tumoral and nontumoral tissues. However, on delayed T1 contrast images, the tumoral tissues wash out and RN shows pooling of contrast. If a motion artifact is noted, we use delayed T1 contrast images alone to make an inference directly.
Background radioactive tracer uptake was noted in the sulcal spaces due to pial vessels in the baseline images. In the delayed images, there was washout from the tumoral areas and from the background arteries, veins, sulcal, and pial vessels. Only the nontumoral and white matter was slightly more hyperintense on delayed images.
DWI restriction patterns are of two types, one with central restriction or no restriction. The other pattern is with peripheral restriction along the margins. The central restriction with a very low apparent diffusion coefficient (ADC) and no restriction patterns are typical of RN. Peripheral pattern indicated residual/recurrence.
Sample size
The sample size was 23 [Supplementary Table 1].
Supplementary Table 1.
Dual point contrast and positron emission tomography across different radiopharmaceuticals
| PET tracer and tumor uptake | Postoperative cases of histopathology type | Subtracted T1 contrast images matched PET uptake | 75-min delayed T1 contrast grayscale inverted images matched PET AC images | DWI | PCASL/MRS/SWI/PWI | PET report | Comments |
|---|---|---|---|---|---|---|---|
| F18-FDG-PET (n=4) | Pleomorphic xanthoastrocytoma WHO grade 2 | Match DPC-PET | Washout margin Central cystic area on wash-in | Equivocal | PCASL and PWI: Elevated perfusion along the periphery MRS: Increased choline with lipid peak, decreased NAA SWI: Hemosiderotic foci + PWI-PET match | Uptake in margins (though low grade) | Postbiopsy DPC-PET match in the margin Cystic area DWI-PET match |
| Dysembryoplastic neuroepithelial tumor | Match DPC-PET | No enhancement | Free diffusion | PCASL and PWI: No elevated perfusion MRS: NA SWI: Calcific foci + PWI-PET match | No uptake | Postoperative cavity only DPC-DWI-PET match | |
| Metastases from lung | Match DPC-PET | Washout margin Central necrosis no wash in | Margin restriction Centre free diffusion | PCASL and PWI: Elevated perfusion along the periphery MRS: Increased choline with lipid-lactate peak, decreased NAA SWI: NA PWI-PET match | Margin uptake Centre no uptake | Postbiopsy Margins DPC-PET-DWI match Central necrosis DPC-PET-DWI match | |
| Metastases from neuroendocrine/unknown primary | Match DPC-PET | Subcentimetric foci wash out Postoperative cavity nonenhancing | Subcentimetric foci restriction Postopeartive cavity-free diffusion | PCASL: No elevated perfusion MRS and PWI: NA SWI: Hemorrhagic areas in postoperative cavity + PWI-PET mismatch | Subcentimetric foci uptake Postoperative cavity no uptake | Subcentimetric foci are challenge the DPC-PET-DWI match Postoperative cavity DPC-PET-DWI match | |
| C11-methionine PET (n=10) | GBM IDH mutant WHO grade 4 | Match DPC-PET | Anterior: Radiation necrosis with washin Posterior: Postoperative margin washout with residual lesion | Anterior lesion: No Postoperative site margin mild restriction | PCASL and PWI: No elevated perfusion MRS: NA SWI: Hemosiderotic rim along the postoperative cavity + PWI-PET mismatch | Anterior lesion with no uptake Posterior lesion uptake | Match DPC-PET-DWI |
| GBM IDH negative, WHO grade 4 | Match DPC-PET | Right frontal postoperative cavity - slow wash in Corpus callosum washout tumor | Postoperative cavity-free diffusion Corpus callosum restricted | PCASL and PWI: Equivocal due to postoperative changes and hemorrhage MRS: Elevated choline and decreased NAA with small lipid-lactate peak SWI: Hemosiderosis along the right frontal postoperative cavity and genu of corpus callosum PWI-PET mismatch | Postoperative cavity no up take Corpus callosum: Uptake | Match DPC-PET-DWI | |
| GBM, IDH wild type, WHO grade 4, unmethylated MGMT promoter status | Match DPC-PET | Left parietal postoperative cavity margins washout + Anterior lesion: Recurrence washout++ | Left parietal margins mild restriction Anterior lesion restriction margin++ | PCASL and PWI: No elevated perfusion MRS: Elevated choline and decreased NAA with lipid-lactate peak SWI: Hemosiderosis along the left parietal postoperative cavity. Punctate foci of hemorrhage in the wall of the anterior lesion PWI-PET mismatch | Left parietal margin mild uptake Anterior lesion uptake++ | Match DPC-PET-DWI | |
| Grade 4 GBM, IDH mutant, WHO grade 4 | Match DPC-PET | High parietal postoperative cavity margin wash out Left of cavity - washin of contrast Ventricular level washout in the margin | High parietal postoperative cavity margin? restriction?? artifacts Centre of cavity-free diffusion Central diffusion restriction indicating acute radiation necrosis, margins are free diffusion | PCASL and PWI: Increase in perfusion along superior and posterior aspects of left frontal postoperative cavity PWI: Patchy areas of elevated perfusion in the left gangliothalamic region MRS: NA SWI: Hemorrhage and air foci within the parietal postoperative cavity. Punctate foci of hemorrhage in the margins of the lesion at the ventricular level PWI-PET match | Uptake in the peripheral margin No uptake | Match DPC-PET but not DWI tumor area DPC - DWI not match Postoperative cavity Mismatch of DPC-PET match PET-DWI Radiation necrosis | |
| Anaplastic astrocytoma, WHO Grade 3 NOS IDH negative, recent biopsy shows radiation-induced changes with few neoplastic cells | Match DPC-PET | Anterior lesion: Central washin and peripheral washout Posterior lesion: washout | Central DWI restriction and margins are one area of restriction Margins restriction | PCASL: Patchy areas of mild elevated perfusion in the anterior lesion PWI: Patchy areas of mild elevated perfusion in both lesions MRS: Elevated choline and decreased NAA with lipid-lactate peak SWI: Punctate hemorrhagic foci within the margins of lesions PWI-PET match | Margins show uptake Margins uptake | Match DPC-PET recurrence Match DPC-PET-DWI | |
| Oligodendroglioma, WHO grade 3, postradiotherapy and temozolamide, recent biopsy showed radiation necrosis with few tumor fragments | Match DPC-PET | Corpus callosum and left frontal and high parietal - margins had washout | Corpus callosum and left frontal, high parietal central restriction - acute necrosis | PCASL: NA PWI: No elevated perfusion MRS: NA SWI: Punctate hemorrhagic foci within the margins of lesions PWI-PET mismatch | Corpus callosum and left frontal, high parietal Margins are showing uptake | Match DPC-PET DWI - radiation necrosis | |
| Anaplastic oligodendroglioma Grade 3 IDH positive p53 negative ATRX retained | Match DPC-PET | Wash in the left and wash out in the margin | Areas of central restriction | PCASL: NA PWI: Small area of slightly increased perfusion in the left side of the corpus callosum/forceps minor/anterior cingulate region MRS: NA SWI: Punctate hemorrhagic foci within the margins of lesions PWI-PET match | Margins uptake | DPC-PET match in margins DPC-DWI shows left radiation necrosis and microbleeds on SWI | |
| Oligodendroglioma IDH positive, Grade 2 | Mismatch DPC-PET | Very mild enhancement and wash out in margin and postoperative cavity shows no wash in | Low grade and hence no restriction | PCASL and PWI: Not elevated MRS: NA SWI: Hemosiderotic rim along the postoperative cavity PWI-PET mismatch | Margins show uptake | PET uptake>DPC in margins | |
| Oligodendroglioma, Grade 2 | Match DPC-PET | Corpus callosum Margin showing washout Left parietal at postoperative site margins wash out | Central restriction Mild areas of restriction | PCASL: NA PWI: Focal specs of elevated perfusion in the left thalamus MRS: NA SWI: Hemosiderotic rim along the postoperative cavity PWI-PET match | Margins have no uptake Mild uptake | PET margins are more than DPC margins DPC-DWI mismatch DPC-PET-DWI match | |
| Diffuse astrocytoma IDH mutant, Grade 2 | Match DPC-PET | Postoperative cavity no enhancement/washin/washout | Free diffusion | PCASL and PWI: No elevated perfusion MRS: NA SWI: Hemosiderotic rim + PWI-PET match | No uptake | DPC-PET-DWI match Postoperative cavity | |
| 18-FET-PET (n=6) | Glioblastoma IDH Wild, Grade 4 | Match DPC-PET | Postoperative cavity - contrast fill in margins - wash out | Free diffusion | PCASL and PWI: Elevated MRS: Elevated choline and decreased NAA with lipid-lactate peak SWI: Hemosiderotic rim along the postoperative cavity PWI-PET match | Margins uptake | DWI free diffusion Though Grade 4 DPC-PET matched |
| Anaplastic astrocytoma WHO grade III, IDH mutant | Match DPC-PET | Postoperative cavity no wash in or washout Periventricular lesion washout | Free diffusion | PCASL: Not elevated PWI: Mild Elevated in periventricular lesion MRS: Mildly Elevated choline peak SWI: Punctate hemorrhagic foci PWI-PET match | Periventricular lesion uptake | PET - DPC - DWI match Postoperative cavity PET - DPC match in the area of recurrence | |
| Astrocytoma, IDH mutant, CNS WHO grade 3 Later biopsy extensive radiation-induced necrosis in the left parietal region | Match DPC-PET | Margins wash out | Margin restriction | PCASL and PWI: Focus of elevated perfusion along the posterior margin MRS: NA SWI: Hemorrhagic foci along the margins of lesion PWI-PET match | Margins uptake | DPC-PET-DWI match But PET amplifies the changes | |
| Grade 3 Anaplastic astrocytoma NOS, IDH 1 (R132H) Negative | Match DPC-PET | Postoperative cavity with washout in margins | Margins restriction | PCASL and PWI: NA MRS: NA SWI: Hemorrhagic foci along the margins of the lesion | Margins uptake | DPC-PET-DWI match | |
| Melanoma | Match DPC-PET | T1 hyperintense and hence could not comment | Residual focus restricted DWI | PCASL and PWI: NA MRS: NA SWI: Hemorrhagic foci + | Residual lesion uptake | DPC-DWI match in T1 hyperintense lesion | |
| Anaplastic astrocytoma, IDH mutant, WHO Grade-III, Post Radiotherapy | Match DPC-PET | Margins washout | Free diffusion | PCASL: NA PWI: Not elevated MRS: NA SWI: Few hemorrhagic foci + PWI-PET mismatch | Margins uptake | DPC-PET match | |
| F18-DOPA -PET (n=3) | Glioblastoma IDH wild Grade 4 | Match DPC-PET | Tumor is showing washout Postoperative dural collection cavity wash in | Free diffusion Postoperative collection restricted diffusion | PCASL and PWI: Foci of elevated perfusion MRS: NA SWI: Hemorrhagic foci + PWI-PET match | Tumor showing uptake Postoperative collection no uptake | DPC-PET match DWI affected due to extensive blood |
| Anaplastic Oligodendroglioma NOS (IDH1 mutant) WHO Grade III | Match DPC-PET Subtracted images not available | Tumor subcentimetric? Washout Central washin in the cavity | Tumor subcentimetric? Restriction Central restriction | PCASL: Motion + PWI: Foci of elevated perfusion along the margins MRS: NA SWI: Few Hemorrhagic foci + in margins PWI-PET match | Tumor subcentimetric and shows uptake Central tumor no uptake | Subcentimetric low grade Recurrence is a challenge for DPC and DWI | |
| Diffuse astrocytoma, NOS, IDH1 negative, WHO grade 2, pontomedullary region | Mismatch DPC-PET | Nonenhancing | Restriction | PCASL and PWI: Foci of elevated perfusion within MRS: NA SWI: No blooming PWI-PET match | Tumor uptake | DWI-PET match DPC-PET mismatch due to nonenhancing tumor |
DPC: Dual point contrast, DWI: Diffusion-weighted imaging, PET: Positron emission tomography, AC: Attenuation-corrected, FDG: Fluorodeoxyglucose, PWI: Perfusion-weighted imaging, SWI: Susceptibility-weighted imaging, MRI: Magnetic resonance imaging, MRS: Magnetic resonance spectroscopy, NA: Not available, IDH: Isocitrate dehydrogenase, WHO: World Health Organization, NAA: N-acetylaspartate, GBM: Glioblastoma multiforme, DOPA: Dopamine, CNS: Central nervous system, FET: Fluoroethyl-L-tyrosine, PCASL: Pseudo-continuous arterial spin labeling, NOS: Not otherwise specified, ATRX: Alpha thalassemia/mental retardation syndrome X-linked, MGMT: O[6]-methylguanine-DNA methyltransferase
Inclusion criteria
Cases of postoperative and postradiotherapy brain tumor
Age range was 15–80 years.
Exclusion criteria
Pregnant patients and if no consent from patient’s caretaker were excluded.
Study procedure
After the patient meets the inclusion criteria, informed consent will be taken. Postcontrast three-dimensional (3D) gradient T1 images will be obtained as part of a clinical MRI study. Contrast injection time will be noted down. Patients will be asked to return for a short scan 75 min after contrast injection. No additional contrast will be administered. After 75 min of contrast injection, another set of 3D gradient T1 images will be acquired. DPC subtraction maps will be obtained, where the 3D gradient T1 of the first series postcontrast was subtracted from the 3D gradient T1 of the later series.
Rationale
These maps will depict the spatial distribution of contrast accumulation/clearance in the tissue, blood vessels, and CSF. In the case of normal blood vessels, due to clearance of contrast agent from the blood system, there will be no increase in contrast accumulation in the late scans; therefore, the subtraction maps will show negative values. The signal decay of the blood vessels is faster than that of the tissue (where the signal is averaged over the tissue and microvasculature); therefore, blood vessels have lower values than tissue. In the case of contrast accumulation, i.e., regions where contrast clearance is slower than contrast accumulation, the maps will show positive values.
Outcome measures
Primary outcome
Differentiate between tumoral and nontumoral areas in primary brain tumors and in posttreatment cases.
Secondary outcome
Standardizing this MRI biomarker with amino acid PET and histopathology helps in better planning of biopsy sites with no additional need for invasive diagnostic biopsy/PET scans. DPC is a simple cost-effective, and radiation-free technique that could be easily embedded in routine clinical protocols.
Data analysis
Data acquired were entered into a Microsoft Excel sheet. Postcontrast dual point subtraction maps were generated using FSL 6.0.2 software. Patient data were segregated into two groups – nontumoral group and the tumoral group. Appropriate statistical tests were used to analyze the power of the study and to correlate postcontrast dual point subtraction maps with clinical PET MRI and/or histopathological results.
Results
Magnetic resonance/positron emission tomography (18F-fluorodeoxyglucose)
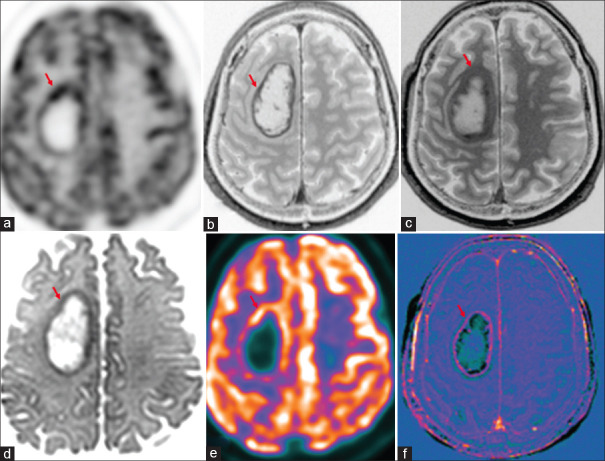
There were four cases in total with biopsy findings, and two were benign lesions with seizure as a clinical symptom (case of pleomorphic xanthoastrocytoma [PXA] and dysembryoplastic neuroepithelial tumor). Two cases were cerebral metastases [Figure 1], with primary lung malignancy in one and unknown primary worked up with FDG PET whole-body study. DPC-PET correlation was noted in (4/4), whereas DWI/PWI-PET correlation in (3/4), with one case of PXA showing free diffusion and 1 case of PWI being uninterpretable due to hemorrhage.
Figure 1.
Case of cerebral metastases in primary lung malignancy shows increased marginal uptake in right frontal lobe lesion (red arrow) in 18F-fluorodeoxyglucose(FDG) PET-AC(attenuation corrected) (a) and color-coded positron emission tomography images (e), peripheral enhancement (b) and washout in 75-min delayed postcontrast (c), marginal diffusion restriction (d) and marginal enhancement in subtracted T1 contrast image (f)
Amino acid positron emission tomography
Magnetic resonance/positron emission tomography (C11 methionine)
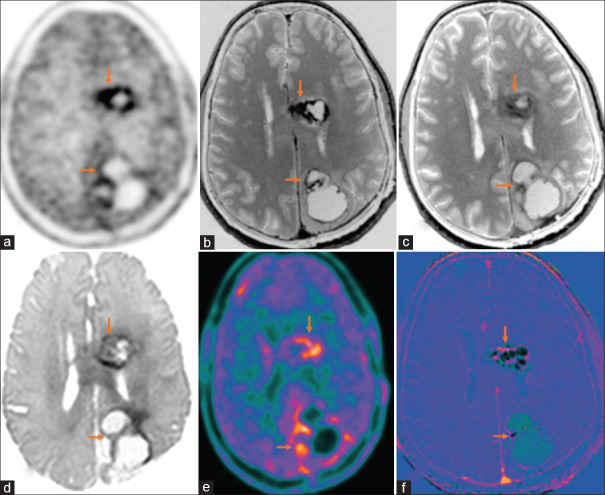
There were 10 cases for differentiation of RN or recurrence. On PET, they were reported as residual/recurrence (n = 9, [Figure 2]) and RN (n = 1). DPC-DWI-PET correlation was noted in diagnosing recurrence/RN (n = 9/10). The pitfall was in one case of low-grade nonenhancing glioma, where PET showed uptake. Cerebral blood flow (CBF) maps of perfusion images PWI/ASL-PET correlation was noted in (5/10) cases only, with the pitfall for low sensitivity being the low-grade nature of the lesion, postoperative changes, motion artifacts, and areas of hemorrhage.
Figure 2.
Operated case of glioblastoma multiforme, isocitrate dehydrogenase (IDH) wild type with recurrence (orange arrows), shows increased marginal uptake around the postoperative cavity in left frontal and occipital lobes in C11-methionine PET-AC (attenuation corrected) (a) and color-coded positron emission tomography images (e), peripheral enhancement (b) and washout in 75-min delayed T1 contrast (c), marginal diffusion restriction (d), around postoperative cavity with peripheral enhancement seen in subtracted T1 contrast image (f)
Magnetic resonance/positron emission tomography (18F-fluoroethyl-L-tyrosine)
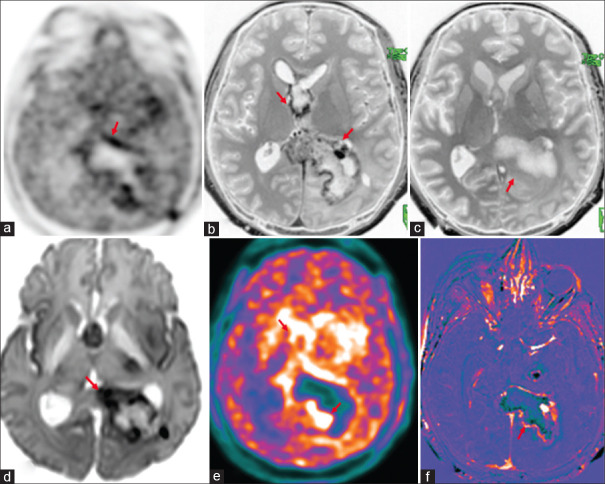
There were six cases in total: one case of cerebellar melanoma and five cases of glioma. In glioma, two had only recurrence and three had a recurrence in the background of RN [Figure 3] and DPC-PET correlation was noted in (5/5). DWI/PWI-PET correlation was noted in (3/6) only as others were low-grade lesions or had hemorrhage.
Figure 3.
Operated case of anaplastic astrocytoma (World Health Organization grade III, isocitrate dehydrogenase1 (IDH1) negative, not otherwise specified (NOS) with recurrence (red arrows) shows peripheral rim of hypermetabolic lesions (18F-fluoroethyl-L-tyrosine positron emission tomography AC (a) and color-coded positron emission tomography images (e) in septum pellucidum, splenium of the corpus callosum, left parieto-occipital lobes. There is peripheral rim enhancement (b) with washout in 75 min delayed contrast images (c), corresponding marginal diffusion restriction (d) and contrast rim enhancement in the subtracted T1 contrast images (f)
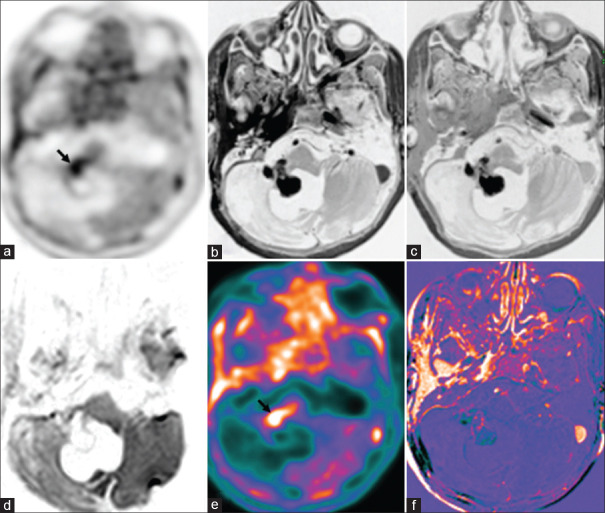
One case of melanoma could not be commented on DPC due to the intrinsic T1 hyperintensity of the lesion. However, DWI-PET correlation was noted, and hence, in such cases, a combination of DWI and DPC may increase the sensitivity.
Magnetic resonance/positron emission tomography (18F-fluoro dopamine)
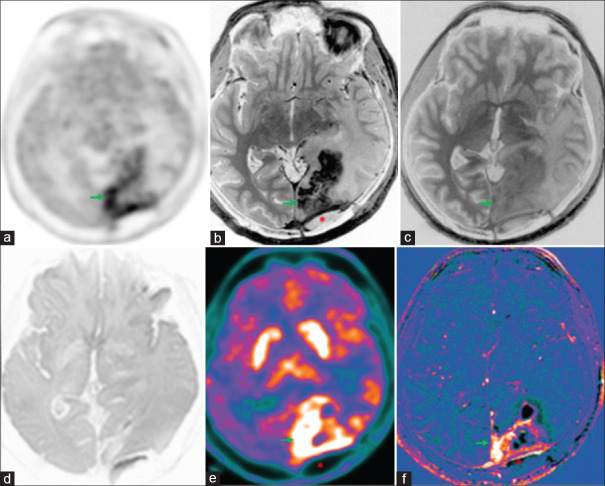
There were three cases of glioma, with two cases having recurrence in the background of RN [Figure 4] on PET. DPC/DWI-PET correlation was noted in two cases only since in one case, the tumor was nonenhancing and DPC could not be done, and one case had bleed to comment on DWI. PWI-PET match was noted in all three cases.
Figure 4.
Operated case of glioblastoma multiforme, isocitrate dehydrogenase (IDH) wild type with recurrence (green arrows), shows uptake in the left occipital lobe in 18F-dihydroxyphenylalanine(DOPA) PET-AC(attenuation corrected) (a) and color-coded positron emission tomography images (e), enhancement (b) and washout in 75-min delayed T1 contrast (c), enhancement in subtracted T1 contrast image (f), no diffusion restriction (d) due to areas of hemorrhage. Adjacent postoperative collection (asterisk) with no metabolic uptake and no enhancement seen in the left occipital region
Magnetic resonance/positron emission tomography–advanced imaging (diffusion-weighted imaging/perfusion-weighted imaging)
DWI-PET correlated in (17/19 ~89.47%) after cases with hemorrhage were excluded. PWI(DSC/ASL)-PET correlated in (14/18~77.77%) cases after excluding cases with hemorrhage
In our previous study, FDG and DWI had a good correlation and a combination of DPC and DWI may have high specificity and sensitivity to differentiate tumor tissue similar to PET.[4]
Caution should be applied in the interpretation of DWI to decrease the false positivity in conditions such as central diffusion restriction, as it represents acute RN.
Summary
Overall, we found PET-DPC correlation [Table 1] in (20/20~100%) cases of enhancing tumors. In 2 cases (DOPA and FDG), since they were nonenhancing low-grade gliomas and the other one was melanoma with intrinsic T1 hyperintensity, and DPC technique could not be used.
Table 1.
Dual point contrast and positron emission tomography across different tumor histopathological types
| Clinical reporting on PET | Subtracted T1 contrast images matched PET uptake | 75-min delayed T1 contrast grayscale inverted images matched PET AC images | DWI grayscale inverted images matched PET AC images | Comments |
|---|---|---|---|---|
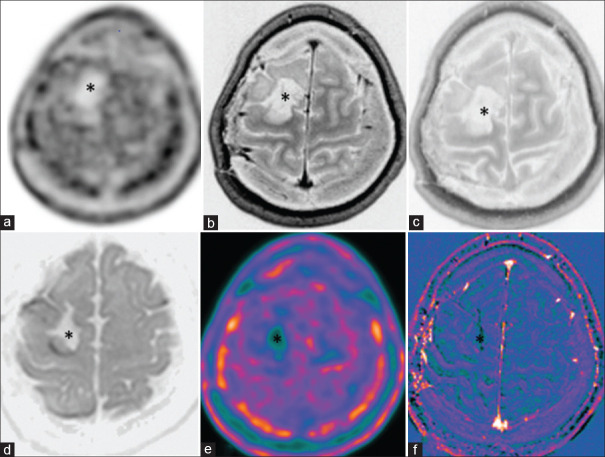
| Radiation necrosis without recurrence [Figure 5] | Matched | Matched | Matched | DWI and Del-CE can be surrogate markers for FDG and amino acid PET in this scenario |
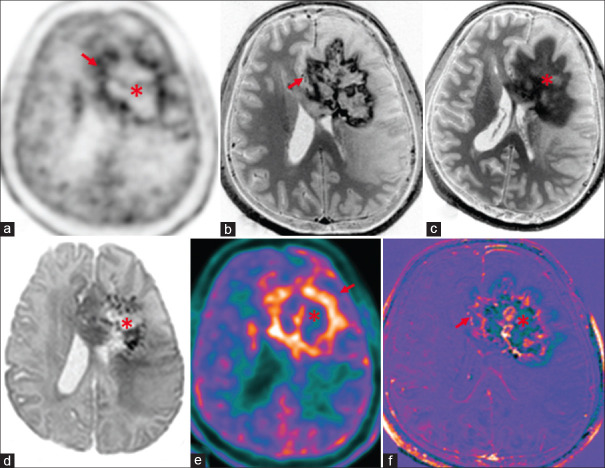
| High-grade glioma - with recurrence [Figure 6] | Matched | Matched | Matched | DWI and Del-CE can be surrogate markers for FDG and amino acid PET in this scenario |
| Low grade - enhancing glioma [Figure 7] | Matched | Matched | Mismatched | FDG and DWI matched as both show less uptake and signal in this scenario DWI did not correlate with amino acid PET in this scenario amino acid PET is sensitive irrespective of tumor grade unlike DWI Del-CE was noted in tumor uptake area of both FDG and amino acid PET Del-CE can be a marker for amino acid PET also |
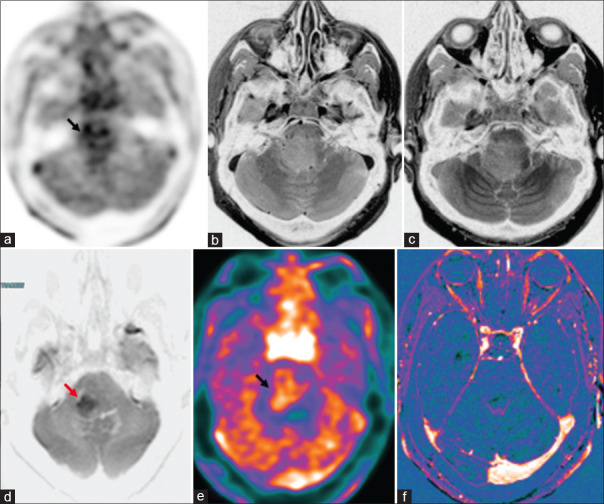
| Low grade - nonenhancing glioma [Figure 8] | Mismatched | Mismatched | Mismatched | Both DWI and Del-CE did not correlate with amino acid PET in this scenario |
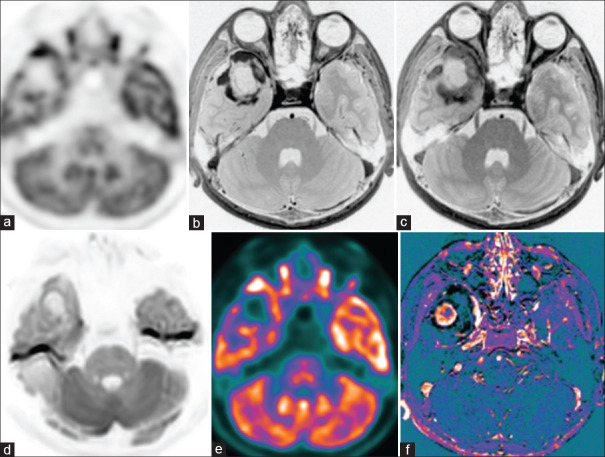
| Low-grade melanoma [Figure 9] | Matched | Matched | Mismatched | DWI no signal but Del-CE and PET showed uptake as lesion was T1 hyperintense, and both FDG and amino acid PET uptake in this scenario |
DWI: Diffusion-weighted imaging, PET: Positron emission tomography, AC: Attenuation-corrected, FDG: Fluorodeoxyglucose, Del-CE: Del-Contrast enhanced
Figure 5.
Case of diffuse astrocytoma, World Health Organization grade II, status post (s/p) surgical resection shows postoperative cavity with no recurrence (asterisk). There is no diffusion-weighted imaging restriction (d), no enhancing lesion on immediate, 75 min delayed and subtracted contrast images (b, c and f) and no metabolic uptake on C11-methionine PET-AC(attenuation corrected) (a) and color-coded positron emission tomography (e)
Figure 6.
Case of anaplastic Oligodendroglioma (ODG), Isocitrate dehydrogenase (IDH) mutant, 1p/19q co-deleted, World Health Organization grade III, postoperative and postchemoradiotherapy with radiation necrosis (asterisk) and recurrence (red arrows) along the periphery. There is peripheral rim enhancement (b) with progressive contrast filling in seen on 75-min delayed contrast images (c) and central areas of diffusion restriction (d) in the left frontal lobe and genu of corpus callosum consistent with radiation necrosis. There is central ametabolism and peripheral rim of hypermetabolism seen on C11-methionine PET-AC (attenuation corrected) (a) and color-coded positron emission tomography images (e) and peripheral rim of enhancement in subtracted T1 contrast images (f) suggestive of recurrence with central necrosis
Figure 7.
Case of pleomorphic xanthoastrocytoma shows a solid cystic lesion in the right anterior temporal lobe with peripheral rim of enhancement (b) and incomplete washout in 75-min delayed contrast image (c) and no diffusion restriction (d). Focal peripheral hypermetabolism seen in the anterior aspect of the lesion on 18F-fluorodeoxyglucose(FDG) PET-AC(attenuation corrected) (a) and color-coded positron emission tomography images (e) with peripheral enhancement in subtracted T1 contrast images (f)
Figure 8.
Case of diffuse astrocytoma, not otherwise specified (NOS), isocitrate dehydrogenase1 (IDH1) negative, World Health Organization grade 2, Ponto medullary region, postradiotherapy. There are patchy hypermetabolic areas (black arrow) in the pons on 18F-dihydroxyphenylalanine(DOPA) PET-AC(attenuation corrected) (a) and color-coded positron emission tomography images (e) with few areas of diffusion restriction (d: red arrow) and no enhancement in immediate (b) and 75-min delayed contrast images (c) and subtracted T1 contrast images (f)
Figure 9.
Case of cerebellar melanoma, postoperative and postradiotherapy with residual lesion shows focal hypermetabolic lesion (black arrow) in the right middle cerebellar peduncle on 18F-fluorodeoxyglucose(FDG) PET-AC(attenuation corrected) (a) and color-coded positron emission tomography images (e) with patchy enhancement on subtracted T1 contrast (f) and no diffusion restriction (d). Immediate contrast (b) and 75-min delayed contrast images (c) are not helpful due to the intrinsic hyperintense nature of the melanoma
DPC inherently had a good correlation with PET in enhancing lesions and, when combined with DWI and PWI, had a sensitivity equal to that of FDG/amino acid PET. Hence combined advanced MRI with DPC imaging has the potential to act as a surrogate for PET.
Pitfall of positron emission tomography
Zone will be beyond enhancing margins with spillover effect causing wrong tumor volume estimation.[5] FDG can have nonspecific uptake in acute inflammation, demyelination, postoperative changes and abscess and MR/PET is a better technique than stand-alone PET or MRI in such conditions.
Discussion
RN is the common posttreatment effect seen in brain tumors, usually noted from 2 to 32 months after therapy with 85% of cases occurring within the first 2 years.[6]
RN can be due to radiation damage to blood vessels and endothelial cells and radiation damage to glial cells.[7] Recurrence alone or tumors in the background of the RN are known to be present twice as likely as pure RN. Pure RN is very unlikely to be seen as a new abnormality starting 3 years after completion of radiotherapy. Both tumoral tissue and RN can co-exist in the first 2–3 years.
Progressive confluent nonenhancing signal abnormality in the white matter and periventricular enhancing foci away from the postoperative resection cavity within the radiation planning field following radio and chemotherapy are likely to be posttreatment effects. There is always a diagnostic dilemma with conventional MRI in the differentiation of tumor and RN as there is a high degree of overlap of imaging findings.
Swiss cheese” or “spreading wavefront” enhancement and septum pellucidum involvement are indicators of RN.[8] Central diffusion restriction in new ring-enhancing lesions following chemoradiotherapy favors necrosis over the recurrence.[9,10] Enhancing lesions with restricted diffusion and very low ADC values favor recurrence over the RN. ADC values are high in RNs due to increased water content and less cellularity within the necrosis. In a study done by Borghei-Razavi et al. ADC >1.5 × 10⁻³ mm2/s within the lesion predicted significant RN on pathologic evaluation (P < 0.05).[11] There will be facilitated diffusion in the low-grade tumors due to low tumoral cellularity.
MRS holds promise in differentiating RN from tumoral recurrence. Significantly high choline- N-Acetylaspartate (NAA) and choline–creatine ratios are seen in tumor recurrence. A high lipid lactate peak with reduced other metabolites points toward the RN.[12]
Elevated relative CBV due to high intratumoral vascularity and low peak signal intensity recovery due to leakiness of intratumoral capillaries on DSC perfusion MRI favor recurrence over RN. DSC-derived CBV is the most accurate perfusion parameter in differentiating recurrence and RN. DSC and DCE-derived parameters reflecting the blood volume in an enhancing lesion are more accurate than the DCE-derived parameter k-trans.[13,14]
Advanced MRI using DWI & DSC-PWI can identify high-grade gliomas and can be a surrogate for 18F-FDG PET. DWI/PWI is contraindicated in cases of bleed, and in such cases, DCE-PWI, ASL, and FDG can be done. However, FDG has its pitfalls, as in low-grade lesions, clear-cell tumors and can be positive in all grades of meningioma, acute demyelination, and postoperative collections.
Amino acid PET is indicated in such conditions to overcome these pitfalls, but these tracers require a cyclotron facility along with PET. Therefore, we did this study to check the role of the DPC technique and correlate it with DWI, FDG, and amino acid PET in this simultaneous MR/PET study.
With the present focus on the genetics of tumor, there are subsets, for example, high-grade lesions who do not show contrast enhancement, or low grade with increased perfusion on ASL, etc., MRS shows the metabolic map accurately but the values are region of interest (ROI) dependent and is hence operator dependent. Hence, in an MR/PET tumor workup, when all these various parameters are correlated, it is possible to identify these subsets.
There are studies of dual point using FDG PET to differentiate tumor and they suggest that an increase in uptake in a delayed scan indicates tumor. A paradox is noted with respect to this between an MRI contrast agent and PET radiotracer, and it may be due to the difference in the compartment modeling of these two agents. MRI contrast involves a three-compartment model[15] of artery capillary and vein, whereas PET tracer involves a five-compartment model[16] where the tracer gets converted into another metabolite but is still tagged to the radiolabel such as 18F or C11. DPC is similar to a DCE or DSC perfusion with a four-compartment model involving K-trans, etc., but much simpler. A tumor tissue has early washout of contrast whereas the PET radiotracer has increased uptake due to the upregulation of GLUT receptor and amino acid metabolism and hence the paradox. To adjust for this contradiction, the subtraction was between baseline and delayed; hence, similar similar-looking images were obtained with tumor tissue showing a positive contrast.
Blood–brain barrier disruption happens in both tumor and nontumoral areas in a postopertative case and hence shows enhancement in the initial scan. There is a lag in the washout of contrast in the nontumor tissue and there is amplification in the tumoral and nontumoral tissue contrast. Papers on PWI compartment modeling recommend using K-trans, and permeability imaging for an objective assessment, but these techniques are very labor intensive. DPC-MRI technique is simple and can be applied in places where advanced MRI and PET facilities are not available.
Even DPC imaging is routinely used in cardiac imaging and has become the gold standard for the identification of myocardial necrosis, assessment of postacute myocardial infarction patients, and viability before revascularization and to predict the functional recovery after coronary artery revascularization therapies.[17]
DPC enhancement can be indirect indicator of the amount of intratumoral microvascularity. DPC imaging can be used to detect intratumoral necrosis based on the fact of reduced neovascularity in the necrotic tissue.[18]
In our study, DPC-subtracted maps showed an overall good correlation with PET color-coded maps [Supplementary Figure 1 (253KB, tif) ]. Our study is the first of its kind in the neuroimaging literature. However, low sample size and heterogeneity of the sample volume are the study limitations.
An unavoidable drawback of DPC imaging is the requirement to wait for 1 h after contrast injection. Another limitation is in the evaluation of nonenhancing low-grade tumors.
However, the DPC technique can be a new paradigm in neurooncology by providing efficient differentiation between tumor/nontumor tissues by adding a short T1-MRI scan 1 h scan postcontrast injection which may be acquired on any MRI system, providing high resolution maps with minimal sensitivity to susceptibility artifacts.
We not only recommend this technique to be added in the tumor protocol but to increase the yield of ROI-based techniques such as PWI and MRS by adding DPC, the tumor foci can be placed as ROI for analysis of perfusion and metabolic changes.
There is scope for improvement in this MR/PET study by including dual point PET along with DPC enhancement, and correlations may be helpful to understand the same.
In our study, we noted that the FDG uptake was restricted to the enhancing tissue margin, whereas the amino acid PET uptake extends beyond enhancing tumor margin in the normal parenchyma in glioma, similar to that shown by fluorescein studies. The DPC study too showed increase in the volume of the tumor margins over time, though the intensity reduced. This study leaves a further scope to correlate the findings of MR/PET with histopaths. Since none of our patients underwent resurgery at the time of this paper, this correlation is unavailable.
Conclusion
DPC imaging has the potential to be a good biomarker similar to FDG and amino acid PET. DPC and subtracted T1 contrast images, along with routine MR sequences, can be done in peripheral centers where is PET is not available to differentiate recurrence/residual lesions from posttreatment changes and can be a novel alternative technique to PET imaging. This technique has pitfalls, especially in low-grade and nonenhancing tumors.
Financial support and sponsorship
DST Methionine project.
Conflicts of interest
There are no conflicts of interest.
Subtracted and positron emission tomography images with subtracted mask for different radio-tracers. (a) Fluorodeoxyglucose radiotracer with subtracted contrast and positron emission tomography image and tumor mask of subtracted image overlapping on positron emission tomography image, (b) C11-methionine radiotracer with subtracted contrast and positron emission tomography image and tumor mask of subtracted image overlapping on positron emission tomography image, (c) Fluoroethyl-L-tyrosine radiotracer with subtracted and positron emission tomography image, (d) Dihydroxyphenylalanine (DOPA) radiotracer with subtracted contrast and positron emission tomography image and tumor mask of subtracted image overlapping on positron emission tomography image. PET: Positron emission tomography
Acknowledgments
The authors thank our patients and their families for participating in this important study. We thank Prof. Sandhya Mangalore for many productive discussions and we acknowledged the financial assistance from the Science and Engineering Research Board (SERB-CRG/2018/002600) for 11C-methionine PET.
References
- 1.Ricci PE, Karis JP, Heiserman JE, Fram EK, Bice AN, Drayer BP. Differentiating recurrent tumor from radiation necrosis: Time for re-evaluation of positron emission tomography? AJNR Am J Neuroradiol. 1998;19:407–13. [PMC free article] [PubMed] [Google Scholar]
- 2.Li H, Deng L, Bai HX, Sun J, Cao Y, Tao Y, et al. Diagnostic accuracy of amino acid and FDG-PET in differentiating brain metastasis recurrence from radionecrosis after radiotherapy: A systematic review and meta-analysis. AJNR Am J Neuroradiol. 2018;39:280–8. doi: 10.3174/ajnr.A5472. [DOI] [PMC free article] [PubMed] [Google Scholar]
- 3.Hazle JD, Jackson EF, Schomer DF, Leeds NE. Dynamic imaging of intracranial lesions using fast spin-echo imaging: Differentiation of brain tumors and treatment effects. J Magn Reson Imaging. 1997;7:1084–93. doi: 10.1002/jmri.1880070622. [DOI] [PubMed] [Google Scholar]
- 4.Mangalore S, Vankayalapati S, Jabeen S, Kumar Gupta A, Kumar P. Can high b value diffusion be a surrogate marker for PET-A MR/PET study in neurooncology set up. Front Neurol. 2021;12:627247. doi: 10.3389/fneur.2021.627247. [DOI] [PMC free article] [PubMed] [Google Scholar]
- 5.Soret M, Bacharach SL, Buvat I. Partial-volume effect in PET tumor imaging. J Nucl Med. 2007;48:932–45. doi: 10.2967/jnumed.106.035774. [DOI] [PubMed] [Google Scholar]
- 6.Mamlouk MD, Handwerker J, Ospina J, Hasso AN. Neuroimaging findings of the post-treatment effects of radiation and chemotherapy of malignant primary glial neoplasms. Neuroradiol J. 2013;26:396–412. doi: 10.1177/197140091302600405. [DOI] [PMC free article] [PubMed] [Google Scholar]
- 7.Walker AJ, Ruzevick J, Malayeri AA, Rigamonti D, Lim M, Redmond KJ, et al. Postradiation imaging changes in the CNS: How can we differentiate between treatment effect and disease progression? Future Oncol. 2014;10:1277–97. doi: 10.2217/fon.13.271. [DOI] [PMC free article] [PubMed] [Google Scholar]
- 8.Shah R, Vattoth S, Jacob R, Manzil FF, O'Malley JP, Borghei P, et al. Radiation necrosis in the brain: Imaging features and differentiation from tumor recurrence. Radiographics. 2012;32:1343–59. doi: 10.1148/rg.325125002. [DOI] [PubMed] [Google Scholar]
- 9.Zakhari N, Taccone MS, Torres C, Chakraborty S, Sinclair J, Woulfe J, et al. Diagnostic accuracy of centrally restricted diffusion in the differentiation of treatment-related necrosis from tumor recurrence in high-grade gliomas. AJNR Am J Neuroradiol. 2018;39:260–4. doi: 10.3174/ajnr.A5485. [DOI] [PMC free article] [PubMed] [Google Scholar]
- 10.Hainc N, Alsafwani N, Gao A, O’Halloran PJ, Kongkham P, Zadeh G, et al. The centrally restricted diffusion sign on MRI for assessment of radiation necrosis in metastases treated with stereotactic radiosurgery. J Neurooncol. 2021;155:325–33. doi: 10.1007/s11060-021-03879-4. [DOI] [PMC free article] [PubMed] [Google Scholar]
- 11.Borghei-Razavi H, Sharma M, Emch T, Krivosheya D, Lee B, Muhsen B, et al. Pathologic correlation of cellular imaging using apparent diffusion coefficient quantification in patients with brain metastases after gamma knife radiosurgery. World Neurosurg. 2020;134:e903–12. doi: 10.1016/j.wneu.2019.11.037. [DOI] [PubMed] [Google Scholar]
- 12.Zhang H, Ma L, Wang Q, Zheng X, Wu C, Xu BN. Role of magnetic resonance spectroscopy for the differentiation of recurrent glioma from radiation necrosis: A systematic review and meta-analysis. Eur J Radiol. 2014;83:2181–9. doi: 10.1016/j.ejrad.2014.09.018. [DOI] [PubMed] [Google Scholar]
- 13.Zakhari N, Taccone MS, Torres CH, Chakraborty S, Sinclair J, Woulfe J, et al. Prospective comparative diagnostic accuracy evaluation of dynamic contrast-enhanced (DCE) versus dynamic susceptibility contrast (DSC) MR perfusion in differentiating tumor recurrence from radiation necrosis in treated high-grade gliomas. J Magn Reson Imaging. 2019;50:573–82. doi: 10.1002/jmri.26621. [DOI] [PubMed] [Google Scholar]
- 14.Nael K, Bauer AH, Hormigo A, Lemole M, Germano IM, Puig J, et al. Multiparametric MRI for differentiation of radiation necrosis from recurrent tumor in patients with treated glioblastoma. AJR Am J Roentgenol. 2018;210:18–23. doi: 10.2214/AJR.17.18003. [DOI] [PubMed] [Google Scholar]
- 15.Strijkers GJ, Hak S, Kok MB, Springer CS, Jr, Nicolay K. Three-compartment T1 relaxation model for intracellular paramagnetic contrast agents. Magn Reson Med. 2009;61:1049–58. doi: 10.1002/mrm.21919. [DOI] [PubMed] [Google Scholar]
- 16.Fasaeiyan N, Soltani M, Moradi Kashkooli F, Taatizadeh E, Rahmim A. Computational modeling of PET tracer distribution in solid tumors integrating microvasculature. BMC Biotechnol. 2021;21:67. doi: 10.1186/s12896-021-00725-3. [DOI] [PMC free article] [PubMed] [Google Scholar]
- 17.Restrepo CS, Tavakoli S, Marmol-Velez A. Contrast-enhanced cardiac magnetic resonance imaging. Magn Reson Imaging Clin N Am. 2012;20:739–60. doi: 10.1016/j.mric.2012.07.005. [DOI] [PubMed] [Google Scholar]
- 18.Liu D, Liu X, Ba Z, Xie L, Han J, Yu D, et al. Delayed contrast enhancement in magnetic resonance imaging and vascular morphology of primary diffuse large B-cell lymphoma (DLBCL) of the central nervous system (CNS): A retrospective study. Med Sci Monit. 2019;25:3321–8. doi: 10.12659/MSM.913439. [DOI] [PMC free article] [PubMed] [Google Scholar]
Associated Data
This section collects any data citations, data availability statements, or supplementary materials included in this article.
Supplementary Materials
Subtracted and positron emission tomography images with subtracted mask for different radio-tracers. (a) Fluorodeoxyglucose radiotracer with subtracted contrast and positron emission tomography image and tumor mask of subtracted image overlapping on positron emission tomography image, (b) C11-methionine radiotracer with subtracted contrast and positron emission tomography image and tumor mask of subtracted image overlapping on positron emission tomography image, (c) Fluoroethyl-L-tyrosine radiotracer with subtracted and positron emission tomography image, (d) Dihydroxyphenylalanine (DOPA) radiotracer with subtracted contrast and positron emission tomography image and tumor mask of subtracted image overlapping on positron emission tomography image. PET: Positron emission tomography


