Abstract
Gabapentinoids are commonly used medications for numerous off-label conditions. The 2002-2021 Medical Expenditure Panel Survey (MEPS) was used to investigate the proportion of the adult population who were gabapentinoid users, the ages of these users, medications and diagnoses associated with users, and the likelihood of starting, stopping, or continuing gabapentinoids. Gabapentinoid users continued to increase since our last publication from 4.0% in 2015 to 4.7% in 2021. Gabapentinoid use was much more likely among individuals who used other medications used in chronic pain. Between 2017-2021, numerous chronic pain conditions were associated with gabapentinoid use. New gabapentinoid users clearly outnumbered gabapentinoid stoppers between 2011-2012 and 2017-2018, but this difference decreased in the most recent cohorts.
Key words: health care delivery, health services research, chronic pain, pain management, gabapentinoids, medication prescription, MEPS
INTRODUCTION
Gabapentinoids are a commonly used medication class, prescribed primarily for off-label indications with limited evidence to support much of this use.1-5 Recent research has highlighted continued increases in gabapentin prescriptions, especially in combination with opioids, in the United States.4 Given the ongoing pressure to limit the prescribing of opioids and benzodiazepines and because of gaps in the literature,6 we set out to update a previous manuscript3 with 6 additional years of data to investigate rates of gabapentinoid users, better characterize to whom and for what indications the medications are prescribed, and describe patterns of how the medications are started, stopped, or continued year-over-year.
METHODS
We used the 2002-2021 Medical Expenditure Panel Survey (MEPS), a nationally representative survey of the non-institutionalized US population.7 The MEPS collects data including sociodemographic characteristics, medical conditions, and prescription medication use. Survey procedures were modified in 2020 and 2021 due to the coronavirus pandemic. These changes included using telephone data collection and individuals being included longer than normal in the survey.7 We used the cross-sectional (2002-2021) and longitudinal versions (2002-2020) of the survey. The longitudinal version tracks individuals over the 2 survey years as opposed to the cross-sectional version that reports individuals for 1 year.8
In the cross-sectional analysis, we included all adult respondents aged ≥18 years. In the longitudinal analysis, all adult respondents (aged ≥18 years at the end of the first survey year) were included if they were alive at the end of the second survey year. Gabapentinoid users were identified as an individual who reported a fill of any gabapentinoid during a year. Because gabapentinoids are commonly prescribed for pain and mental health conditions,1,2 we identified other related central nervous system–active medication classes including opioids, benzodiazepines (including benzodiazepine receptor agonists; zolpidem and eszopiclone), serotonin and norepinephrine re-uptake inhibitors, tricyclic anti-depressants, and muscle relaxants (eg, cyclobenzaprine, baclofen). Medical conditions are self-reported in association with a medical event (prescription drug fill, office visit, etc). Additionally, all participants were asked if they had diabetes mellitus. Common indications for gabapentinoids were identified using Clinical Classifications Software Refined (CCSR)9 and International Classification of Diseases, Tenth Revision, Clinical Modification (ICD-10-CM) codes between 2017-2021. The codes used to identify conditions are listed in Table 1.
Table 1.
Gabapentinoid Users by Medical Condition, 2017-2021
| CCSR and (ICD-10-CM) Codes | Adult Population With the Medical Condition Reported, % | Adult Population With Condition and Gabapentinoid, % | Individuals With Condition That Reported Gabapentinoid, % | Odds Ratio of Gabapentinoid With Conditiona | |
|---|---|---|---|---|---|
| Polyneuropathies | NVS015 (ICD10: G62) | 1.2 (1.1-1.3) | 0.8 (0.7-0.9) | 69.5 (66.1-72.8) | 59.2 (50.4-69.6) |
| Low back pain or spondylopathies/spondyloarthropathy (including infective) | MUS011 or MUS038 (ICD10: M43, M47, M48, M50, M511, M53, M54, M62) | 6.0 (5.8-6.3) | 1.1 (1.0-1.2) | 21.0 (19.6-22.6) | 6.9 (6.3-7.6) |
| Nervous system pain and pain syndromes | NVS019 (ICD10: G89) | 1.5 (1.4-1.7) | 0.4 (0.3-0.5) | 25.9 (22.9-29.1) | 8.0 (6.8-9.4) |
| Musculoskeletal pain, not low back pain | MUS010 (ICD10: M25, M54, M79) | 12.4 (12.0-12.7) | 1.5 (1.4-1.7) | 12.4 (11.5-13.3) | 4.0 (3.7-4.4) |
| Fibromyalgia | ICD10 M79 and MUS025 (ICD10: M71, M72, M75, M79) | 2.4 (2.2-2.5) | 0.9 (0.8-1.0) | 36.9 (34.1-40.0) | 15.2 (13.4-17.2) |
| Mononeuropathy (nerve and nerve root disorders) | NVS017 (ICD10: G56, G57, G58) | 1.5 (1.4-1.6) | 0.4 (0.4-0.5) | 29.0 (25.9-32.4) | 9.5 (8.0-11.2) |
| Zoster | ICD10: B02 | 0.5 (0.5-0.6) | 0.1 (0.1-0.1) | 15.8 (12.2-20.1) | 4.0 (3.0-5.4) |
| Seizure disorder | NVS009 (ICD10: G40, R56) | 1.0 (0.9-1.0) | 0.2 (0.1-0.2) | 19.4 (15.9-23.4) | 5.3 (4.1-6.8) |
| Anxiety disorder | MBD005 (ICD10: F41) | 9.7 (9.3-10.0) | 1.1 (1.0-1.2) | 11.4 (10.5-12.2) | 3.3 (3.0-3.6) |
| Headache, including migraine | NVS010 (ICD10: G43, G44, R51) | 3.4 (3.2-3.6) | 0.5 (0.4-0.5) | 13.1 (11.7-14.8) | 3.5 (3.0-4.0) |
| Insomnia | NVS016 (ICD10: F51, G47) | 5.7 (5.4-6.0) | 1.0 (0.9-1.1) | 17.5 (16.2-18.8) | 5.5 (4.9-6.0) |
| Diabetes | Self-report of diabetes | 11.1 (10.7-11.5) | 1.6 (1.4-1.7) | 14.0 (13.1-15.0) | 4.7 (4.3-5.2) |
CCSR = Clinical Classifications Software Refined; ICD-10-CM = International Classification of Diseases, Tenth Revision, Clinical Modification.
Note: Medical conditions were identified from the 2017-2021 Medical Expenditure Panel Survey (MEPS). Percentage of the population is the percent of the adult population reporting a medical condition associated with a medical event, the percentage of the population with the condition and any gabapentinoid, and percentage of individuals reporting a gabapentinoid among individuals with the condition. The unadjusted odds ratio represents the odds ratio of an individual uses a gabapentinoid if they reported the medical condition compared with individuals who did not report the condition.
Odds ratios have a P <0.001.
Survey-weighted descriptive statistics are reported in Figure 1A, 1C, and 1D. For Figure 1B, we used separate multivariable logistic regressions for individuals from 3 time periods (2002-2004, 2011-2013, and 2019-2021) with the outcome variable of gabapentinoid use during a year with the independent variables being age modeled as a restricted cubic spline with 4 knots. The Stata adjustrcspline command (StataCorp LLC) was used to visualize the probability of gabapentinoid use. Logistic regression was used to determine the likelihood that an individual reporting a medical condition used gabapentin compared with individuals without that condition.
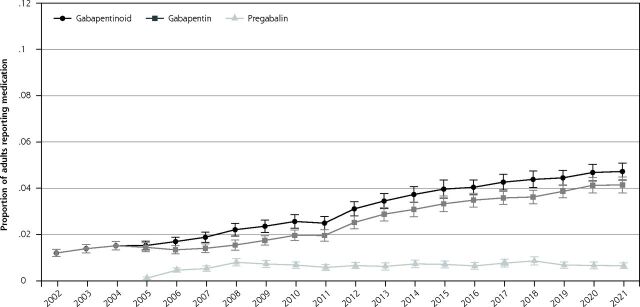
Figure 1A.
Proportion of adult population reporting gabapentinoid, gabapentin, and pregabalin use.
Note: Figure reports the proportion of the adult population who reported any applicable medication during the year, 2002-2021.
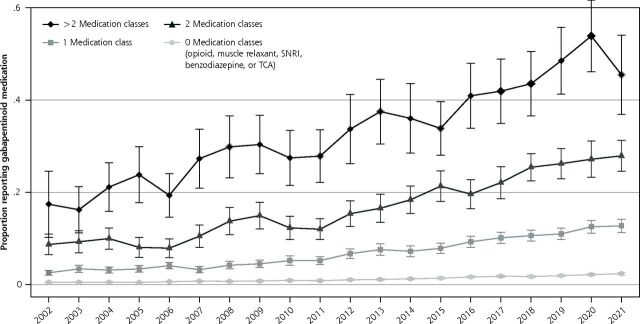
Figure 1C.
Proportion of gabapentinoid medication user by number of included medication classes.
Note: Included medication classes include opioids, muscle relaxants, benzodiazepines, serotonin and norephinephrine re-uptake inhibitors (SNRIs), and tricyclic antidepressants (TCAs).
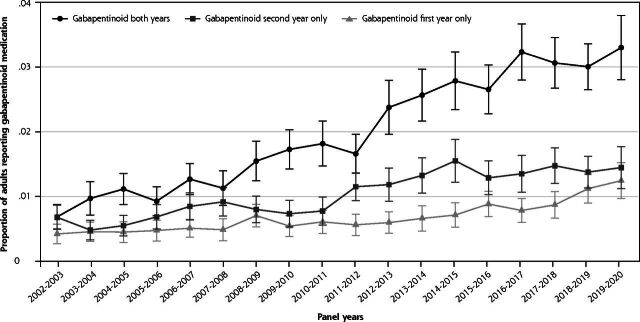
Figure 1D.
Proportion of adult population using gabapentinoid during first, second, or both years.
Note: Analysis of the longitudinal MEPS files analyzing the proportion of the adult population who reported a gabapentinoid during first, second, or both survey years. Panels 7-24 (2002-2020) were included in the analysis.
Data from the 2002-2021 Medical Expenditure Panel Survey.
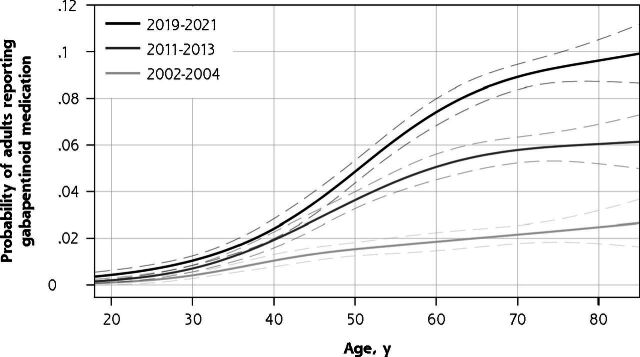
Figure 1B.
Probability of gabapentinoid medication user by age.
Note: Three separate multivariable logistic regressions were used with age modeled as a restricted cubic spline with 4 knots between 3 different time periods.
By including data on the same individuals surveyed a second time, the longitudinal MEPS allowed us to examine the changing dynamics of incident vs prevalent gabapentinoid use over time. The study was ruled exempt by the OhioHealth Institutional Review Board. Adjusted Wald tests were used to compare individual years. All analyses included complex survey weights and were conducted using Stata, version 17.
RESULTS
The cross-sectional aspect of the study included 488,348 individuals. The proportion of the population reporting a gabapentinoid medication increased from 1.2% (95% CI, 1.0-1.4) in 2002 to 4.0% (95% CI, 3.6-4.4) in 2015 and 4.7% (95% CI, 4.4-5.1) in 2021 (P <0.001 for 2002-to-2015 comparison and P <0.01 for 2015-to-2021 comparison). The proportion of the population reporting gabapentin increased throughout the study, while pregabalin use was largely unchanged after 2008 (Figure 1A). The probability of gabapentinoid users increased for nearly all ages between 2002-2004 to 2019-2021; between 2019-2021, the probability of gabapentinoid use among those aged 70+ was around 9% (Figure 1B). Gabapentinoid use increased with each additional central nervous system–active medication class examined (Figure 1C). Between 2018-2021, 37.6% (95% CI, 35.6-39.8) of gabapentinoid users were not users of any of the other medication classes. In 2017-2021, the medical condition with the highest proportion of the population who reported gabapentinoids were musculoskeletal pain and diabetes, but these conditions had lower odds ratios of use than some other conditions such as polyneuropathies and fibromyalgia. (Table 1)
The longitudinal aspect of the study included 196,589 individuals over 17 panels. The probability that an individual used a gabapentinoid for both years increased until 2016-2017, when it plateaued slightly above 3%. Consistent with the rising cross-sectional prevalence, longitudinal new use (ie, endorsed gabapentinoid use in the second but not first survey year) was more prevalent than discontinuation (ie, endorsed only first-year use) in all panels between 2011-2012 and 2017-2018, but the difference was smaller in 2018-2019 and 2019-2020 (Figure 1D). The proportion of individuals who continued gabapentinoids into the second year was higher between 2016-2019 panels (75.8% [95% CI, 73.2-78.2]) and the 2002-2005 panels (67.3% [95% CI, 62.4-71.7])(P = 0.002).
DISCUSSION
Our descriptive analysis of gabapentinoid use in the United States showed a continued increase since our last publication using MEPS data up to 2015.3 The growth was primarily driven by gabapentin, as we did not detect any increase in pregabalin users after 2008 or after generic availability in 2019. Gabapentinoids continue to be commonly used in conjunction with other sedating medications, which is concerning in light of the US Food and Drug Administration’s 2019 warning about co-prescribing of gabapentinoids with other central nervous system depressants.10 Gabapentinoids are likely used for an array of conditions, with the majority being off-label uses for chronic pain with minimal evidence supporting use.5 The study has numerous limitations including changes in survey design in 2020, a presumed under-reporting of short-term opioid and muscle relaxants, lack of directly linking medical conditions to a gabapentinoid, imperfect survey methodology to determine use of medications as synchronous vs asynchronous throughout a year, and a lack of accounting for gabapentinoid use among the institutionalized US population. Gabapentinoid users continued to increase following our 2015 publication despite a dearth of evidence supporting use in many cases; while these clinical scenarios can be challenging, continuation should be reconsidered at regular intervals.3,5
Footnotes
Conflicts of interest: authors report none.
Funding support: Donovan T. Maust reports funding from R01DA045705.
REFERENCES
- 1.Hamer AM, Haxby DG, McFarland BH, Ketchum K.. Gabapentin use in a managed medicaid population. J Manag Care Pharm. 2002; 8(4): 266-271. 10.18553/jmcp.2002.8.4.266 [DOI] [PubMed] [Google Scholar]
- 2.Gingras MA, Lieu A, Papillon-Ferland L, Lee TC, McDonald EG.. Retrospective cohort study of the prevalence of off-label gabapentinoid prescriptions in hospitalized medical patients. J Hosp Med. 2019; 14(9): 547-550. 10.12788/jhm.3203 [DOI] [PMC free article] [PubMed] [Google Scholar]
- 3.Johansen ME. Gabapentinoid use in the United States 2002 through 2015. JAMA Intern Med. 2018; 178(2): 292-294. 10.1001/jamainternmed.2017.7856 [DOI] [PMC free article] [PubMed] [Google Scholar]
- 4.Peet ED, Dana B, Sheng FY, Powell D, Shetty K, Stein BD.. Trends in the concurrent prescription of opioids and gabapentin in the US, 2006 to 2018. JAMA Intern Med. 2023; 183(2): 162-164. 10.1001/jamainternmed.2022.5268 [DOI] [PMC free article] [PubMed] [Google Scholar]
- 5.McDonagh MS, Selph SS, Buckley DI, et al. Nonopioid pharmacologic treatments for chronic pain. Agency for Healthcare Research and Quality. Published Apr 2020. https://www.ncbi.nlm.nih.gov/books/NBK556268/ [PubMed] [Google Scholar]
- 6.Dowell D, Haegerich TM, Chou R.. CDC Guideline for Prescribing Opioids for Chronic Pain—United States, 2016. JAMA. 2016; 315(15): 1624-1645. 10.1001/jama.2016.1464 [DOI] [PMC free article] [PubMed] [Google Scholar]
- 7.Agency for Healthcare Research and Quality (AHRQ), Center for Financing, Access, and Cost Trends . MEPS HC-233 2021 full year consolidated data file. Published Aug 2023. https://meps.ahrq.gov/data_stats/download_data/pufs/h233/h233doc.pdf
- 8.Agency for Healthcare Research and Quality (AHRQ), Center for Financing, Access, and Cost Trends . MEPS HC-225 Panel 24 longitudinal data file. Published Sep 2022. https://meps.ahrq.gov/data_stats/download_data/pufs/h225/h225doc.pdf
- 9.Agency of Healthcare Research and Quality (AHRQ) . Health Cost & Utilization Project. Clinical Classfications Software Refined (CCSR) for ICD-10-CM diagnoses. Accessed Apr 17, 2023. https://hcup-us.ahrq.gov/toolssoftware/ccsr/dxccsr.jsp
- 10.FDA Drug Safety Communication . FDA warns about serious breathing problems with seizure and nerve pain medicines gabapentin (Neurontin, Gralise, Horizant) and pregabalin (Lyrica, Lyrica CR). Published Dec 19, 2019. https://www.fda.gov/drugs/drug-safety-and-availability/fda-warns-about-serious-breathing-problems-seizure-and-nerve-pain-medicines-gabapentin-neurontin


