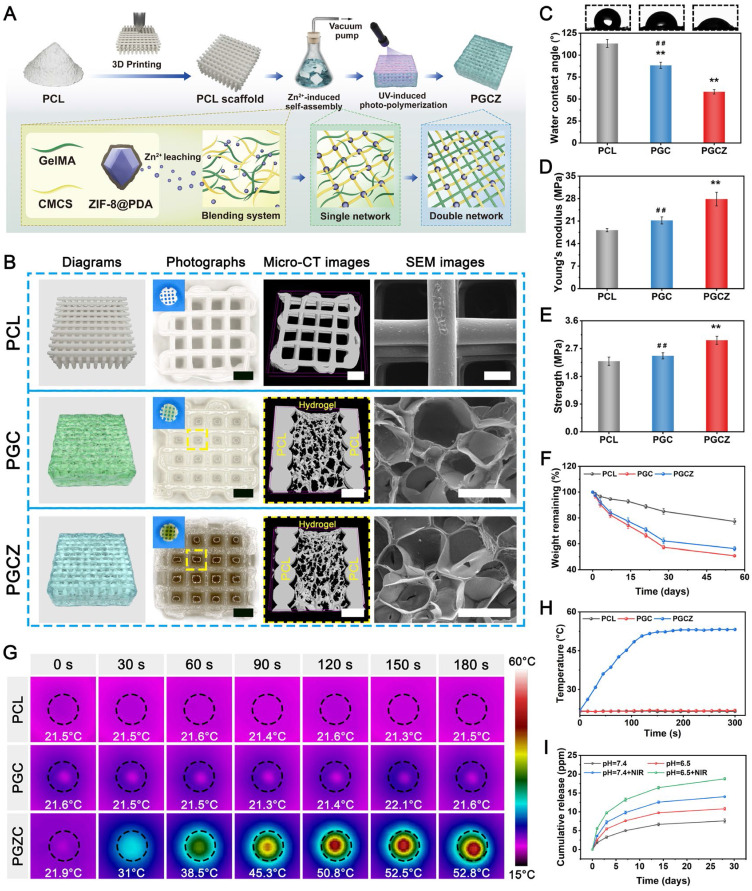
Figure 3.
Preparation and characterization of photoactivated PGCZ hybrid scaffolds. (A) Schematic diagram of the PGCZ hybrid scaffold fabrication process. (B) Schematic and morphology of PCL, PGC, and PGCZ hybrid scaffolds. Scale bar: 1 mm (optical images), 1 mm (micro-CT images in PCL), 350 μm (micro-CT images in PGC and PGCZ), and 200 μm (SEM images). (C) Water contact angles of the various scaffolds. (D) Young's modulus, and (E) compressive strength of the various scaffolds. (F) Degradation curves of the various scaffolds. (G) Infrared thermal images and (H) temperature curves of the various scaffolds under NIR laser radiation (808 nm, 1 W/cm2). (I) Release profiles of Zn2+ from the PGCZ scaffold with or without intermittent NIR irradiation (808 nm, 1 W/cm2) at different pH levels. Data are presented as the mean ± SD (n = 3). *P < 0.05 and **P < 0.01 indicate significant differences compared with the PCL group. #P < 0.05 and # #P < 0.01 indicate significant differences compared with the PGCZ group.

