

Abstract
Necroptosis is a programmed lytic cell death involving active cytokine production and plasma membrane rupture through distinct signaling cascades. However, it remains challenging to delineate this inflammatory cell death pathway at specific signaling nodes with spatiotemporal accuracy. To address this challenge, we developed an optogenetic system, termed Light-activatable Receptor-Interacting Protein Kinase 3 or La-RIPK3, to enable ligand-free, optical induction of RIPK3 oligomerization. La-RIPK3 activation dissects RIPK3-centric lytic cell death through the induction of RIPK3-containing necrosome, which mediates cytokine production and plasma membrane rupture. Bulk RNA-Seq analysis reveals that RIPK3 oligomerization results in partially overlapped gene expression compared to pharmacological induction of necroptosis. However, La-RIPK3 activates a group of genes likely regulated by RIPK3 kinase-independent processes. Using patterned light stimulation delivered by a spatial light modulator, we demonstrate precise spatiotemporal control of necroptosis in La-RIPK3-transduced HT-29 cells. Optogenetic control of proinflammatory lytic cell death could lead to the development of innovative experimental strategies to finetune the immune landscape for disease intervention.
INTRODUCTION
Cell death is an essential mechanism for maintaining homeostasis in multicellular organisms. Apoptosis, a form of programmed cell death, involves the fragmentation of cellular contents engulfed by phagocytic cells. Apoptosis is considered a “quiet death” because of the containment and clearance of apoptotic corpses [1]. Necrosis, on the other hand, releases intracellular contents, such as damage-associated molecular patterns (DAMPs), through the ruptured plasma membrane, and the released DAMPs often induce an immune response [2]. Necroptosis is a programmed lytic cell death integrating features from apoptosis and necrosis [3]. Compared with necrosis, necroptosis can be more immunogenic due to its active production of inflammatory cytokines during cell death in addition to passive rupture of the plasma membrane [4, 5]. Indeed, necroptosis appears more potent in activating T cells than necrosis or apoptosis [5]. Although necroptosis is commonly believed to be an evolutionarily conserved pathway to guard against viral infection, mounting evidence suggests that necroptosis is a pathogenicity factor for various inflammatory diseases, such as inflammatory bowel diseases (IBD) [6] and neurodegenerative disorders [7]. In particular, necroptosis was activated in postmortem human Alzheimer’s disease brain [8] as well as the xenografted human neurons in mouse brains containing amyloid plaques [9].
Tumor necrosis factor alpha (TNFα) is a well-established ligand that initiates necroptosis and apoptosis. TNFα binding to its receptor, TNF receptor 1 (TNFR1), recruits the cytosolic Receptor Interacting Protein Kinase 1 (RIPK1) and other proteins to form a receptor complex called ‘complex-I’ at the plasma membrane. When apoptosis is blocked by the broad-spectrum caspase inhibitor zVAD-fmk, cells die by necroptosis, as is seen with TNFα + Smac mimetics + zVAD-fmk (TSZ) treatment. Under these conditions, RIPK1 dissociates from the complex-I and forms a hetero-oligomer complex termed ‘necrosome’ with Receptor Interacting Protein Kinase 3 (RIPK3) via their C-terminal RIP Homotropic Interaction Motif (RHIM) domain [10]. Oligomerized necrosomal RIPK3 undergoes autophosphorylation and, in turn, phosphorylates the executioner protein, Mixed Lineage Kinase domain-Like (MLKL), which ruptures the plasma membrane to release intracellular contents [11, 12]. This TNF-RIPK1-RIPK3-MLKL axis regulates the canonical RIPK1-dependent necroptosis pathway. Alternatively, necroptosis can be activated in a manner that does not involve RIPK1 [13–15]. For example, Z-DNA-binding protein 1 (ZBP1, also called DAI) and cytoplasmic dsDNA induce necroptosis through RIPK3 [16]. TLR3/4 and dsRNA or lipopolysaccharide (LPS) induce RIPK3-dependent necroptosis during viral and bacterial infections [17, 18]. These non-canonical necroptosis pathways can bypass RIPK1 activation but converge at RIPK3-centric necrosome formation. Therefore, RIPK3 plays a role in canonical and non-canonical necroptosis pathways. However, it remains challenging to dissect RIPK3-centric signaling outcomes during necroptosis. Thus, new strategies that specifically delineate RIPK3 signaling can provide detailed insights into the lytic cell death mechanism.
Optogenetics utilizes light-induced protein conformational changes to modulate molecular functions [19–22] and allows for spatiotemporal control of signal transduction in live cells and animals [23, 24]. Several optogenetic systems have been developed that activate necroptosis by optically induced oligomerization of RIPK1 [25], RIPK3 [25, 26], and MLKL [25–27]. Nevertheless, examination of the regulation of gene expression, cytokine production, and spatiotemporal accuracy from these signaling nodes is lacking. Here, we developed light-activatable RIPK3 (La-RIPK3) system based on CRY2olig, an Arabidopsis thaliana crytochrome variant undergoing blue-light inducible oligomerization. La-RIPK3 activation causes MLKL-mediated upregulation of cytokine production and plasma membrane rupture in HT-29 cells. A bulk transcriptomics analysis showed that RIPK3 oligomerization upregulates genes involved in cellular stress response and cytokine signaling but downregulates those in cell survival pathways. When a patterned light illumination is applied, localized lytic cell death occurs within user-defined regions of interest. Our study employs optogenetic approaches to delineate signaling output from RIPK3-centric necrosomes during inflammatory lytic cell death. This strategy can be generalized to dissect distinct contributions from other signaling nodes within the cell death pathway.
RESULTS
Construction of photoactivatable systems for RIPK3 oligomerization
Because RIPK3 is the common signaling node in the canonical (RIPK1-dependent) and non-canonical (RIPK1-independent) necroptosis pathways (Fig. 1A), we target RIPK3 for optogenetic control via light-inducible association (Fig. 1B). Optogenetic induction of RIPK3 association should lead to its autophosphorylation and the formation of necrosomes, which regulates cytokine production and phosphorylates the downstream executioner protein, MLKL, for plasma membrane rupture. Here, we constructed nine photoactivatable RIPK3 association systems based on two photoactivatable proteins, Arabidopsis thaliana cryptochrome 2 (CRY2) and Vaucheria frigida Aureochrome light-oxygen-voltage (AuLOV) variants, codon-optimized for mammalian cell expression (Fig. 1C). Five out of nine systems were based on cryptochrome (RIPK3-CRY2WT or RCW) [28, 29], its photolyase-homology region (RIPK3-CRY2PHR or RCP) [30], its derivative CRY2Clust (RIPK3-CRY2Clust or RCC) [31] or CRY2Olig (RIPK3-CRY2Olig or RCO) [32], and the hybrid of CRY2clust and the N terminal truncate of CRY2-interacting-basic-helix-loop-helix (CIBN-RIPK3-p2A-CRY2Clust or CIBRC) [31]. The other four systems used AuLOV, including RIPK3-AuLOV (RA) [33], AuLOV with basic region/leucine zipper (RIPK3-bZIP-AuLOV or RbA), and tandem AuLOV with different linkers – RIPK3-2AuLOV-Rigid (R2A R) and RIPK3-2AuLOV-Short (R2A S). The bZIP domain was chosen because, as part of the original AuLOV protein, it could aid the AuLOV dimerization based on in vitro characterization [34]. The amino acid sequences of the rigid and short linkers are EAAAKEAAAK [35] and GG [36], respectively. Control modules include mCherry-CRY2clust (CC), mCherry-RIPK3 (RIPK3), mCherry-AuLOV (AuLOV), or mCherry-AuLOVx2 (2AuLOV) (Fig. 1C). Expression of these nine optogenetic systems in HEK293T cells was confirmed by Western blot (Sup. Fig. 1A). The average transfection efficiency for AuLOV systems (65%) was slightly higher than cryptochrome-based systems (50%), likely due to the slightly larger size of the latter. However, the variation of transfection efficiency within each photoactivatable protein group is less than 5% (Sup. Fig. 1B), minimizing the expression level-dependent variation of necroptosis phenotypes to be used in the following screening procedure. CC was chosen as the negative control because CRY2clust shows the most potent oligomerization among each CRY2 variant and is expected to calibrate the “upper limit” for effect arising from cryptochrome oligomerization alone. We validated that RIPK3 fusion to CRY2 variants does not disrupt their light-inducible oligomerization. In HEK293T cells transfected with CC and RCC, evident puncta formation was observed following blue light stimulation (Fig. 1D–E).
Figure 1: Construction of the light-activatable RIPK3 (La-RIPK3) systems.

A. Schematic of canonical and non-canonical necroptosis pathways. B. An illustration of blue-light-activated necroptosis via activation of RIPK3. Pharmacological and optogenetic activation of RIPK3 causes its oligomerization to form necrosomes, which regulate cytokine production and phosphorylates downstream executioner protein, MLKL, for plasma membrane rupture. C. Schematic illustration of light-activatable RIPK3 (La-RIPK3) constructs by fusing cryptochrome (left) and AuLOV (right) variants to RIPK3. The control modules have either optogenetic proteins only or RIPK3 only (bottom). An abbreviation for each construct is in the parenthesis. D. Time-lapse imaging of light-induced protein puncta formation of mCherry-tagged CC and RCC in live HEK293T cells. Cells were transiently transfected and cultured for 24 hours prior to imaging. One second of blue light (472 nm) was treated to the cells every 30 s. E. Quantitation of light-activated puncta formation using the normalized fluorescence intensities in 0 s and 120 s post-irradiation images in (D).
System screening based on light-inducible cytokine production and plasma membrane rupture
Necroptosis produces active cytokines, including the C-X-C motif chemokine ligands (CXCLs) and C-C-L motif chemokines (CCLs) [4, 37]. Thus, we screened the optogenetic RIPK3 systems based on their dynamic range of cytokine production and membrane rupture between light and dark treatment using HEK293T cells as a heterologous expression system. Proinflammatory cytokines, including Cxcl1 (Fig. 2A), Cxcl2 (Sup. Fig. 2A), and Cxcl8 (Sup. Fig. 2B), were chosen as a benchmark because upregulation of these genes has been reported in chemical-induced necroptosis [4]. Quantitative reverse transcription PCR (qRTPCR) analysis showed that light stimulation resulted in upregulated cytokine production from all optogenetic RIPK3 systems, but the potency and dynamic range varied among the candidates. The RCO module stood out with a 10.9-fold upregulation of Cxcl1 expression compared to its dark control (Fig. 2A). The CIBRC module showed the most potent production of chemokines. However, the light-to-dark contrast was slightly lower than the COR module due to higher basal activity in the dark. The AuLOV-RIPK3 variants resulted in a 2.9-6.5 fold increase of Cxcl1 expression, slightly less than CRY2 variants, likely due to a weaker oligomerization potential of AuLOV. A similar trend was observed for Cxcl2 and Cxcl8 production (Sup. Fig. 2A–B).
Figure 2: Optimization of the La-RIPK3 system and temporal profile of chemokine production and plasma membrane rupture.
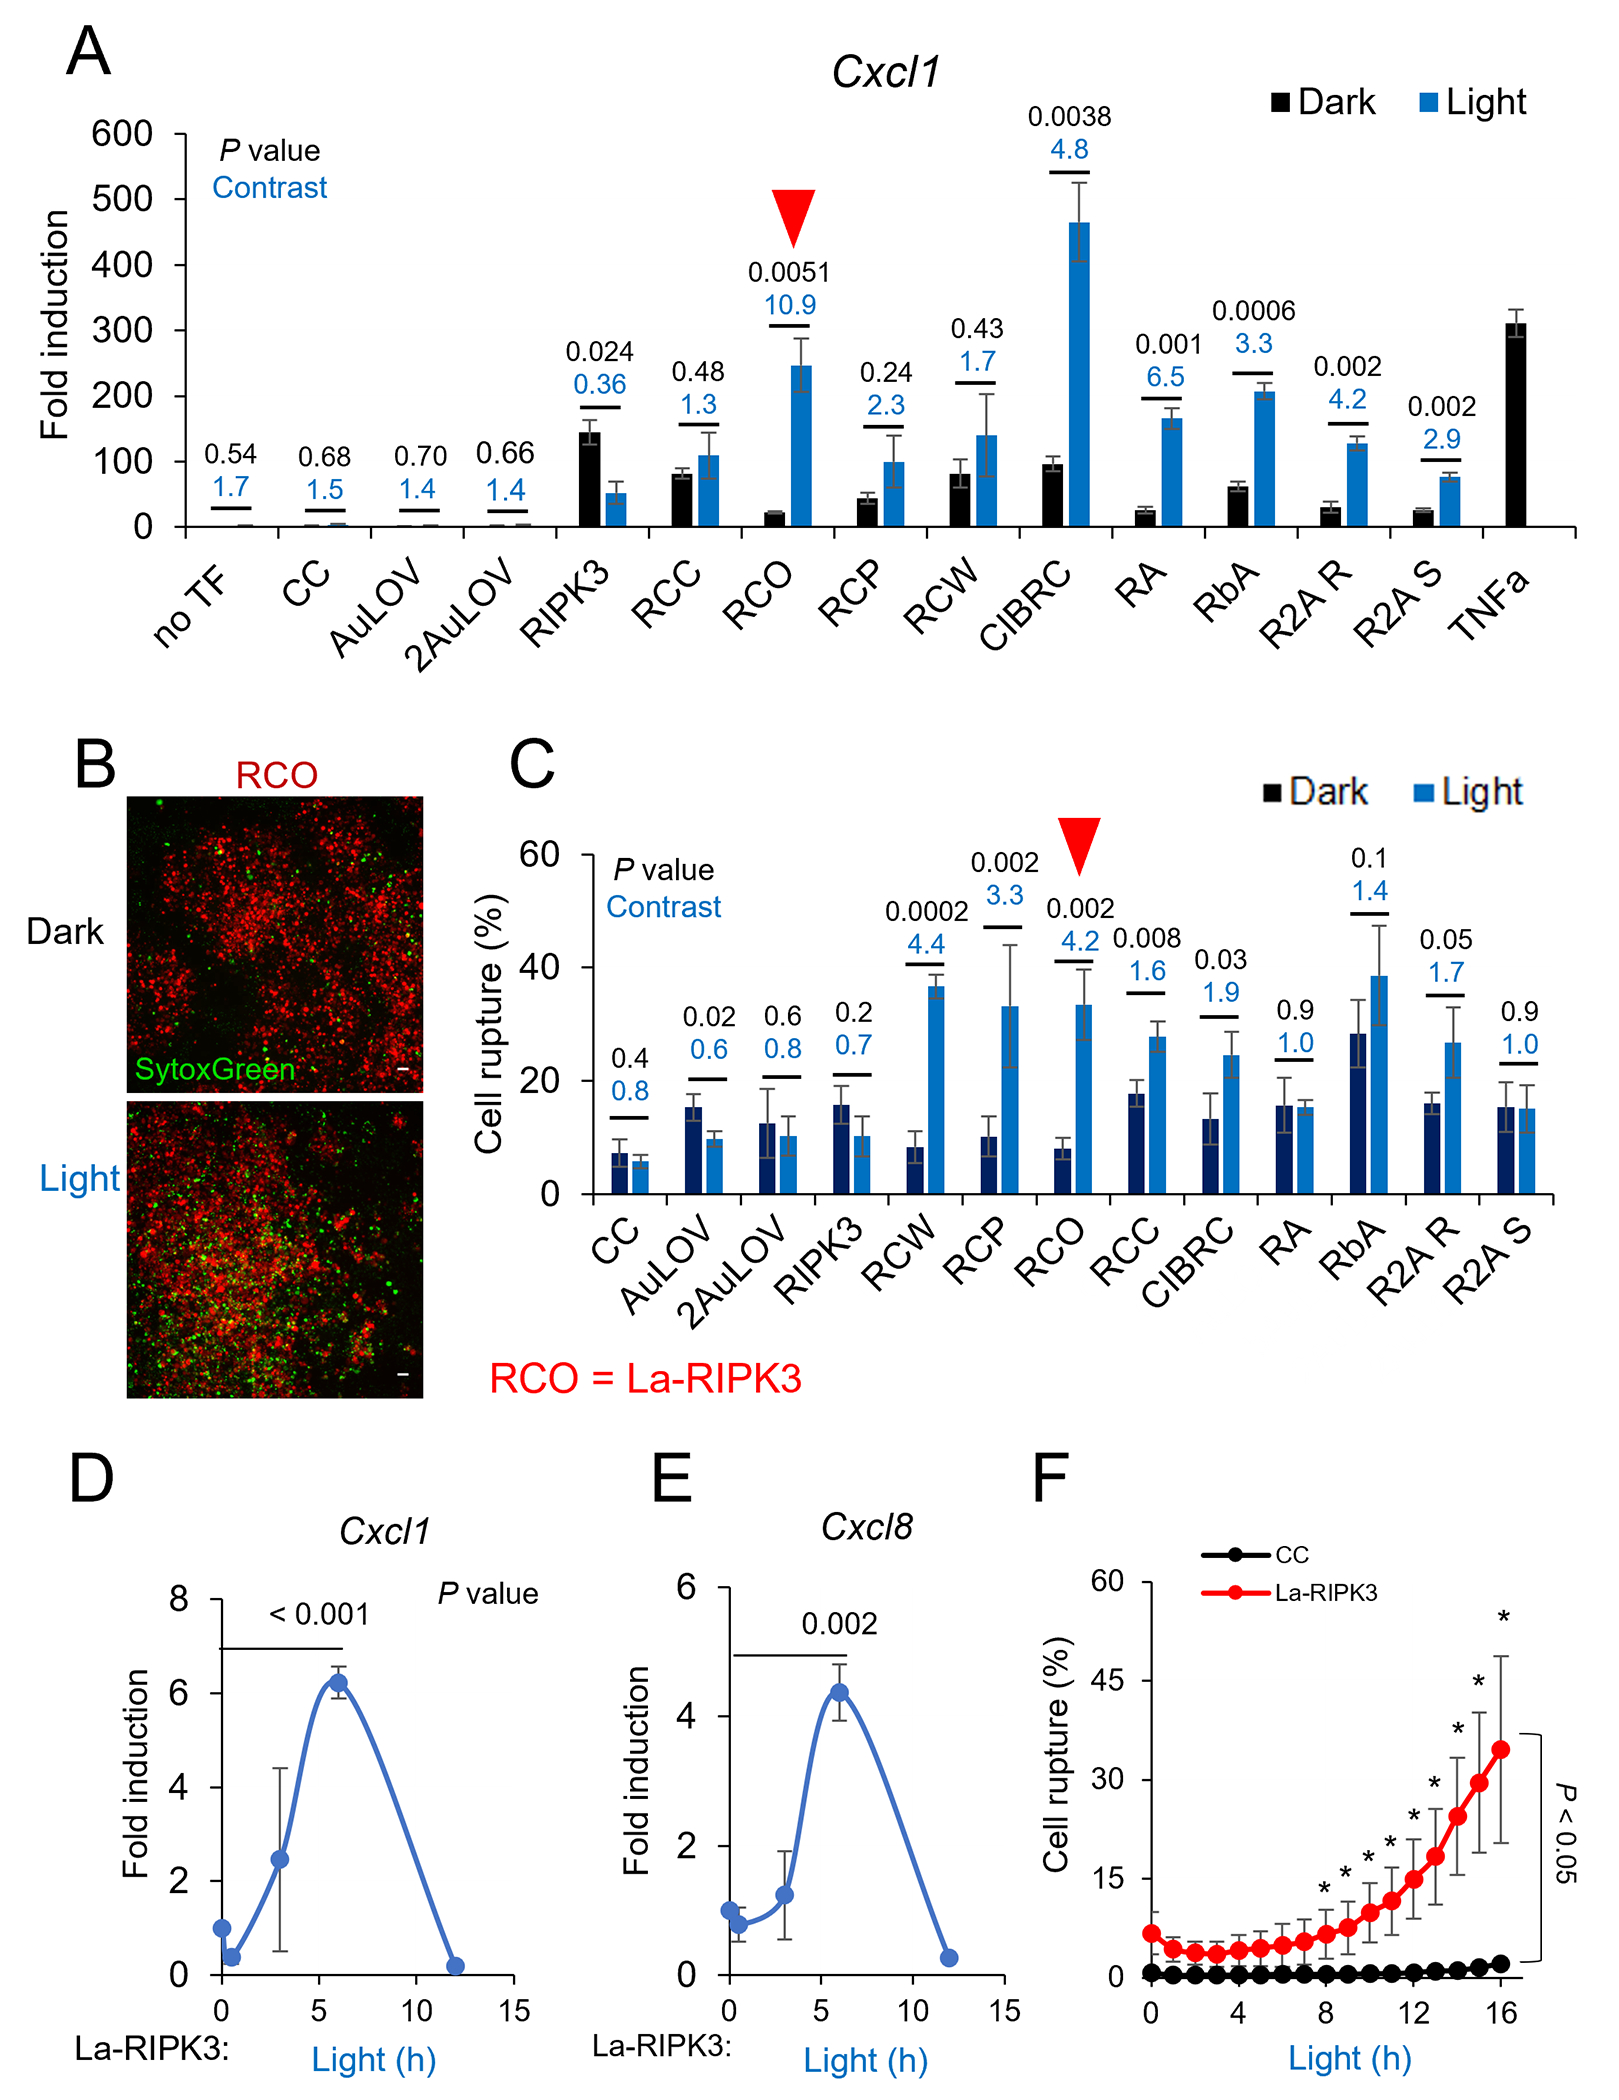
A. qRTPCR analysis of the Cxcl1 mRNA level in response to optogenetic activation of each optogenetic system. Transiently transfected HEK293T cells were treated with blue light (0.6 mW/cm2, 15 s on/off) for 6 h from a lab-built blue LED box (465 nm). Gapdh mRNA was used for normalization. Relative mRNA fold change was calculated by the delta-delta Ct method, normalized to non-transfected (no TF) cells in the dark. Three biological replicates (each with two to three technical replicates) were used for each analysis. B. Images of transiently transfected (mCherry, TXR filter) cells and dead cells (SytoxGreen, GFP filter) were captured after 12 h of blue light treatment to the transfected cells with the same light dose described in panels A and B. Scale bar is 50 μm. Quantification of plasma membrane rupture. The percentage of ruptured cells was calculated using the equation (numbers of SytoxGreen-stained cells/numbers mCherry transfected cells) * 100%. Representative images are shown in Sup. Fig. 2D. D-E. The level of Cxcl1 (D) and Cxcl8 (E) in La-RIPK3-expressing HEK293T cells was measured at 0.5, 2, 6, and 12 h after blue light stimulation quantified by qRTPCR. F. Quantification of time-dependent plasma membrane rupture in HEK293T cells. Live cells transiently transfected with La-RIPK3 were imaged for plasma membrane rupture (SytoxGreen-stained) in a controlled imaging chamber. Cells were illuminated with an amenable light dose (< 0.5 mW/cm2) from blue LED over 16 h. Representative images for temporal analysis are shown in Sup. Fig. 3C. Data for qPCR analysis represent the mean ± SEM. Data for cell death rate represent mean ± SD. In panels (A) and (C), the dynamic range (light-over-dark ratio) and P values (two-tailed t test) are marked as blue and black numbers above each pair of bars, respectively. In panels (D-F), P values (two-tailed t test) were marked as black numbers near each pair of bars. * P < 0.05.
The other benchmark for La-RIPK3 assessment is the plasma membrane rupture, which underpins the immunogenicity of necroptosis due to the subsequent release of inflammatory molecules, such as the damage-associated-molecular-patterns (DAMPs) [38]. As reported in previous work, we used SytoxGreen, a lytic cell death stain, to quantify membrane rupture [36, 37, 39]. We first confirmed that SytoxGreen reliably stained lytic cells. Significant staining was observed in HT-29 cells treated with TSZ (necroptosis inducer) but not in the sickened cells from TNFα+ Smac mimetics (TS, apoptosis inducer) [40, 41] (Sup. Fig. 2C). The plasma membrane rupture rate was calculated by dividing the number of green speckles (SytoxGreen-stained) by the number of transfected cells (mCherry-positive, Fig. 2B). Cryptochrome-based optogenetic systems induced a dynamic range of 1.6-4.4, whereas AuLOV-based systems showed a smaller dynamic range of 1-1.7 (Fig. 2C). No significant SytoxGreen staining was found in any negative controls, indicating minimal phototoxicity at the excitation power (0.5 mW/cm2). Representative images of each optogenetic system were compiled in Sup. Fig. 2D. Ranking the dynamic range of cytokine production and membrane rupture rate, we chose RCO as the optimal optogenetic system and referred to it as La-RIPK3 in the following studies. Because of the strong potency of the CIBRC, we also used it to validate some crucial findings.
La-RIPK3 and tumor necrosis factor exhibit distinct potency to induce proinflammatory gene expression
To benchmark the absolute potency of La-RIPK3 in cytokine production, we compared the induction of Cxcl1, Cxcl2, and Cxcl8 between La-RIPK3 and tumor necrosis factor α (TNFα). In HEK293T cells, TNFα induced an approximately 300-fold increase of Cxcl1, whereas La-RIPK3 induced about 250-fold (Fig. 2A). CIBRC showed a 450-fold increase under light treatment. However, La-RIPK3 induced significantly higher level of Cxcl2 (90-fold) compared to TNFα (20-fold) (Sup. Fig. 2A). A similar trend was observed in Cxcl8 induction (La-RIPK3 1500-fold vs. TNFα 400-fold) (Sup. Fig. 2B). These results suggest that La-RIPK3 and TNFα differentially allocate cellular machinery for cytokine production. A drastic case is Ccl2, which was upregulated 27-fold by TNFα but showed no significant changes by any optogenetic RIPK3 systems (Sup. Fig. 2E). This distinctive induction pattern highlights that La-RIPK3 could delineate the RIPK3-centric, necrosomal contribution to gene expression that is distinct from that of the other signaling pathways induced by TNFα, for example, the NF-κB pathway triggered by RIPK1 ubiquitination in the complex-I [14]. In the later section, we will revisit La-RIPK3-regulated gene expression by a comprehensive transcriptomic analysis.
RIPK3 oligomerization induces distinct kinetics of cytokine production and plasma membrane rupture
TNFα induces rhythmic shuffling of the NF-κB transcription factor between the nucleus and the cytoplasm [42, 43]. A major wave of cytokine transcription peaks around 1 h after TNFα treatment. TSZ treatment results in two waves of cytokine transcription: the first wave peaks at 1 h (likely from complex-I), while the second wave peaks at 6 h (likely from necrosomes) [4]. La-RIPK3 directly induces necrosome formation via oligomerization of RIPK3; therefore, it is expected to reveal the kinetics of the necrosome-mediated gene expression. In La-RIPK3 transfected HEK293T cells, expression of Cxcl1 (Fig. 2D) and Cxcl8 (Fig. 2E) was initiated at 3 h, peaked at 6 h, and regressed around 12 h post-illumination. CIBRC activation produced cytokine transcription kinetics similar to La-RIPK3 (Sup. Fig. 3A–B). On the other hand, plasma membrane rupture initiated around 8 h post-illumination and monotonically intensified afterward in La-RIPK3-transfected HEK293T cells (Fig. 2F). Photoactivation of CIBRC also showed a comparable cell death (Sup. Fig. 3C–D) to La-RIPK3. The optogenetically induced plasma membrane rupture kinetics is comparable to that induced by TNFR1, which initiates around 6 h, reported by lactate dehydrogenase release [39]. As expected, La-RIPK3-transfected HEK293T cell in the dark, or CC, RIPK3-transfected showed minimal plasma membrane rupture (Sup. Fig. 3E).
La-RIPK3 activation promotes the formation of necrosomes
Auto/trans-phosphorylation of RIPK3 is crucial in mediating its functional outcome [11, 13, 14, 44]. To determine the phosphorylation status of RIPK3, we performed an immunofluorescence assay using a primary antibody against pRIPK3 (Thr231/Ser232) in NIH/3T3 cells (containing endogenous MLKL) transfected with RIPK3 or La-RIPK3. Like cells treated with TNFα and zVAD (TZ), a necroptosis inducer, cells with active La-RIPK3 showed pRIPK3 puncta formation and sickened spherical cell morphology (Fig. 3A). In contrast, CC-transfected cells showed light-dependent mCherry puncta formation but not RIPK3 phosphorylation or sickened cell morphology (Sup. Fig. 4A). RIPK3 expression alone, either under light or dark, induced 25% pRIPK3 puncta formation or sickened cell morphology (Fig. 3B, Sup. Fig. 4A–B).
Figure 3: La-RIPK3 activation induces RIPK3 kinase-dependent cytokine production and MLKL-dependent membrane rupture.

A. Immunofluorescence staining against phosphor-RIPK3(Thr231/Ser232) in pharmacologically treated (TNF+zVAD) mCherry-RIPK3-expressing NIH/3T3 cells (left), La-RIPK3-expressing NIH/3T3 cells in dark (middle) and 3 h light (right). Transiently transfected cells were recognized by mCherry fluorescence (red channel, top). Levels of phosphor-RIPK3 were probed with Alexa Fluor 488 labeled secondary antibody (Green channel, middle). Overlaid images of red, green, and DAPI (cell nucleus staining) channels are presented at the bottom row. B. Analysis of pRIPK3 puncta formation under various conditions. The whole panel of representative images is shown in (Sup. Fig. 4A–B). The percentage of pRIPK3 puncta-positive cells was calculated using the equation (numbers of pRIPK3 puncta containing cells/total number of transfected cells) * 100%. C. Western blot analysis of phosphor-La-RIPK3, pan-La-RIPK3, caspase8, caspase3, and GAPDH in lentivirus-transduced cells expressing La-RIPK3 under various conditions. The RIPK3 kinase inhibitor (R3i, GSK’843) was treated with 3 μM. D. Quantification of phosphor-La-RIPK3 level (top) and cleaved caspase8 (bottom) in conditions listed in (C). E. The mRNA levels of Cxcl1 (top) and Cxcl8 (bottom) were quantified via qPCR in La-RIPK3 transduced HT-29 cells in various conditions. The normalizer gene was h36B4. F. Western blot analysis of MLKL expression in wild-type and HT-29(MLKL-KO) cells. G. Kinetics of membrane rupture in HT-29 cells with MLKL depletion or intact, transiently transfected with La-RIPK3 or CC. The percentage was calculated using the equation: (numbers of SytoxGreen-stained cells/numbers mCherry transfected cells) * 100%. Cells were illuminated with continuous blue light (< 0.5 mW/cm2) in an environmentally controlled chamber for 10 h. H. The endpoint quantification of light-induced cell rupture in La-RIPK3-transfected HT-29 cells, transiently, with or without pan-caspase inhibitor (zVAD, 20 μM) treatment. Cells were illuminated with 50ms blue light (34mW) at 5 min intervals for 22 h in an environmentally controlled chamber. Cells in (A-E) were illuminated with blue LED (465 nm, 0.6 mW/cm2, 15 s on/off). Data for qPCR analysis represent the mean ± SEM. Bars represent the mean ± SD in (B), (D), (G), and (H). The black number near each pair of bars indicates the P value (two-tailed t-test).
To determine if RIPK1 colocalizes with RIPK3-containing necrosomes, we performed co-immunostaining against RIPK3 and RIPK1. NIH/3T3 cells expressing mCh-RIPK3 alone showed less than 10% colocalization with RIPK1 in both light and dark. TZ treatment significantly increased the colocalization rate to approximately 60%. La-RIPK3 activation increased the colocalization rate to 35% compared to cells kept in the dark (Sup. Fig. 4C–D). However, phosphor-RIPK1 colocalizes with RIPK3 in TZ-treated cells but stays diffusive irrespective of the La-RIPK3 activation state (Sup. Fig. 4E–F).
La-RIPK3 activation involves minimal cleavage of caspases 8 and 3
RIPK3 can activate both MLKL-driven necroptosis and FADD-mediated apoptosis following viral infection [45]. To further characterize apoptosis, we probed caspases 8 and 3 cleavage in HT-29 cells expressing La-RIPK3 using Western blot. First, we confirmed that exposure to blue light (0.5 mW/cm2) in HT-29 cells expressing La-RIPK3 resulted in upregulation of phosphor-RIPK3. When treated with a RIPK3 kinase inhibitor (R3i), GSK’843 [46], the light-induced phosphor-RIPK3 level was significantly reduced (Fig. 3C, top two rows, Fig. 3D, top). However, we only observed a faint band at the size of cleaved caspase 8 (Fig. 3C, third row), and this level is not significantly different across all conditions (Fig. 3D, bottom). Additionally, no detectable caspase 3 cleavage was observed in any condition (Fig. 3C, fourth row from the top). These results indicate that La-RIPK3 activation elicits a minimal level of apoptosis and prefers to activate the necroptosis signaling axis in HT-29 cells.
La-RIPK3 induces kinase-dependent gene expression and MLKL-mediated plasma membrane rupture in HT-29 cells
To further define the downstream signaling outcomes of La-RIPK3 activation, we determine the gene expression of typical inflammatory cytokines. As expected, La-RIPK3 increased the production of Cxcl1 and Cxcl8 (Fig. 3E) in a kinase-dependent way. The rupture of the plasma membrane during RIPK3-mediated necroptosis is regulated by MLKL, the executioner protein and a known substrate of RIPK3. To determine if MLKL mediates La-RIPK3-induced membrane rupture, we deleted MLKL by CRISPR-knockout and created a stable HT-29 cell line, HT-29(MLKL-KO) (Fig. 3F). Compared to WT HT-29 cells, the plasma membrane rupture rate in HT-29(MLKL-KO) dropped by more than 60% after La-RIPK3 activation (Fig. 3G), confirming MLKL-mediated membrane rupture. We further confirmed that such membrane rupture results from necroptosis instead of apoptosis because the treatment of apoptosis inhibitor (zVAD) did not affect the cell membrane rupture rate (Fig. 3H). Additionally, MLKL knockout significantly reduced the transcript (Sup. Fig. 5A) and protein level (Sup. Fig. 5B) of CXCL8, consistent with previous findings that MKLK is partially responsible for cytokine induction during necroptosis [4].
La-RIPK3-activated necroptosis promotes monocyte migration
To determine if light activation of La-RIPK3 can induce chemotactic migration of immune cells, we performed a monocyte (THP1 cell) trans-well migration assay [47] (Fig. 4A). As expected, compared to the dark control, the conditioned medium from La-RIPK3-activated HEK293T cells increased THP1 cell migration approximately 2-fold compard to controls(Fig. 4B). Conditioned medium from CC-transfected cells caused approximately 4% migration rate, either in light or dark medium, which was likely due to the effect of serum (Fig. 4B). Enzyme-linked immunosorbent assay (ELISA) confirmed that La-RIPK3 activation increased the level of CXCL8 in the conditioned medium (Fig. 4C). Western blot analysis showed a higher level of High-Mobility-Group-Box 1 (HMGB1), a common damage-associated molecular pattern (DAMP) molecule [48], in the supernatant of La-RIPK3-activated HEK293T cells than controls (Fig. 4D). Therefore, we confirmed that La-RIPK3 activation triggered chemotactic migration of THP1 cells, likely due to the synergistic effect of DAMPs leakage and active secretion of a pool of proinflammatory cytokines from the necroptotic cells.
Figure 4: Conditioned medium from La-RIPK3-activated cells induces THP1 cell migration.

A. Schematic of undifferentiated THP1 cell trans-well migration assay. B. The percentage of migrated THP1 cells was calculated using the equation: (total number of migrated cells / total number of plated cells) * 100%. HT-29 cell conditioned medium was obtained from different conditions, including the lentivirus-transduced cells expressing La-RIPK3 or CC treated with blue light (0.5 mW/cm2, 15 s on/off) or kept in the dark for 12 h. C. Quantification of secreted CXCL8 in the conditioned medium of La-RIPK3-transduced HT-29 cells in panel (B). D. Western-blot analysis of HMGB1 level in the conditioned medium of HEK293T cells, transiently transfected with La-RIPK3 or CC in dark or light for 12 h. The black number near each pair of horizontal bars indicates the P value (two-tailed t-test).
Spatial control of RIPK3-mediated necroptosis using user-defined patterned illumination
To further demonstrate the spatial accuracy for optogenetic induction of necroptosis, we applied patterned illumination by integrating a spatial light modulator into an epi-illumination microscope equipped with an environmental chamber. This system allows for user-defined spatial patterns by projecting light through an array of digital micromirror devices (DMD). We created a 2×2 checker board illumination pattern where cells in the diagonal axis are illuminated, whereas cells in the antidiagonal axis were kept in the dark. HT-29 cells were transduced with lentivirus encoding La-RIPK3, followed by fluorescence-activated cell sorting (FACS) to enrich La-RIPK3 expressing cells based on the mCherry expression level. Cells were intermittently stimulated every 5 minutes for 13.5 hours. Cell death (SytoxGreen positive) was initiated in the two diagonal regions of interest (ROIs) after 4.5 h of light illumination. By the end of the data acquisition, the majority of cells in the diagonal ROIs underwent necroptosis. In contrast, cells in the antidiagonal ROIs remained viable. The overlaid bright-field images show distinct cell morphology for cells in the illuminated and dark ROIs. Necroptotic cells show balled-up morphology with rupture membranes, whereas viable cells in the dark ROIs maintain a stretched shape and smooth cell-cell contact (Fig. 5A, Supplementary Movie 1). As a negative control, HT-29 cells transduced with CC (no RIPK3) showed no detectable cell death under the same illumination pattern, excitation power, and duration (Fig. 5B).
Figure 5: Spatiotemporal induction of plasma membrane rupture in La-RIPK3-transduced HT-29 cells.

A. HT-29 cells transduced with lentivirus carrying La-RIPK3 were treated with SytoxGreen and stimulated with spatially patterned light in an environmentally controlled chamber. To spatially pattern the illumination area (2×2 grid, left top and bottom right boxes are the “light-on” area), the Mightex Polygon1000-G coupled with the GFP and TXR filter was used. The grid was created using the Mightex software (PolyScan2) using the PolyScan2 sequence profiler. Before cell stimulation, cells were imaged with a wide field (left column). Cells were exposed to spatially patterned light delivered through a 10× objective in GFP (55 ms exposure time) and TXR (100 ms exposure time) channels together with a wide-field illumination from a transmitted bright-field light source every 5 minutes for 13.5 h (middle columns), then imaged with the final wide field (right column). During all imaging sessions, bright field light was not spatially patterned. B. HT-29 cells transduced with lentivirus carrying CC were treated with SytoxGreen and similarly illuminated and imaged as in (A). Scale bar: 20 μm.
Transcriptomic analysis of La-RIPK3-activated HT-29 cells
As noted before, Ccl2 expression was differentially regulated by TNFα and La-RIPK3, indicating that its expression is more likely regulated by complex-I rather than the necrosome (Sup. Fig. 2E). Furthermore, La-RIPK3 and TNFα showed distinct potency for upregulating Cxcl2 and Cxcl8 (Sup. Fig. 2A–B). To gain deeper insights into La-RIPK3’s regulation on gene expression, we performed a transcriptomic analysis to identify differentially expressed genes (DEGs) in HT-29 cells. Cells were freshly transduced with the corresponding lentivirus before sample preparation for RNA-seq. RNA samples were treated with DNase to remove genomic DNA. We also compared gene regulation between La-RIPK3 activation and pharmacological induction of necroptosis using a published dataset (accession number GSE 108621).
DEGs analysis revealed up-regulation of 114 genes in oligomerization-induced La-RIPK3 activation (Fold-change >1.2, padj <0.05), 1887 genes in TSZ treatment (Fold-change >1.5, padj <0.01), and 254 genes in TNFα treatment (Fold-change >1.5, padj <0.05). La-RIPK3 activation and TSZ treatment induce gene expression involved in inflammatory processes, such as oxidative stress, legionellosis, ferroptosis, and Ebola virus infection. In contrast, commonly upregulated genes common to La-RIPK3 activation and TNFα treatment cover the Corticotropin-Releasing Hormone (CRH) signaling pathway, cell migration, and humoral/innate immune responses. Notably, 36% (41 out of 114) genes are commonly upregulated by La-RIPK3 and TSZ, whereas 15% (17 out of 114) genes are commonly upregulated by La-RIPK3 and TNFα, indicating La-RIPK3 activation better resembles TSZ than TNFα treatment. However, La-RIPK3 activation elicits a unique set of genes compared to these chemical inducers (Fig. 6A).
Figure 6. Transcriptomic analysis reveals distinct genes and pathways in HT-29 cells expressing La-RIPK3 under various treatments.
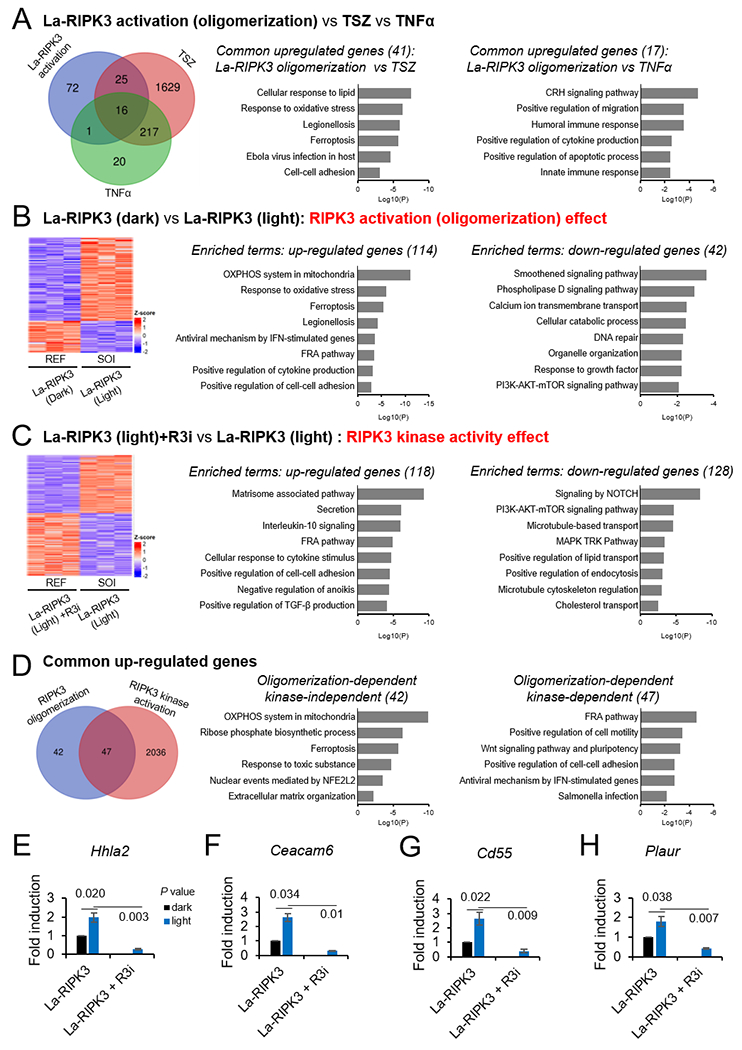
A. Left: Venn diagram of the upregulated genes in three pairwise comparisons: 1) La-RIPK3 oligomerization (La-RIPK3+Light vs. La-RIPK3+Dark), 2) TSZ (TSZ vs. DMSO), 3) TNFα (TNFα vs. DMSO). Right: Enrichment analysis of common upregulated genes ranked by the Log10(P-value). B. Left: Heatmap of upregulated and downregulated genes treated by La-RIPK3 light (sample of interest or SOI) over La-RIPK3 dark (reference or REF). Right: Enrichment analysis of upregulated and downregulated genes ranked by the Log10(P-value). C. Same as B but with SOI of La-RIPK3 (Light) and REF of La-RIPK3+R3i treatment (GSK’843, 3 μM). D. Analysis of RIPK3’s oligomerization-dependent, kinase-independent and kinase-dependent effect. Left: Venn diagram of RIPK3 oligomerization effect (La-RIPK3 Dark vs. La-RIPK3 Light) and RIPK3 kinase effect (La-RIPK3 Light+R3i vs. La-RIPK3 Light). The La-RIPK3 in light is the common reference. Right: Enrichment analysis of the kinase-independent and kinase-dependent effects of the oligomerized RIPK3. E-H. Cell-cell adhesion was one of the common processes identified in A, B, C, and D. Validation of mRNA levels of Hhla2, Ceacam6, Cd55, and Plaur by qRTPCR. The P values (two-tailed t-test) are black numbers near each horizontal bar of sample pairs. Error bars represent the mean ± SEM.
Next, we focus on the comparison between two conditions: La-RIPK3 Light vs. La-RIPK3 Dark and La-RIPK3 Light vs. La-RIPK3 light + R3i. The former comparison will yield insights into La-RIPK3 activation (oligomerization)-regulated gene expression, whereas the latter delineates the effects of RIPK3 kinase activity. DEGs analysis of La-RIPK3 Light vs. La-RIPK3 Dark revealed up-regulation of 114 genes (Fold-change >1.2 and padj <0.05) and down-regulation of 42 genes (Fold-change < 0.8 and padj <0.05) (Fig. 6B). Upregulated genes involve processes such as oxidative phosphorylation, ferroptosis, and response to oxidative stress, consistent with RIPK3’s ability to induce reactive oxygen species [49, 50]. Down-regulated processes include cell survival pathways and metabolic homeostases, such as the smoothened pathway, phospholipase D pathway, cellular catabolic process, and PI3K-AKT-mTOR pathway.
To further explore the effect of RIPK3 kinase activity, we compared La-RIPK3 Light and La-RIPK3 Light + R3i (GSK’843, 3 μM) (Fig. 6C) . A total of 118 genes were upregulated (Fold-change > 2.0, padj <0.05), and 128 genes were down-regulated (Fold-change < 0.5, padj <0.05). Several inflammatory processes, such as secretion, IL-10 signaling, cellular response to cytokine stimulus, and TGF-β production, were upregulated by La-RIPK3. Notably, RIPK3 kinase inhibition does not change the mRNA level of genes involved in oxidative phosphorylation, ferroptosis, and response to oxidative stress. On the other hand, cell survival and proliferation-related processes, including the notch pathway, metabolic processes, the MAPK cascade, and the mTOR pathway, were downregulated (Fig. 6C). Interestingly, activation of these cell survival pathways, such as Notch [51], mTOR [52, 53], or MAPK pathway [54], suppresses necroptosis. Our results suggest that the activity of La-RIPK3 conversely suppresses these survival pathways.
A side-by-side comparison between La-RIPK3 Light versus La-RIPK3 Dark (Fig. 6B) and La-RIPK3 Light versus La-RIPK3 Light + R3i La-RIPK3 (Fig. 6C) revealed only 22 commonly upregulated genes (Sup. Fig. 6), representing 19% out of 114 genes. To ensure that genes were not excluded because of the stringent threshold, we set the La-RIPK3 Light as a common reference set and included genes that were below 0.8 fold change (Fold-change < 0.8, padj <0.05) in La-RIPK3 Dark and La-RIPK3 Light+R3i, increasing the number of genes affected by the kinase inhibitor from 118 to 2083. Although the number of overlapped genes increases to 53% (47 out of 89), 42 genes stay in the non-overlapped pool, indicating these genes might be regulated in a RIPK3-oligomerization-dependent but kinase-independent way (Fig. 6D), or they might be more resistant for R3i treatment at the current dosage (GSK’843, 3 μM). Gene ontology analysis of these 42 genes indicates processes related to energy production and stress response, such as oxidative phosphorylation in mitochondria, ferroptosis, response to toxic substances, and nuclear events mediated by NFE2L2. As expected, the 47 common genes are involved in signal transduction and immunogenic responses, such as the FRA (Fos-related antigen) pathway, Wnt signaling, antiviral response, and salmonella infection (Fig. 6D).
Notably, upregulation of cell-cell adhesion was found in several comparisons, including those commonly upregulated in La-RIPK3 activation and TSZ treatment (Fig. 6A), La-RIPK3 activation (oligomerization) (Fig. 6B),and kinase activity (Fig. 6C–D). We thus confirmed RNA-seq results by qRTPCR analysis of four representative genes, Hhla2 (HERV–HLTR-associating 2), Ceacam6 (carcinoembryonic antigen cell adhesion molecule 6), Cd55 (cluster of differentiation 55), and Plaur (plasminogen activator urokinase receptor), under La-RIPK3 activation and kinase inhibition. All four genes were upregulated upon La-RIPK3 activation in HT-29 cells, significantly reduced under RIPK3 inhibitor treatment (Fig. 6E–H). We speculate that RIPK3 oligomerization could positively regulate cell-cell contact or elicit paracrine signaling, which is investigated in an ongoing follow-up study. Results from this transcriptomic analysis highlight gene expression specifically regulated through RIPK3 oligomerization and kinase activity in HT-29 cells.
DISCUSSION
In this work, we developed La-RIPK3 by screening 9 systems based on cryptochrome and AuLOV variants and selected CRY2olig as the oligomerization module. Although several optogenetic systems were developed that induce lytic cell death, for example, by oligomerizing RIPK1 [25], RIPK3 [25, 26], and MLKL [25–27], comparative analysis between different optogenetic protein variants is lacking. For example, Arabidopsis thaliana CRY2PHR was used to induce oligomerization of RIPK1, RIPK3, and MLKL [25], whereas CRY2olig (cryptochrome E490G) was used to caspase, GSDMD, RIPK3, MLKL [26]. Additionally, Previous work focused on the induction of plasma membrane rupture instead of cytokine production, the distinct feature underlying the potent immunogenicity of necroptosis. Our screening criteria used a framework that assessed the dynamic range and basal activity in inducing cytokine production and plasma membrane rupture. Although different model systems and functional readouts may vary depending on the applications, we recommend following a similar assessment procedure to select optimal optogenetic systems. Besides the selected La-RIPK3 system, this work also developed a variety of other optogenetic RIPK3 systems, each blessed with tunable potency of necroptosis induction, that could serve as a wide range of benchmarks to calibrate the correlation between necrosomal morphology (e.g., spherical or rod-shaped) and necroptotic signaling outcomes [55]. We noted enhanced basal activity in cytokine production and membrane rupture, even in dark conditions in all optogenetic systems. However, such basal activity is likely attributed to the effect of RIPK3 overexpression, which could induce RIPK3 oligomerization through its RHIM domain instead of the spillover effect of photoactivatable proteins. Indeed, RIPK3 overexpression induces a higher fold induction than all optogenetic RIPK3 systems (Fig. 2A). This effect was similarly observed in the plasma membrane rupture rate, although RbA and RCC induce a higher rupture rate than RIPK3 expression (Fig. 2B). RIPK3 oligomerization and phosphorylation play a role in recruiting partner proteins in necroptosis signaling. Both TZ- and La-RIPK3-induced necroptosis caused the formation of necrosomes containing phosphor-RIPK3 (Sup. Fig. 4A), likely through RIPK3 autophosphorylation. RIPK1 is typically considered an upstream regulator for necrosome formation in the canonical necroptosis pathway [14]. Indeed, when RIPK3-expressing NIH/3T3 cells were treated with TZ, more than 60% of RIPK3 granules were co-stained by antibodies against RIPK1 (Sup. Fig. 4C–D). On the other hand, evidence suggests that RIPK1 can work downstream of RIPK3 because RIPK3-driven necrosome can recruit RIPK1 [36] to promote the expression of inflammatory genes and immune responses [5]. Our result supports this idea because RIPK1 colocalizes with La-RIPK3 granules after blue light stimulation, likely via interactions of their RHIM domains, which is required for activation of downstream pathways (Sup. Fig. 4C–D). However, the distribution of phosphor-RIPK1 was different between TZ- and La-RIPK3-induced necroptosis – In TZ-treated cells, phosphor-RIPK1 colocalized with RIPK3 (Sup. Fig. 4E–F, column RIPK3+TZ), whereas phosphor-RIPK1 was diffusive irrespective of the La-RIPK3 activation state (Sup. Fig. 4E). A previous study showed that RIPK3 phosphorylates RIPK1 in complex-I and attenuates TNFα-induced NF-κB activation. [56] Our results suggest that oligomeric RIPK3 per se does not phosphorylate RIPK1 in the cell, but RIPK3 functionality might depend on its subcellular localization, e.g., when associated with the complex I or in a necrosome. This difference in phosphor-RIPK1 necrosomal distribution between TZ-treated and La-RIPK3-activated HT-29 cells might underpin the minimal apoptosis activation in the latter case because RIPK1 can function as an apoptosis adaptor downstream of RIPK3 [45, 57, 58].
La-RIPK3-induced cell death requires MLKL, the downstream executioner protein, as the knockout of MLKL reduced the plasma membrane rupture rate significantly in HT-29 cells. The slight residual plasma membrane rupture in MLKL-KO suggests that RIPK3 could function in an MLKL-independent way, a scenario reported in several studies. For example, in RNA-editing enzyme adenosine deaminase acting on RNA 1 (ADAR1) mutant mice, RIPK3 causes partial cell death downstream of ZBP1 in the absence of MLKL [59]. Deletion of Mlkl and Casp8, but not Mlkl alone, protects immortalized MEF cells from ZBP1-RIPK3-dependent cell death [60]. On the other hand, MLKL can also function independently of RIPK3. For example, MLKL drives the lectin concanavalin A (ConA)-induced hepatocyte necroptosis in a RIPK3-independent way [61, 62]. In kidney ischemia-reperfusion injury (IRI) and from TNFα-induced severe inflammatory response syndrome (SIRS), two models of RIPK3-dependent injury, MLKL-KO mice were protected at a level that is statistically significant exceeding that of RIPK3-deficient mice [63]. Our work and previous studies demonstrated complex interdependence between RIPK3 and MLKL in regulating cell death signaling pathways.
Compared with the well-established canonical TNF-induced necroptosis, La-RIPK3 activation similarly upregulates the expression of mRNAs encoding inflammatory chemokines, e.g., Cxcl1, Cxcl2, and Cxcl8. However, certain chemokines, such as Ccl2, specifically respond to TNF stimulation but not La-RIPK3 activation. This difference highlights that La-RIPK3 allows delineation of signaling roles of the RIPK3-centric necrosomes. Transcriptomic analysis reveals that La-RIPK3 activation in HT-29 cells upregulates partially overlapped genes as TSZ treatment. La-RIPK3 activation also downregulates pro-survival pathways such as the Notch, PI3K-AKT-mTOR, and MAPK pathways. However, a distinct pool of genes was upregulated in a RIPK3-specific way compared to TSZ treatment.
Intriguingly, within the scope of RIPK3-regulated genes, a unique pool of genes seems to be regulated in a RIPK3 kinase-independent way, indicating diverging routes of gene regulation from RIPK3 (oligomerization- and kinase-dependent). Indeed, RIPK3 oligomerization could occur independently of its kinase activity, as shown by recent super-resolution imaging work [55]. The enriched terms associated with kinase-independent roles concern energy production, stress response, and nuclear events mediated by nuclear factor erythroid 2 like 2 (NFE2L2). This finding is consistent with RIPK3’s involvement in aerobic metabolism [50, 64, 65], as well as its role in kidney inflammation via NRF2 (encoded by NFE2L2) [66]. However, whether such processes were regulated independently of RIPK3 kinase activity is unclear. It is also possible that kinase-dependent and independent pathways could co-regulate certain cell processes. For example, ferroptosis can be sensitized upon RIPK3 kinase inactivation in mice [67] but can also be triggered by RIPK3 kinase activity through the inactivation of Ferroptosis-Suppressor-Protein 1 (FSP1) [68]. Finally, we recognize that different genes could display different resistance or sensitity to kinase inhibitor treatment. Transcriptomics analysis from dose-dependent RIPK3 kinase inhibitor treatment and kinase-dead mutants of RIPK3 is required to gain insights into the regulatory role of RIPK3.
Positive regulation of cell-cell adhesion was observed in multiple pair-wise comparisons between La-RIPK3 and TSZ treatment, as well as the kinase-dependent role of RIPK3. Upregulation of the involved genes (e.g., Hhla2, Ceacam6, Cd55, and Plaur) was validated by qRTPCR analysis. Although the function of Hhla2, [69–71] Ceacam6, [72, 73] Cd55, [74, 75] and Plaur [76, 77] genes in cell-cell adhesion and cell-extracellular matrix interaction were discussed, their potential functions in necroptosis were not studied. As HT-29 cells are derived from colonic epithelia with strong cell-cell adhesion to prevent pathogen entry, cell-cell adhesion may play a role in the necroptosis of colon cells. Another consistent finding was the upregulated FRA pathway upon La-RIPK3 activation, likely due to FRA-mediated gene expression as . However, no studies currently link the FRA pathway with necroptosis, which warrants further investigation.
Immunotherapy has achieved significant efficacy against hematological malignancy (e.g., leukemia, lymphoma, and multiple myeloma) using engineered T cells that recognize cancer-specific antigens. In contrast, solid tumors pose a daunting challenge for immunotherapy because the tumor microenvironment (TME) could create a severely immune-suppressive landscape. Cytokines and chemokines are immune system proteins that can modulate the host immune response toward cancer cells or even directly kill cancer cells. However, direct administration of cytokines and chemokines could lead to systemic inflammation, such as Cytokine Release Syndromes (CRS). The capacity to control necroptosis locally (e.g., through light) could offer an alternative strategy to modulate the immune landscape of TME. Indeed, La-RIPK3 activation significantly increases DAMP levels in the conditional medium, further enhancing monocyte migration in vitro. Inspired by this result, ongoing efforts continue to benchmark the performance of La-RIPK3 in mice models. We expect that a multi-tonged approach synergizing T-cell engineering, checkpoint inhibition, and immuno-landscape finetuning through optogenetic induction of inflammatory lytic cell death would offer an improved prognosis to enhance the outcome of immunotherapy against solid tumors.
METHODS AND MATERIALS
Generation of stable MLKL-Knockout (MLKL-KO) cell lines by CRISPR-KO
For HEK293T cells, MLKL-KO plasmids were chemically transfected (Turbofect) to the cells. Cell media was changed with the complete DMEM medium 4 h post-transfection, followed by the selection medium containing 2 μg/mL puromycin 48 h post-transfection. After six days of puromycin selection, the resulting cells were used for downstream assays. To knock out MLKL in HT-29 cells, MLKL gRNA and Cas9 encoding lentivirus were packaged from HEK293T cells and transduced to HT-29 cells. After seven days of transduction (five days of puromycin selection), resulting cells were used for downstream assays. The gRNA sequences for MLKL knockout used in this study were TTGAAACGGGATATCTCCAG and ATCCCCGTGGATTCTGCTAA.
Live cell imaging
For the light-mediated formation of protein puncta, HEK293T cells were transfected with CRY2clust (CC) and CRY2Clust-RIPK3 (CCR) and recovered for 24 h before fluorescence imaging. An epi-illumination inverted fluorescence microscope (Leica DMI8) with a 40× objective and light-emitting diode illuminator (SOLA SE II 365) was used to image transfected cells. Cells were stimulated with blue light using the GFP filter cube (Leica, excitation filter 472/30, dichroic mirror 495, and emission filter 520/35, 500 ms exposure). Protein puncta (mCherry-tagged CC and CCR) was imaged before and after blue light treatment using the Texas Red filter cube (Leica, excitation filter 560/40, dichroic mirror 595, and emission filter 645/75, 200 ms exposure).
Wide-field blue light stimulation
Cells were exposed to intermittent blue light (455 nm, 0.4-0.6 mW/cm2,15 second on/off duration) stimulation from the home-built blue-light stimulator using 6, 12, 24, or 36 blue LEDs (Chanzon, AA0049) installed on a breadboard (Elegoo) powered by a tunable power supply (Eventek, KPS3010D). The cell plate was placed on a light diffuser approximately 2.5 inches above LEDs in a 5% CO2 incubator.
Cell death assay by SytoxGreen chromosome counterstain
SytoxGreen staining was performed immediately after light stimulation. Specifically, 10× stock solution (2.5 μM) of SytoxGreen was prepared in HBSS. If needed, Hoechst 33342 nuclear stain was supplemented to this 10× SytoxGreen solution to make 10× SytoxGreen/Hoechst solution (2.5 μM SytoxGreen and 50 μg/mL Hoechst). Cells were stained by applying the 10× staining solution dropwise to cell culture media, followed by 10-30 min incubation in a 5% CO2 incubator. For the co-culture experiment, the resuspended non-transfected wild-type cells were stained with CellTracker-DeepRed (5 μM) for 45 min at 37 °C, washed 3 times with DPBS, and co-cultured with the resuspended target cell constructs for 24 h, prior to the application of SytoxGreen solution. Fluorescence images of stained cells were acquired by an epi-illumination inverted fluorescence microscope (Leica DMI8) equipped with a 10× objective using GFP, TXR, Cy5, and DAPI filters. If needed, environmental control for long-term imaging was set prior to the initiation of imaging. High-throughput imaging and analysis were performed on an ImageXpress Pico (Molecular Devices) imaging station.
Quantification of lytic cell death
Cell counting was performed by Cellprofiler [78]. IdentifyPrimaryObjects was used as a module to identify SytoxGreen and mCherry positive cells through color-coding of green, magenta, and yellow. Green signifies the counted objects, while magenta and yellow signify discarded objects. Advanced settings were used, and “global” was selected as a threshold strategy to calculate a single threshold value based on the foreground and background pixels. Furthermore, Otsu-aided automatic image thresholding, which calculates additional thresholds, was used to minimize variance within each class. The calculated threshold was adjusted for each construct via the “threshold correction factor” between values 0 and 1, where a smaller value indicated a more lenient threshold. The percentage of primary cell death was calculated as
RNA-seq
HT-29 cells transduced with LaRIPK3-encoding lentivirus were stimulated with intermittent blue light for 12 h (455 nm, 0.5-0.7 mW/cm2, 15 s on and 15 off) controlled by Arduino. Three biological replicates were prepared for each condition. Total RNA was extracted using the RNA purification kit and treated with DNase for 1 h in a 37 °C incubator, followed by re-purification of RNA. Finally, the integrity of each RNA sample (300 ng) was assayed through 1% Bleach agarose gel with ethidium bromide. Further quality checks of RNA (AATI Fragment Analyzer), PolyA-selected mRNA library construction, MiSeq Titration, and RNA-seq (NovaSeq SP lane 100 nt single-read) were carried out in the UIUC Roy J. Carver Biotechnology Center. The read counts were quantified using Salmon (version 1.9.0)[79] indexed with Genome assembly GRCh38.p14 (NCBI RefSeq Sequence GRCh38.p14.GCF_000001405.40). The count quant.sf files were analyzed using the R package DESeq [https://github.com/hbctraining/DGE_workshop_salmon]. Lists of up or down-regulated genes from differentially expressed genes (DEGs) analysis were piped to the “Metascape” for cellular pathway and process enrichment analysis [80]. The raw data and processed files are accessible at NCBI GEO database, accession GSE268650.
THP-1 trans-well migration assay
Conditioned media from HEK293T cells under various treatments were collected, followed by centrifugation at 500 rpm for 5 minutes to remove cell debris. The THP-1 human monocytes (less than 10 passages) were plated in 5 μm trans-well inserts on the 24-well plate at a density of 200,000 cells/well. In the bottom chamber of the 24-well plate, different conditioned medium was pipetted into the bottom chamber. Migration was allowed to proceed for 4 hours in the mammalian cell culture incubator. The bottom chamber medium was transferred to 1.5 ml tubes, followed by centrifugation at 500 rpm for 5 minutes. After removing the supernatant, 40 μL of DPBS was added into each tube to resuspend the migrated THP1 cells. The numbers of migrated THP1 cells were counted by the automated cell counter (Applied Biosystems, Countess 3).
Patterned light stimulation through a spatial light modulator
For all blue light stimulation, the cells were stimulated using a GFP filter cube (Leica, excitation filter 472/30, dichroic mirror 495, and emission filter 520/35, 70 ms exposure). For intermittent spatial illumination of blue light, the Mightex Polygon1000-G coupled with the GFP filter was used. Using the Mightex software (PolyScan2), a 2×2 grid was created with stimulated/unstimulated areas using the PolyScan2 sequence profiler. Of these areas, individual ROIs were selected using the LAS-X (Leica) Mark and Find feature. Before cell stimulation (t=0 h), cells were imaged with no grid in the wide field. Cells were exposed to the grid every 5 minutes for 13.5 hours, then imaged with no grid in the wide field.
Statistical analysis
P-values were determined by performing a two-tailed, unpaired t-test using GraphPad Prism.
Supplementary Material
ACKNOWLEDGEMENTS
This work is supported by the National Institute of General Medical Sciences (R01GM132438) and National Institute of Mental Health (R01MH124827) of the National Institutes of Health, National Science Foundation (2121003 and 2243257, the National Science Foundation Science and Technology Center for Quantitative Cell Biology), and Cancer Center at Illinois (CCIL) (K.Z.). We thank Roy J. Carver Biotechnology Center (CBC) for RNA-seq service and flow cytometry.
Footnotes
CONFLICT OF INTEREST
The authors declare no potential conflict of interest.
DATA AVAILABILITY STATEMENT
The raw data and processed files are accessible at NCBI GEO database, accession GSE268650.
References
- [1].Fogarty CE, Bergmann A. The Sound of Silence: Signaling by Apoptotic Cells. Curr Top Dev Biol. 114 (2015) 241–265. [DOI] [PMC free article] [PubMed] [Google Scholar]
- [2].Vanden Berghe T, Linkermann A, Jouan-Lanhouet S, Walczak H, Vandenabeele P. Regulated necrosis: the expanding network of non-apoptotic cell death pathways. Nat Rev Mol Cell Biol. 15 (2014) 135–147. [DOI] [PubMed] [Google Scholar]
- [3].Degterev A, Huang Z, Boyce M, Li Y, Jagtap P, Mizushima N, et al. Chemical inhibitor of nonapoptotic cell death with therapeutic potential for ischemic brain injury. Nat Chem Biol. 1 (2005) 112–119. [DOI] [PubMed] [Google Scholar]
- [4].Zhu K, Liang W, Ma Z, Xu D, Cao S, Lu X, et al. Necroptosis promotes cell-autonomous activation of proinflammatory cytokine gene expression. Cell Death Dis. 9 (2018) 500. [DOI] [PMC free article] [PubMed] [Google Scholar]
- [5].Yatim N, Jusforgues-Saklani H, Orozco S, Schulz O, Barreira da Silva R, Reis e Sousa C, et al. RIPK1 and NF-kappaB signaling in dying cells determines cross-priming of CD8(+) T cells. Science. 350 (2015) 328–334. [DOI] [PMC free article] [PubMed] [Google Scholar]
- [6].Li S, Ning LG, Lou XH, Xu GQ. Necroptosis in inflammatory bowel disease and other intestinal diseases. World J Clin Cases. 6 (2018) 745–752. [DOI] [PMC free article] [PubMed] [Google Scholar]
- [7].Zhang S, Tang MB, Luo HY, Shi CH, Xu YM. Necroptosis in neurodegenerative diseases: a potential therapeutic target. Cell Death Dis. 8 (2017) e2905. [DOI] [PMC free article] [PubMed] [Google Scholar]
- [8].Caccamo A, Branca C, Piras IS, Ferreira E, Huentelman MJ, Liang WS, et al. Necroptosis activation in Alzheimer’s disease. Nat Neurosci. 20 (2017) 1236–1246. [DOI] [PubMed] [Google Scholar]
- [9].Balusu S, Horre K, Thrupp N, Craessaerts K, Snellinx A, Serneels L, et al. MEG3 activates necroptosis in human neuron xenografts modeling Alzheimer’s disease. Science. 381 (2023) 1176–1182. [DOI] [PMC free article] [PubMed] [Google Scholar]
- [10].Cho YS, Challa S, Moquin D, Genga R, Ray TD, Guildford M, et al. Phosphorylation-driven assembly of the RIP1-RIP3 complex regulates programmed necrosis and virus-induced inflammation. Cell. 137 (2009) 1112–1123. [DOI] [PMC free article] [PubMed] [Google Scholar]
- [11].Sun L, Wang H, Wang Z, He S, Chen S, Liao D, et al. Mixed lineage kinase domain-like protein mediates necrosis signaling downstream of RIP3 kinase. Cell. 148 (2012) 213–227. [DOI] [PubMed] [Google Scholar]
- [12].Dondelinger Y, Declercq W, Montessuit S, Roelandt R, Goncalves A, Bruggeman I, et al. MLKL compromises plasma membrane integrity by binding to phosphatidylinositol phosphates. Cell Rep. 7 (2014) 971–981. [DOI] [PubMed] [Google Scholar]
- [13].Vanden Berghe T, Hassannia B, Vandenabeele P. An outline of necrosome triggers. Cell Mol Life Sci. 73 (2016) 2137–2152. [DOI] [PMC free article] [PubMed] [Google Scholar]
- [14].Seo J, Nam YW, Kim S, Oh DB, Song J. Necroptosis molecular mechanisms: Recent findings regarding novel necroptosis regulators. Exp Mol Med. 53 (2021) 1007–1017. [DOI] [PMC free article] [PubMed] [Google Scholar]
- [15].Weinlich R, Oberst A, Beere HM, Green DR. Necroptosis in development, inflammation and disease. Nat Rev Mol Cell Biol. 18 (2017) 127–136. [DOI] [PubMed] [Google Scholar]
- [16].Upton JW, Kaiser WJ, Mocarski ES. DAI/ZBP1/DLM-1 complexes with RIP3 to mediate virus-induced programmed necrosis that is targeted by murine cytomegalovirus vIRA. Cell Host Microbe. 11 (2012) 290–297. [DOI] [PMC free article] [PubMed] [Google Scholar]
- [17].Kaiser WJ, Sridharan H, Huang C, Mandal P, Upton JW, Gough PJ, et al. Toll-like receptor 3-mediated necrosis via TRIF, RIP3, and MLKL. J Biol Chem. 288 (2013) 31268–31279. [DOI] [PMC free article] [PubMed] [Google Scholar]
- [18].He S, Liang Y, Shao F, Wang X. Toll-like receptors activate programmed necrosis in macrophages through a receptor-interacting kinase-3-mediated pathway. Proc Natl Acad Sci U S A. 108 (2011) 20054–20059. [DOI] [PMC free article] [PubMed] [Google Scholar]
- [19].Oh TJ, Fan H, Skeeters SS, Zhang K. Steering Molecular Activity with Optogenetics: Recent Advances and Perspectives. Adv Biol (Weinh). 5 (2021) e2000180. [DOI] [PMC free article] [PubMed] [Google Scholar]
- [20].Liu R, Fang M, Chen X, Yang Y. The status and challenges of optogenetic tools for precise spatiotemporal control of RNA metabolism and function. Clin Transl Med. 12 (2022) e1078. [DOI] [PMC free article] [PubMed] [Google Scholar]
- [21].Fischer AAM, Kramer MM, Radziwill G, Weber W. Shedding light on current trends in molecular optogenetics. Curr Opin Chem Biol. 70 (2022) 102196. [DOI] [PubMed] [Google Scholar]
- [22].Mazraeh D, Di Ventura B. Synthetic microbiology applications powered by light. Curr Opin Microbiol. 68 (2022) 102158. [DOI] [PubMed] [Google Scholar]
- [23].Tan P, He L, Huang Y, Zhou Y. Optophysiology: Illuminating cell physiology with optogenetics. Physiol Rev. 102 (2022) 1263–1325. [DOI] [PMC free article] [PubMed] [Google Scholar]
- [24].Fan H, Barnes C, Hwang H, Zhang K, Yang J. Precise modulation of embryonic development through optogenetics. Genesis. 60 (2022) e23505. [DOI] [PMC free article] [PubMed] [Google Scholar]
- [25].He L, Huang Z, Huang K, Chen R, Nguyen NT, Wang R, et al. Optogenetic Control of Non-Apoptotic Cell Death. Adv Sci (Weinh). 8 (2021) 2100424. [DOI] [PMC free article] [PubMed] [Google Scholar]
- [26].Shkarina K, Hasel de Carvalho E, Santos JC, Ramos S, Leptin M, Broz P. Optogenetic activators of apoptosis, necroptosis, and pyroptosis. J Cell Biol. 221 (2022). [DOI] [PMC free article] [PubMed] [Google Scholar]
- [27].Taslimi A, Fields KM, Dahl KD, Liu Q, Tucker CL. Spatiotemporal control of necroptotic cell death and plasma membrane recruitment using engineered MLKL domains. Cell Death Discov. 8 (2022) 469. [DOI] [PMC free article] [PubMed] [Google Scholar]
- [28].Yu X, Sayegh R, Maymon M, Warpeha K, Klejnot J, Yang H, et al. Formation of nuclear bodies of Arabidopsis CRY2 in response to blue light is associated with its blue light-dependent degradation. Plant Cell. 21 (2009) 118–130. [DOI] [PMC free article] [PubMed] [Google Scholar]
- [29].Kennedy MJ, Hughes RM, Peteya LA, Schwartz JW, Ehlers MD, Tucker CL. Rapid blue-light-mediated induction of protein interactions in living cells. Nat Methods. 7 (2010) 973–975. [DOI] [PMC free article] [PubMed] [Google Scholar]
- [30].Bugaj LJ, Choksi AT, Mesuda CK, Kane RS, Schaffer DV. Optogenetic protein clustering and signaling activation in mammalian cells. Nat Methods. 10 (2013) 249–252. [DOI] [PubMed] [Google Scholar]
- [31].Park H, Kim NY, Lee S, Kim N, Kim J, Heo WD. Optogenetic protein clustering through fluorescent protein tagging and extension of CRY2. Nat Commun. 8 (2017) 30. [DOI] [PMC free article] [PubMed] [Google Scholar]
- [32].Taslimi A, Vrana JD, Chen D, Borinskaya S, Mayer BJ, Kennedy MJ, et al. An optimized optogenetic clustering tool for probing protein interaction and function. Nat Commun. 5 (2014) 4925. [DOI] [PMC free article] [PubMed] [Google Scholar]
- [33].Grusch M, Schelch K, Riedler R, Reichhart E, Differ C, Berger W, et al. Spatio-temporally precise activation of engineered receptor tyrosine kinases by light. EMBO J. 33 (2014) 1713–1726. [DOI] [PMC free article] [PubMed] [Google Scholar]
- [34].Nakatani Y, Hisatomi O. Molecular Mechanism of Photozipper, a Light-Regulated Dimerizing Module Consisting of the bZIP and LOV Domains of Aureochrome-1. Biochemistry. 54 (2015) 3302–3313. [DOI] [PubMed] [Google Scholar]
- [35].Chen X, Zaro JL, Shen WC. Fusion protein linkers: property, design and functionality. Adv Drug Deliv Rev. 65 (2013) 1357–1369. [DOI] [PMC free article] [PubMed] [Google Scholar]
- [36].Orozco S, Yatim N, Werner MR, Tran H, Gunja SY, Tait SW, et al. RIPK1 both positively and negatively regulates RIPK3 oligomerization and necroptosis. Cell Death Differ. 21 (2014) 1511–1521. [DOI] [PMC free article] [PubMed] [Google Scholar]
- [37].Orozco SL, Daniels BP, Yatim N, Messmer MN, Quarato G, Chen-Harris H, et al. RIPK3 Activation Leads to Cytokine Synthesis that Continues after Loss of Cell Membrane Integrity. Cell Rep. 28 (2019) 2275–2287 e2275. [DOI] [PMC free article] [PubMed] [Google Scholar]
- [38].Grievink HW, Heuberger J, Huang F, Chaudhary R, Birkhoff WAJ, Tonn GR, et al. DNL104, a Centrally Penetrant RIPK1 Inhibitor, Inhibits RIP1 Kinase Phosphorylation in a Randomized Phase I Ascending Dose Study in Healthy Volunteers. Clin Pharmacol Ther. 107 (2020) 406–414. [DOI] [PubMed] [Google Scholar]
- [39].Samson AL, Zhang Y, Geoghegan ND, Gavin XJ, Davies KA, Mlodzianoski MJ, et al. MLKL trafficking and accumulation at the plasma membrane control the kinetics and threshold for necroptosis. Nat Commun. 11 (2020) 3151. [DOI] [PMC free article] [PubMed] [Google Scholar]
- [40].Varfolomeev E, Blankenship JW, Wayson SM, Fedorova AV, Kayagaki N, Garg P, et al. IAP antagonists induce autoubiquitination of c-IAPs, NF-kappaB activation, and TNFalpha-dependent apoptosis. Cell. 131 (2007) 669–681. [DOI] [PubMed] [Google Scholar]
- [41].Probst BL, Liu L, Ramesh V, Li L, Sun H, Minna JD, et al. Smac mimetics increase cancer cell response to chemotherapeutics in a TNF-alpha-dependent manner. Cell Death Differ. 17 (2010) 1645–1654. [DOI] [PMC free article] [PubMed] [Google Scholar]
- [42].Sung MH, Salvatore L, De Lorenzi R, Indrawan A, Pasparakis M, Hager GL, et al. Sustained oscillations of NF-kappaB produce distinct genome scanning and gene expression profiles. PLoS One. 4 (2009) e7163. [DOI] [PMC free article] [PubMed] [Google Scholar]
- [43].Lee TK, Denny EM, Sanghvi JC, Gaston JE, Maynard ND, Hughey JJ, et al. A noisy paracrine signal determines the cellular NF-kappaB response to lipopolysaccharide. Sci Signal. 2 (2009) ra65. [DOI] [PMC free article] [PubMed] [Google Scholar]
- [44].Li J, McQuade T, Siemer AB, Napetschnig J, Moriwaki K, Hsiao YS, et al. The RIP1/RIP3 necrosome forms a functional amyloid signaling complex required for programmed necrosis. Cell. 150 (2012) 339–350. [DOI] [PMC free article] [PubMed] [Google Scholar]
- [45].Nogusa S, Thapa RJ, Dillon CP, Liedmann S, Oguin TH 3rd, Ingram JP, et al. RIPK3 Activates Parallel Pathways of MLKL-Driven Necroptosis and FADD-Mediated Apoptosis to Protect against Influenza A Virus. Cell Host Microbe. 20 (2016) 13–24. [DOI] [PMC free article] [PubMed] [Google Scholar]
- [46].Chen J, Kos R, Garssen J, Redegeld F. Molecular Insights into the Mechanism of Necroptosis: The Necrosome As a Potential Therapeutic Target. Cells. 8 (2019). [DOI] [PMC free article] [PubMed] [Google Scholar]
- [47].Yu L, Wang L, Mao C, Duraki D, Kim JE, Huang R, et al. Estrogen-independent Myc overexpression confers endocrine therapy resistance on breast cancer cells expressing ERalphaY537S and ERalphaD538G mutations. Cancer Lett. 442 (2019) 373–382. [DOI] [PMC free article] [PubMed] [Google Scholar]
- [48].Yang H, Wang H, Andersson U. Targeting Inflammation Driven by HMGB1. Front Immunol. 11 (2020) 484. [DOI] [PMC free article] [PubMed] [Google Scholar]
- [49].Zhang DW, Shao J, Lin J, Zhang N, Lu BJ, Lin SC, et al. RIP3, an energy metabolism regulator that switches TNF-induced cell death from apoptosis to necrosis. Science. 325 (2009) 332–336. [DOI] [PubMed] [Google Scholar]
- [50].Yang Z, Wang Y, Zhang Y, He X, Zhong CQ, Ni H, et al. RIP3 targets pyruvate dehydrogenase complex to increase aerobic respiration in TNF-induced necroptosis. Nat Cell Biol. 20 (2018) 186–197. [DOI] [PubMed] [Google Scholar]
- [51].Chehade L, Deguise MO, De Repentigny Y, Yaworski R, Beauvais A, Gagnon S, et al. Suppression of the necroptotic cell death pathways improves survival in Smn (2B/-) mice. Front Cell Neurosci. 16 (2022) 972029. [DOI] [PMC free article] [PubMed] [Google Scholar]
- [52].Abe K, Yano T, Tanno M, Miki T, Kuno A, Sato T, et al. mTORC1 inhibition attenuates necroptosis through RIP1 inhibition-mediated TFEB activation. Biochim Biophys Acta Mol Basis Dis. 1865 (2019) 165552. [DOI] [PubMed] [Google Scholar]
- [53].Xie Y, Zhao Y, Shi L, Li W, Chen K, Li M, et al. Gut epithelial TSC1/mTOR controls RIPK3-dependent necroptosis in intestinal inflammation and cancer. J Clin Invest. 130 (2020) 2111–2128. [DOI] [PMC free article] [PubMed] [Google Scholar]
- [54].Wu YH, Chou TF, Young L, Hsieh FY, Pan HY, Mo ST, et al. Tumor suppressor death-associated protein kinase 1 inhibits necroptosis by p38 MAPK activation. Cell Death Dis. 11 (2020) 305. [DOI] [PMC free article] [PubMed] [Google Scholar]
- [55].Chen X, Zhu R, Zhong J, Ying Y, Wang W, Cao Y, et al. Mosaic composition of RIP1-RIP3 signalling hub and its role in regulating cell death. Nat Cell Biol. 24 (2022) 471–482. [DOI] [PubMed] [Google Scholar]
- [56].Sun X, Yin J, Starovasnik MA, Fairbrother WJ, Dixit VM. Identification of a novel homotypic interaction motif required for the phosphorylation of receptor-interacting protein (RIP) by RIP3. J Biol Chem. 277 (2002) 9505–9511. [DOI] [PubMed] [Google Scholar]
- [57].Cook WD, Moujalled DM, Ralph TJ, Lock P, Young SN, Murphy JM, et al. RIPK1- and RIPK3-induced cell death mode is determined by target availability. Cell Death Differ. 21 (2014) 1600–1612. [DOI] [PMC free article] [PubMed] [Google Scholar]
- [58].Mandal P, Berger SB, Pillay S, Moriwaki K, Huang C, Guo H, et al. RIP3 induces apoptosis independent of pronecrotic kinase activity. Mol Cell. 56 (2014) 481–495. [DOI] [PMC free article] [PubMed] [Google Scholar]
- [59].Hubbard NW, Ames JM, Maurano M, Chu LH, Somfleth KY, Gokhale NS, et al. ADAR1 mutation causes ZBP1-dependent immunopathology. Nature. 607 (2022) 769–775. [DOI] [PMC free article] [PubMed] [Google Scholar]
- [60].Zhang T, Yin C, Fedorov A, Qiao L, Bao H, Beknazarov N, et al. ADAR1 masks the cancer immunotherapeutic promise of ZBP1-driven necroptosis. Nature. 606 (2022) 594–602. [DOI] [PMC free article] [PubMed] [Google Scholar]
- [61].Gunther C, He GW, Kremer AE, Murphy JM, Petrie EJ, Amann K, et al. The pseudokinase MLKL mediates programmed hepatocellular necrosis independently of RIPK3 during hepatitis. J Clin Invest. 126 (2016) 4346–4360. [DOI] [PMC free article] [PubMed] [Google Scholar]
- [62].Dara L, Liu ZX, Kaplowitz N. A murder mystery in the liver: who done it and how? J Clin Invest. 126 (2016) 4068–4071. [DOI] [PMC free article] [PubMed] [Google Scholar]
- [63].von Massenhausen A, Tonnus W, Himmerkus N, Parmentier S, Saleh D, Rodriguez D, et al. Phenytoin inhibits necroptosis. Cell Death Dis. 9 (2018) 359. [DOI] [PMC free article] [PubMed] [Google Scholar]
- [64].Lee J, Lee S, Min S, Kang SW. RIP3-Dependent Accumulation of Mitochondrial Superoxide Anions in TNF-alpha-Induced Necroptosis. Mol Cells. 45 (2022) 193–201. [DOI] [PMC free article] [PubMed] [Google Scholar]
- [65].Qiu X, Zhang Y, Han J. RIP3 is an upregulator of aerobic metabolism and the enhanced respiration by necrosomal RIP3 feeds back on necrosome to promote necroptosis. Cell Death Differ. 25 (2018) 821–824. [DOI] [PMC free article] [PubMed] [Google Scholar]
- [66].Rayego-Mateos S, Marquez-Exposito L, Basantes P, Tejedor-Santamaria L, Sanz AB, Nguyen TQ, et al. CCN2 Activates RIPK3, NLRP3 Inflammasome, and NRF2/Oxidative Pathways Linked to Kidney Inflammation. Antioxidants (Basel). 12 (2023). [DOI] [PMC free article] [PubMed] [Google Scholar]
- [67].Lamade AM, Wu L, Dar HH, Mentrup HL, Shrivastava IH, Epperly MW, et al. Inactivation of RIP3 kinase sensitizes to 15LOX/PEBP1-mediated ferroptotic death. Redox Biol. 50 (2022) 102232. [DOI] [PMC free article] [PubMed] [Google Scholar]
- [68].Lai K, Wang J, Lin S, Chen Z, Lin G, Ye K, et al. Sensing of mitochondrial DNA by ZBP1 promotes RIPK3-mediated necroptosis and ferroptosis in response to diquat poisoning. Cell Death Differ. (2024). [DOI] [PMC free article] [PubMed] [Google Scholar]
- [69].Rieder SA, Wang J, White N, Qadri A, Menard C, Stephens G, et al. B7-H7 (HHLA2) inhibits T-cell activation and proliferation in the presence of TCR and CD28 signaling. Cell Mol Immunol. 18 (2021) 1503–1511. [DOI] [PMC free article] [PubMed] [Google Scholar]
- [70].Zhang Y, Li H, Lv C, Wu B, Yu Y, Zhong C, et al. HHLA2 promotes tumor progression by long non-coding RNA H19 in human gallbladder cancer. Int J Oncol. 61 (2022). [DOI] [PMC free article] [PubMed] [Google Scholar]
- [71].Li Y, Lv C, Yu Y, Wu B, Zhang Y, Lang Q, et al. KIR3DL3-HHLA2 and TMIGD2-HHLA2 pathways: The dual role of HHLA2 in immune responses and its potential therapeutic approach for cancer immunotherapy. J Adv Res. (2022). [DOI] [PMC free article] [PubMed] [Google Scholar]
- [72].Cheng TM, Murad YM, Chang CC, Yang MC, Baral TN, Cowan A, et al. Single domain antibody against carcinoembryonic antigen-related cell adhesion molecule 6 (CEACAM6) inhibits proliferation, migration, invasion and angiogenesis of pancreatic cancer cells. Eur J Cancer. 50 (2014) 713–721. [DOI] [PubMed] [Google Scholar]
- [73].Johnson B, Mahadevan D. Emerging Role and Targeting of Carcinoembryonic Antigen-related Cell Adhesion Molecule 6 (CEACAM6) in Human Malignancies. Clin Cancer Drugs. 2 (2015) 100–111. [DOI] [PMC free article] [PubMed] [Google Scholar]
- [74].Atigan A, Tan S, Cetin H, Guler OT, Ozdamar S, Karakaya YA. CD97 expression level and its effect on cell adhesion in Preeclampsia. BMC Pregnancy Childbirth. 22 (2022) 967. [DOI] [PMC free article] [PubMed] [Google Scholar]
- [75].Lin HH, Stacey M, Saxby C, Knott V, Chaudhry Y, Evans D, et al. Molecular analysis of the epidermal growth factor-like short consensus repeat domain-mediated protein-protein interactions: dissection of the CD97-CD55 complex. J Biol Chem. 276 (2001) 24160–24169. [DOI] [PubMed] [Google Scholar]
- [76].Stepanova V, Jerke U, Sagach V, Lindschau C, Dietz R, Haller H, et al. Urokinase-dependent human vascular smooth muscle cell adhesion requires selective vitronectin phosphorylation by ectoprotein kinase CK2. J Biol Chem. 277 (2002) 10265–10272. [DOI] [PubMed] [Google Scholar]
- [77].Madsen CD, Sidenius N. The interaction between urokinase receptor and vitronectin in cell adhesion and signalling. Eur J Cell Biol. 87 (2008) 617–629. [DOI] [PubMed] [Google Scholar]
- [78].Stirling DR, Swain-Bowden MJ, Lucas AM, Carpenter AE, Cimini BA, Goodman A. CellProfiler 4: improvements in speed, utility and usability. BMC Bioinformatics. 22 (2021) 433. [DOI] [PMC free article] [PubMed] [Google Scholar]
- [79].Patro R, Duggal G, Love MI, Irizarry RA, Kingsford C. Salmon provides fast and bias-aware quantification of transcript expression. Nat Methods. 14 (2017) 417–419. [DOI] [PMC free article] [PubMed] [Google Scholar]
- [80].Zhou Y, Zhou B, Pache L, Chang M, Khodabakhshi AH, Tanaseichuk O, et al. Metascape provides a biologist-oriented resource for the analysis of systems-level datasets. Nat Commun. 10 (2019) 1523. [DOI] [PMC free article] [PubMed] [Google Scholar]
Associated Data
This section collects any data citations, data availability statements, or supplementary materials included in this article.
Supplementary Materials
Data Availability Statement
The raw data and processed files are accessible at NCBI GEO database, accession GSE268650.