

Abstract
The destruction of per- and polyfluoroalkyl substances (PFAS) is critical to ensure effective remediation of PFAS contaminated matrices. The destruction of hazardous chemicals within incinerators and other thermal treatment processes has historically been determined by calculating the destruction efficiency (DE) or the destruction and removal efficiency (DRE). While high DEs, >99.99%, are deemed acceptable for most hazardous compounds, many PFAS can be converted to other PFAS at low temperatures resulting in high DEs without full mineralization and the potential release of the remaining fluorocarbon portions to the environment. Many of these products of incomplete combustion (PICs) are greenhouse gases, most have unknown toxicity, and some can react to create new perfluorocarboxylic acids. Experiments using aqueous film forming foam (AFFF) and a pilot-scale research combustor varied the combustion environment to determine if DEs indicate PFAS mineralization. Several operating conditions above 1090 °C resulted in high DEs and few detectable fluorinated PIC emissions. However, several conditions below 1000 °C produced DEs >99.99% for the quantifiable PFAS and mg/m3 emission concentrations of several non-polar PFAS PICs. These results suggest that DE alone may not be the best indication of total PFAS destruction, and additional PIC characterization may be warranted.
Keywords: PFAS, AFFF, incineration, products of incomplete combustion, destruction efficiency
Graphical Abstract:

Introduction
Per- and polyfluoroalkyl substances (PFAS) are a class of synthetic chemicals that possess strong carbon-fluorine bonds that give PFAS high stability and low surface energies1. These unique properties have made PFAS useful in heat resistant products, hydrophobic and oleophobic coatings, firefighting foams, and many other products and manufacturing processes1–3. The widespread use and stability of PFAS has led to the ubiquitous presence of PFAS in the environment and waste streams4–7. Even low levels of PFAS exposure can lead to bioaccumulation and has been associated with adverse health effects8–11, leading to low parts per trillion drinking water health advisory levels for some PFAS12. The current concentrations of PFAS in the environment have been determined to be near or over recent exposure guidelines13, 14, indicating the need for PFAS emission reductions14.
Hazardous organic chemicals are often incinerated to destroy the compounds and prevent their release to the environment15, 16. To ensure harmful emissions are not released into the atmosphere, the destruction efficiency (DE) or destruction and removal efficiency (DRE) of the parent organic molecule, or principle organic hazardous constituent (POHC), has been used to determine the destruction of the molecule15, 17–19. Typically, a DE or DRE determined for a most difficult POHC (based on an incinerability index20) is used to ensure adequate destruction for all waste species15, 18, 20. The DE or DRE can be calculated using equation 1,
| (1), |
where is the mass feed rate of the molecule in and is the mass emission rate of the POHC coming out of the incinerator for DE or out of the stack and into the atmosphere for DRE. The distinction between DE and DRE is that DRE includes credit for POHC removal in facility air pollution control devices (e.g., particulate control, acid gas scrubbers, activated carbon beds) where DE does not. Although this results in some transference of the POHC to the liquid and solid discharges from air pollution control devices, these discharges are themselves treated as hazardous wastes. The regulation, 40 CFR Part 63.1203, states that a DRE of 99.99% indicates complete destruction of most chemicals19. For perspective, a requirement of 99.99% DRE indicates that for every 1 kg of POHC introduced, 100 mg of the POHC could be released in the air emissions. When applied to an aqueous film forming foam (AFFF) containing ~2% PFAS, ~200 mg of PFAS could be emitted for every 100 kg of the AFFF incinerated.
Many PFAS of industrial importance are composed of a fluoroalkyl chain and a polar functional group. PFAS can easily be altered from their original form by the removal of the functional group thermally at temperatures as low as 100 to 300 °C21–23 and by other mechanisms at ambient temperatures24, 25. The removal of the functional group creates volatile PFAS, from the carbon-fluorine backbone, that are greenhouse gases26, 27, most have unknown toxicity, and some can transform to perfluorocarboxylic acids in the atmosphere28. The complete destruction of PFAS, the breaking of all the carbon-fluorine bonds and mineralization to form hydrofluoric acid (HF) and carbon dioxide (CO2), is necessary to ensure PFAS are not released into the environment during the thermal treatment of PFAS contaminated media.
The primary objective of this study was to evaluate whether DEs indicate complete destruction of PFAS during thermal treatment. As an indicator of incomplete destruction, volatile products of incomplete combustion (PICs) were quantified along with the DEs of the quantifiable PFAS. The study was performed using a pilot-scale natural gas-fired refractory-lined combustor. The PFAS mixture used was an AFFF predominantly containing legacy perfluorooctanesulfonic acid (PFOS).
AFFF was injected into the combustor at various locations experiencing different peak temperatures. The AFFF was atomized through the flame, with exposure to flame generated radicals and near adiabatic flame temperatures, and at post-flame locations with peak temperatures ranging from 1180 to 810 °C. These temperatures span realistic high temperatures achieved in hazardous waste incinerators (HWIs), as well as lower temperatures that may be more typical of other thermal destruction systems such as sewage sludge or municipal waste incinerators29. To our knowledge, this study is the first to use a pilot-scale incinerator to examine AFFF destruction over a wide range of temperatures and include PIC measurements as an indicator of performance.
Materials and Methods
Experimental furnace
Experiments were performed using a small pilot-scale U.S. Environmental Protection Agency (EPA) research combustor named the Rainbow furnace that has been described in previous studies30–32. Here the furnace load and flame stoichiometric ratio (SR) were varied between 30–45 kW, and 1.3–2.0, respectively. To provide similar mass flows and thorough mixing of the effluent, high amounts of excess air were used to reduce and vary furnace temperatures to those more typical of HWIs and other incineration systems. Figure 1 presents a cutaway drawing of the Rainbow furnace with AFFF injection locations (burner, port 4, port 8) and stack sampling locations identified. In this configuration, the combustor most closely resembles a hazardous waste incinerator injecting a low heating value liquid waste. Hazardous waste incinerators often introduce aqueous wastes through lances downstream of the flame.
Figure 1:

EPA refractory-lined natural gas-fired furnace showing the AFFF injection locations, through the flame with the natural gas and at ports 4 and 8 and the stack sampling locations indicated. Measurements are made prior to the facility air pollution control system (APCS).
AFFF injection
One legacy AFFF formulation composed primarily of PFOS and perfluorohexanesulfonic acid (PFHxS) was used for these experiments. The AFFF was analyzed by a commercial laboratory for PFAS according to their liquid chromatography coupled to tandem mass spectrometry (LC/MS/MS) method derived from EPA Method 53333. The AFFF was added to a 19 L Cornelius keg placed on a scale to monitor mass loss and feed rate. The injection technique has been used previously34 and is described here. AFFF was atomized through the burner or through one of two axial post-flame access ports along the furnace centerline using twin fluid (air/AFFF) atomizers. The Cornelius keg was air pressurized (~584 kPa) to push the AFFF through a manually adjusted needle valve and 4–50 mL/min liquid rotameter (Brooks Instrument, Hatfield, PA) to the atomizer. Simultaneously, compressed air (584 kPa) was directed through a mass flow controller (Sierra Instruments, model Smart-Trak 50 L/min, Monterey, CA) to the atomizer. The AFFF and atomization air were combined at one end of a length of 0.1753 cm inside diameter, 0.3175 cm outside diameter stainless steel tubing. Within the tubing the atomizing air causes the liquid to form a thin film on the inner tube surface and shears the liquid film into droplets (~50 μm diameter for water) as it leaves the other end. The injector for the two post-flame axial access ports included a 90-degree bend at the atomizer tip to direct the atomized AFFF downstream co-current with the combustion gases along the furnace centerline. In addition, to mitigate the potential for pyrolysis, the side port atomizer included two additional concentric outer tubes through which additional “sweep” air was introduced to keep the AFFF and atomizing air cool until the atomizer tip. The volumes of these two cooling flows were minor (~3%) compared to the combustion gas flow. The burner incorporated atomizer did not need cooling, and atomized AFFF into the natural gas at the center of the International Flame Research Foundation (IFRF) variable air swirl burner (using setting 4 of 0–8) where the combined natural gas AFFF mixture then burned as a diffusion flame with combustion air added annularly.
Figure S1 in the supporting information (SI), indicates Rainbow furnace temperature profiles, approximate residence times, and AFFF injection locations. One experiment introduced the AFFF through the flame where the AFFF would be exposed to near adiabatic flame temperatures (1963 °C for a methane-air diffusion flame at 101 kPa) and free radical chemistry characteristic of a natural gas diffusion flame. This was followed by five post-flame experiments that varied the peak (injection) temperature from 1180 to 810 °C in approximate increments of 100 °C. The Rainbow furnace operating conditions for each injection experiment are listed in Table S1.
Real-time measurements
Figure 1 indicates stack locations where combustion exhaust samples were extracted for analysis. As previously described30, a Fourier transform infrared spectrometer (FTIR, Model 2030, MKS Instruments Inc., Andover, MA) and a continuous emission monitor (CEM, Model ZRE Analyzer, California Analytical, Orange, CA) measured furnace exhaust concentrations of oxygen (O2), carbon monoxide (CO), and CO2. These measurements are intended to verify combustion conditions and quantify small amounts of air in-leakage caused by the facility’s induced draft blower and operation at ~1.27 cm H2O draft. FTIR was also used to measure moisture (H2O), HF, sulfur dioxide (SO2), and nitric oxide (NO). Note that CEM measurements are dry (moisture removed), and FTIR measurements are wet. Where available, the CEM and FTIR values were compared, taking into account the water, to verify the FTIR’s measurements.
Volatile non-polar PFAS
The volatile PFAS and fluorochemicals (vPFAS) were sampled using evacuated 6 L Silonite coated stainless steel canisters (Entech, Simi Valley, CA). The emissions were sampled with a heated probe, filter, and perfluoroalkoxy alkane (PFA) heated sample line at 120 °C and ~3 L/min. A 1.0 L/min slip stream of the emissions was passed through three 0.1 M sodium hydroxide (NaOH) filled mini (~30 mL) impingers and one empty impinger in an ice bath to remove acid gases and reduce the water content in the samples. The evacuated canisters (−101 kPa) collected stack gases after the impingers and were filled to ~−34 kPa, resulting in ~4 L sample volume. Sub-ambient pressure was maintained to minimize condensation inside the canister. For analysis, the canisters were pressurized with dry nitrogen to 207 kPa and the injections were spiked with internal standards, d5-chlorobenzene and 1,4-difluorobenzene.
The canisters were analyzed using a Markes International Unity-xr TD system and Markes BenchTOF-Select MS system (Bridgend, UK) integrated with an Agilent 7890B gas chromatograph (GC, Santa Clara, CA). Tetrafluoromethane was concentrated from 15 mL of sample to avoid trap breakthrough. A 200 mL aliquot of the samples were trapped for other PFAS. Samples were concentrated using a Markes Greenhouse Gas trap at −30 °C and desorbed at 40 °C/s to 280 °C and held for 0.5 min. Analytes were separated using an Agilent GS-GasPro column (60 m × 0.32 mm inside diameter) starting at 50 °C, held for 1 min, increased at 5 °C/min to 130 °C and then ramped at 10 °C/min to 240 °C and held for 37 min. Quantitation of 30 vPFAS were performed using a seven-point (0.5 to 20 ppbv, 50 to 200 ppbv for CF4) calibration curve for each analyte.
Semi and nonvolatile polar PFAS
The semivolatile and nonvolatile polar PFAS were sampled and analyzed according to the U.S. EPA’s Other Test Method 45 (OTM-45)35. Briefly, ~3.0 m3 was sampled over three hours at a constant rate from the furnace exhaust. Due to the low pressure drop in the ductwork, isokinetic sampling could not be performed. OTM-45 creates four fractions (probe rinsate and filter, an XAD sorbent trap, impinger water, and a breakthrough XAD sorbent trap) for analysis using LC/MS/MS with a method based on Method 533 to quantify 49 polar PFAS, see Table S2 in the SI. The PFAS mass from each fraction was summed to give the total mass for each sample. A proof blank train was created by setting up and recovering an OTM-45 train with clean glassware near the sampling location. The sample extraction and analyses were performed by a commercial environmental laboratory, Eurofins TestAmerica (Knoxville, TN), according to OTM-45 and their standard operating procedures.
Calculation of destruction efficiency
To account for variable excess combustion air and any additional dilution caused by in leakage into the furnace, the DEs for the targeted PFAS in the AFFF were calculated using Method 1936 as done previously30. The DE, or percent removal, was calculated using equation 1, but Wout was replaced with Method 19’s Eao, the mass emissions rate, and Win was replaced with Eai, the mass input rate. The mass emission rates are further defined in the SI.
Nontargeted PFAS
Nontargeted analysis (NTA) was performed with additional mass spectrometry analysis of the OTM-45 extracts using LC coupled to a high-resolution Thermo Orbitrap Fusion mass spectrometer (Thermo Fisher Scientific, Waltham, MA, USA) described elsewhere37, 38. Extracts were diluted 1:3 with water and then analyzed with the LC/MS using a heated electrospray ionization source operated in negative mode. Data was generated using data dependent MS/MS acquisition with a scan range of 150–1500 m/z and Orbitrap resolution of 60,000 and 15,000 for MS1 and MS2 acquisition, respectively. Instrument settings are detailed in the SI.
Raw instrument files were then processed with Thermo Compound Discoverer 3.3 to extract chemical features and tentatively matched against several databases (the USEPA’s Distributed Structure-Searchable Toxicity (DSSTox), Thermo mzCloud, and Mass Bank of North America (MONA) mzvault library). The compounds’ formula and potential names were generated by Compound Discoverer based on the MS1 molecular ion’s mass. Some formulas and chemical names do not show fluorine, but the MS2 spectra possessed PFAS-like features. The PFAS-like features were manually identified based on a negative mass defect or predicted formula containing multiple fluorine atoms and fragmentation consistent with fluorinated moieties listed in Table S3. Determining the presence of fluorinated molecules was the focus of this study, subsequent studies may focus on identification of unidentified compounds.
Results and Discussion
Targeted PFAS destruction
The AFFF was found to contain 10 PFAS from the targeted analyte list, see Table S4 in the SI. The quantitated PFAS consisted of C4 to C8 perfluoroalkyl carboxylic acids (PFCAs) and perfluoroalkyl sulfonic acids (PFSAs), and concentrations of the 10 PFAS were used to calculate the DEs for the PFAS in the AFFF. The PFAS found in the stack emissions from the OTM-45 sampling for all six AFFF injections are shown in Table 1, with compound abbreviations defined in Table S2. No other PFAS from the OTM-45 target list above method blank (MB) and reporting levels were detected in any of the sampling trains besides the original 10, with just perfluorononanoic acid (PFNA) being detected near blank levels in two samples and perfluorooctanesulfonamide (FOSA) being just above the detection limit in one sample. This is not surprising, as the 49 PFAS from OTM-45 are from methods for water analysis and are complex polar structures of industrial relevance that are more likely to be found in industrial discharges than to be formed via de novo synthesis during combustion processes. An exception to this may be the PFCAs which may form from fluoroalkyl fragments in the presence of water at post-flame and stack conditions.
Table 1:
OTM-45 results
| Temperature (°C) | MB* | PBT* | Flame | 1180 | 1090 | 970 | 870 | 810 |
|---|---|---|---|---|---|---|---|---|
| Sample volume (dscm)a | - | - | 3.12 | 3.71 | 3.71 | 3.72 | 3.74 | 3.74 |
| Injection Port | - | - | burner | 4 | 4 | 8 | 4 | 8 |
| PFAS * | ng/sample | ng/sample | ng/sample | ng/sample | ng/sample | ng/sample | ng/sample | ng/sample |
| PFBA | ND | 5.57 | 22.3 | 108 | 9.10b | 628b | 3950 | 116000 |
| PFPeA | ND | 3.32 | 17.6 | 56.0 | 7.42b | 249 b | 741 | 63400 |
| PFHxA | ND | 6.59 | 26.1 | 100 | 13.8 | 490 | 1240 | 151000 |
| PFHpA | 0.40 | 1.55 | 6.32 | 29.8 | 5.23 | 65.5 | 475 | 36300 |
| PFOA | ND | 2.30 | 36.8 | 156 | 144c | 452c | 1430 | 78400 |
| PFBS | 0.11 | 0.41 | 0.61 | 6.66 | 0.57 | 0.67 | 28.8 | 1860 |
| PFPeS | ND | ND | ND | 4.58 | 0.14 | 0.54 | 23.4 | 1680 |
| PFHxS | ND | 1.25 | 0.92 | 21.6 | 1.36c | 2.33c | 118 | 8520 |
| PFHpS | ND | ND | ND | 1.84 | ND | 0.34 | 17.1 | 989 |
| PFOS | ND | 9.30c | 3.08c | 116 | 42.2c | 18.6c | 819 | 62200 |
MB is laboratory method blank, PBT is the proof blank train, abbreviations are in Table S2
Dry standard cubic meter
Pre-extraction internal standards were above of acceptance criteria, >150%
Pre-extraction internal standards were below acceptance criteria, <20%
For these experiments, the train’s glassware was cleaned according to OTM-45 for each test, so a field blank train was not run since the proof blank train (PBT) was the same as a field blank train. The PBT showed some near detection limit levels of contamination, mainly due to the XAD fractions of the train. The PFCAs, perfluorobutanesulfonic acid (PFBS), perfluorohexanesulfonic acid (PFHxS), and PFOS were all measured at trace levels in the proof blank train. The results are reported according to OTM-45, without any blank correction. The samples with low levels of PFAS are reported as near blank levels to indicate that the result may be biased high and the PFAS may be below the detection limit. The OTM-45 data were also impacted by the low recovery of the isotopically labeled extraction internal standard for some longer chain PFAS. This is likely due to the water that collects in the XAD decreasing the solubility of the long chain PFAS. The impacted PFAS are noted in the tables, and the values are the highest estimated value provided by the commercial laboratory.
The experimental sequence was flame, 1090, 970, 870, 810, and 1180 °C. It appears that there may have been some hysteresis due to contamination of internal furnace surfaces after the test at the lowest temperature. Experiments were performed on separate days with at least 18 hours of operation at new combustion conditions without AFFF injection to achieve equilibrium. The experiment at 1180 °C was performed the day after the lowest temperature injection experiment at 810 °C and Table 1 indicates slightly higher concentrations of some PFCAs than the experiment at 1090 °C, and the PFSAs had higher concentrations than the experiment at 970 °C. Even so, the concentrations were not far above the detection limits and still show very high DEs, but the potential for hysteresis is something to note. The apparent carryover could be due to the quartz probe not going through as extensive of a cleaning process as the other glassware and only being rinsed and brushed, or the furnace may not have fully desorbed PFAS deposited on refractory and ductwork surfaces during the previous 810 °C experiment. The 1180 °C experiment was not repeated due to the time to receive the analytical results and the high cost for each run. The possible contamination was relatively low and the 1180 °C experiment measured most of the targeted compounds near the detection limit. As a result, the possible contamination did not impact the aim of these experiments to determine if DEs are an effective metric to verify treatment of PFAS. Future tests will involve more rigorous cleaning of the probe, a combustion blank to look for contamination in the system, and more time will pass between low temperature tests to allow more complete surface desorption.
The DEs for the 10 PFAS quantified in the AFFF as determined using Method 19 are shown in Table 2, with the values below four nines, <99.99%, emphasized using red text. The original PFAS concentrations (Table S4), AFFF feed rates and combustion parameters (Table S1), and AFFF stack emissions (Table 1) were used in the calculations. When reported PFAS emissions were not detected (ND), the detection limit was used as a conservative value for DE calculation. The lack of corrections for blank contamination as well as corrections for recoveries (including low recoveries) also serve to reduce DE values and provide more conservative values.
Table 2:
DEs for measured PFAS in AFFF with red indicating less than four nines DE
| Temperature, (°C) | Flame | 1180 | 1090 | 970 | 870 | 810 |
|---|---|---|---|---|---|---|
| PFAS | (%) | (%) | (%) | (%) | (%) | (%) |
| PFBA | 99.9958 | 99.9725 | 99.9978 | 99.8443 b | 98.3336 b | 45.7362 |
| PFPeA | 99.9993 | 99.9971 | 99.9996 | 99.9876 b | 99.9372 b | 94.0300 |
| PFHxA | 99.9997 | 99.9984 | 99.9998 | 99.9925 | 99.9678 | 95.6188 |
| PFHpAa | 99.9997 | 99.9984 | 99.9997 | 99.9965 | 99.9566 | 96.3086 |
| PFOA | 99.9996 | 99.9978 | 99.9981 | 99.9938b | 99.9663 b | 97.9522 |
| PFBSa | >99.9999 | >99.9999 | >99.9999 | >99.9999 | 99.9996 | 99.9704 |
| PFPeS | >99.9999 | >99.9999 | >99.9999 | >99.9999 | 99.9996 | 99.9671 |
| PFHxS | >99.9999 | >99.9999 | >99.9999b | >99.9999b | 99.9997 | 99.9768 |
| PFHpS | >99.9999 | >99.9999 | >99.9999 | >99.9999 | 99.9996 | 99.9766 |
| PFOS | >99.9999b | >99.9999 | >99.9999b | >99.9999b | 99.9997 | 99.9751 |
PFBS and PFHpA were detected in the analytical method blanks.
Pre-extraction internal standards were outside of acceptance criteria, DEs used estimated maximum concentrations.
The DEs for all five PFSAs are >99.9999% for the four PFAS injection locations >970 °C. Even at 870 and 810 °C, DEs for all five PFSAs were >99.999% and >99.9%, respectively. DEs for the five PFCAs were also high (mostly >99.99%) for injection temperatures >1090 °C, and mostly >99.9% for injection temperatures >870 °C. Even at the lowest AFFF injection temperature, 810 °C, DEs >94% were measured for four PFCAs, except for perfluorobutanoic acid (PFBA). PFBA exhibited the lowest DEs, both with respect to AFFF injection temperatures and PFCA chain length. Lower than expected DEs for PFBA and PFCAs have been reported previously with various destruction technologies25, 39, 40 and may suggest either that shorter PFCAs are relatively more stable species or shorter chained PFCAs are formed via hydrolysis of fluoroalkyl fragments in the post-flame. Note that PFSAs do not indicate this same trend with calculated DEs for PFBS and PFOS approximately similar at corresponding temperatures. This trend for PFCAs might also suggest a pathway or intermediate through which PFAS transition during thermal destruction. PFAS might be affected by high concentrations of hydroxyl radicals (OH), H2O, and CO2 in the combustion gases that promote reformation of PFCAs from fluoroalkyl fragments. This has been reported to occur in the atmosphere28 and experimentally41, 42, and the formation of aldehydes and acyl fluorides that can react to create carboxylic acids has been predicted by several computational mechanisms43–46. If true, the conversion of PFSAs to PFCAs would reduce apparent DEs for PFCAs while the PFSAs would have higher DEs. These experiments, using a complex mixture of PFAS and other unknown components in the AFFF, do not represent the best approach for addressing mechanistic questions. Further experiments using neat solutions of specific PFAS in coordination with ongoing kinetic modeling efforts are needed to better address mechanisms.
Volatile emissions
The generally high DEs (>99.99%) presented in Table 2 suggest PFAS are relatively fragile, at least with respect to losing their molecular identity even at temperatures <900 °C. High DEs, however, do not necessarily ensure the absence of emissions of fluoroorganic PICs. Evacuated canisters were used to look for some known21–23 and suspected PICs. The current method under development at the EPA can measure 30 vPFAS listed in Table 3. The reporting limits for 29 of these compounds is 0.5 ppbv, while tetrafluoromethane (CF4) is limited to 50 ppbv. These are high values with respect to OTM-45 (~pptv concentrations), and current efforts are focused on lowering these limits of quantitation. This method was used during the AFFF incineration experiments and the results, presented in μg/m3, are shown in Table 3. At AFFF injection locations >1090 °C, the PIC data show very little vPFAS at the current detection limits, but as the AFFF injection temperatures fall below 1000 °C, the vPFAS increase considerably to mg/m3 levels. The increase in vPFAS also coincides with elevated CO concentrations rising from single digit levels up to ~1700 ppmv (see Table 3). Increases in CO were the result of incomplete PFAS oxidation and not associated with the natural gas combustion, as the AFFF experiments with high CO were injected post-flame long after natural gas combustion was complete.
Table 3:
Volatile PFAS and other gases quantified in the emissions from AFFF incineration
| Temperature (°C) | Flame | 1180 | 1090 | 970 | 870 | 810 |
|---|---|---|---|---|---|---|
| Canister Analytes (μg/m3) | ||||||
| tetraflouromethane | ND | ND | ND | ND | ND | ND |
| hexafluoroethane | ND | ND | ND | 11.4 | 9.36 | 6.51 |
| chlorotrifluoromethane | ND | ND | ND | ND | ND | ND |
| fluoroform | ND | ND | ND | 5.47 | 601 | 7530 |
| octafluoropropane | ND | ND | ND | 267 | 903 | 795 |
| difluoromethane | ND | ND | ND | 2.87 | 8.51 | 94.4 |
| pentafluoroethane | 0.70 | 1.35 | 0.65 | 3.99 | 276 | 8950 |
| octafluorocyclobutane | ND | ND | ND | ND | ND | 14.1 |
| fluoromethane | ND | ND | ND | ND | ND | 1.30 |
| tetraflouroethylene | ND | ND | ND | ND | 1.16 | 149 |
| hexafluoropropylene | ND | 0.19 | ND | 0.31 | 4.96 | 567 |
| 1,1,1-trifluoroethane | ND | ND | ND | ND | ND | ND |
| hexafluoropropene oxide | ND | ND | ND | ND | ND | ND |
| chlorodifluoromethane | ND | ND | ND | ND | ND | ND |
| 1,1,1,2-tetrafluoroethane | ND | ND | ND | 3.39 | 1.84 | 64.2 |
| perfluorobutane | ND | 0.30 | ND | ND | 434 | 620 |
| 1H heptafluoropropane | ND | 0.99 | ND | ND | 86.8 | 2480 |
| octafluourocyclopentene | ND | ND | ND | ND | 5.15 | 235 |
| trichlorofluoromethane | 0.40 | 0.17 | 0.57 | 0.57 | 0.40 | 0.57 |
| dodecafluoro-n-pentane | ND | ND | ND | ND | 51.2 | 503 |
| 1H nonafluorobutane | ND | 0.64 | ND | ND | 59.8 | 1230 |
| tetradecafluorohexane | ND | ND | ND | ND | 1.41 | 307 |
| 1H perflluoropentane | ND | ND | ND | ND | 12.1 | 1000 |
| E1a | ND | ND | ND | ND | ND | ND |
| hexadecaflluroheptane | ND | ND | ND | ND | ND | 85.81 |
| 1H perfluorohexane | ND | ND | ND | ND | 6.65 | 1090 |
| perfluorooctane | ND | ND | ND | ND | ND | 291 |
| 1H perfluoroheptane | ND | ND | ND | ND | ND | 316 |
| 1H Perfluorooctane | ND | ND | ND | ND | ND | 203 |
| E2b | ND | ND | ND | ND | ND | ND |
| FTIR Analytes | ||||||
| CO (ppm) | 7.2 | 3.6 | 4.5 | 5.7 | 109 | 1730 |
| CO2 (%) | 6.2 | 6.3 | 5.2 | 5.0 | 4.4 | 4.0 |
| HF (ppm)c | 427 | 340 | 278 | 266 | 260 | 227 |
| NO (ppm)c | 86.7 | 91 | 63.5 | 38.1 | 4.9 | 0.4 |
| SO2 (ppm)c | 60.9 | 41.7 | 34 | 31.4 | 35.2 | 35.4 |
| Other Gas | ||||||
| Oxygen, O2 (dry, %) | 7.9 | 7.2 | 9.0 | 9.2 | 11.8 | 12.0 |
Heptafluoropropyl 1,2,2,2-tetrafluoroethyl ether
2H-Pefluoro-5-methyl-3,6-dioxanonane
Values not verified with CEM data or certified transfer standard.
An important finding from Table 3 is the notable emissions of relatively high concentrations (~mg/m3) of all eight 1H-perflouroalkanes (C1-C8) during the 810 °C injection experiment. These vPFAS are expected to be formed during the thermolysis of the PFCAs or PFSAs under both pyrolytic and oxidative conditions21–23, 43, 45, 47. The fluorocarbon concentrations increase with decreasing fluoroalkyl chain length, with fluoroform (CHF3) and pentafluoroethane (C2HF5) present at 810 °C, at concentrations of 7.5 and 9.0 mg/m3, respectively. 1H-perfluorooctane (C8HF17) and 1H-perfluoroheptane (C7HF15) concentrations were significantly lower (0.2 and 0.3 mg/m3, respectively), possibly indicating a mechanistic pathway of incremental α or β carbon removal. Tetrafluoroethylene (C2F4) concentrations are relatively low (~0.15 mg/m3), perhaps suggesting that a mechanism where C2F4 is formed48, 49 by β carbon scission, is less important under oxidative conditions.
Note that similar results have been both experimentally and computationally derived under pyrolytic and oxidative conditions. Thermolysis often yields 1H-perfluorocarbons and 1-perfluoroalkenes with PFCAs21–23, 47, 50, 51, with PFSAs forming the same compounds52 as well as perfluorocarbons47, 53. Computational studies predict similar products43–46, 48 using various computational methods. All the referenced models have a lactone or sulfone intermediate with HF elimination as the first step to the loss of the functional group. After the removal of the functional group, the steps to formations of non-polar intermediates, including the breaking of carbon-carbon and carbon-fluorine bonds, are all relatively low energy steps. These steps involve unimolecular decomposition, hydrofluorination, hydrolysis, and fragmentation of the alkyl chain. A prominent and potentially important intermediate are acyl fluorides since these can readily be hydrolyzed to carboxylic acids, as suspected in this study. Altarawneh43 examined the temperature sensitivity of PFBS destruction from 500 to 2000 K and indicated that PFBS is destroyed at low temperatures but can create fluorinated PICs at temperatures up to 1127 °C. These studies examined different conditions than the present study, but still the similarities are remarkable, and provide further support that high DEs are not necessarily indicative of the absence of PICs.
HF concentrations presented in Table 3 were not validated because no accompanying CEM measurement was available. Subsequent attempts at Method 320 validation were unsuccessful due to poor HF transport efficiencies and subsequent poor calibration gas recoveries. Additionally, the measured HF concentrations were typically observed to rise throughout the duration of an experiment indicating the HF was not yet at equilibrium with the reactive surfaces of the furnace. The HF values are included for perspective to indicate approximate HF concentrations based on the amounts of AFFF introduced. Note that NO values decrease with decreasing AFFF injection temperatures. This behavior is not fully understood but may be related to selective non-catalytic reduction (SNCR) technologies used for the control of nitrogen oxides54–56. SNCR decreases NO concentrations in combustion effluents by reactions with added ammonia, ammonia derivatives, or urea to the combustion gases at temperatures between 700 to 1000 °C. AFFF is known to contain percent levels of amines, sulfonamides, and amides, and these may be acting to reduce the NO concentrations as the AFFF injection temperatures fall below 1000 °C. Efforts to improve confidence in FTIR measurements including HF and NO are ongoing.
Nontargeted PFAS emissions
Additional mass spectra analysis of the OTM-45 extracts revealed there were up to 92 features that indicated the presence of different semivolatile polar PFAS. Figure 2 presents the sum of the peak areas for these 92 fluorinated species for the six combustion experiments and the PBT. Where the peak area of a feature was very low, an arbitrary value was given to the peak to allow for statistical analysis by the software. This artificially makes the peak areas for fluorinated features in the blanks and some low detection samples higher than what they may actually be. Figure 2 does not correct for this, and again near blank levels may indicate the nontargeted peak areas are below detection limits. Figure 2 presents separate analysis for four OTM-45 sample fractions: front half (filter and probe rinse), back half (XAD-2 sorbent), impinger solutions, and a second volume of XAD-2 sorbent, used for these experiments, to quantify the potential for sample breakthrough. The NTA peak areas in Figure 2 are separated between those corresponding to 36 targeted PFAS (lightly shaded), and 56 nontargeted (unidentified) PFAS found. The tentative formulas and chemical names for the nontargeted PFAS are listed in Table S5. These formulas and names are based on the MS1 molecular ion, the software occasionally picked compounds that do not contain fluorine. The MS2 spectra did show PFAS-like features and are included in Table S5. The 36 targeted PFAS are part of the other OTM-45 targeted list of PFAS shown in Table S2, and Figure 2 shows how much the total PFAS present are made up of these targeted compounds. It is apparent many of the compounds sampled during these experiments are not found in the OTM-45 list. As the temperature decreases the peak area of the OTM-45 fractions shifts from the back half XAD having the most area to the front half, or filter, fraction having the most area at 810 °C. This is due to the large increase of sulfonates in the emissions, see Table 1, that preferentially adsorbed on the filter, and to a lesser extent an increase of PFCAs on the filter too.
Figure 2:
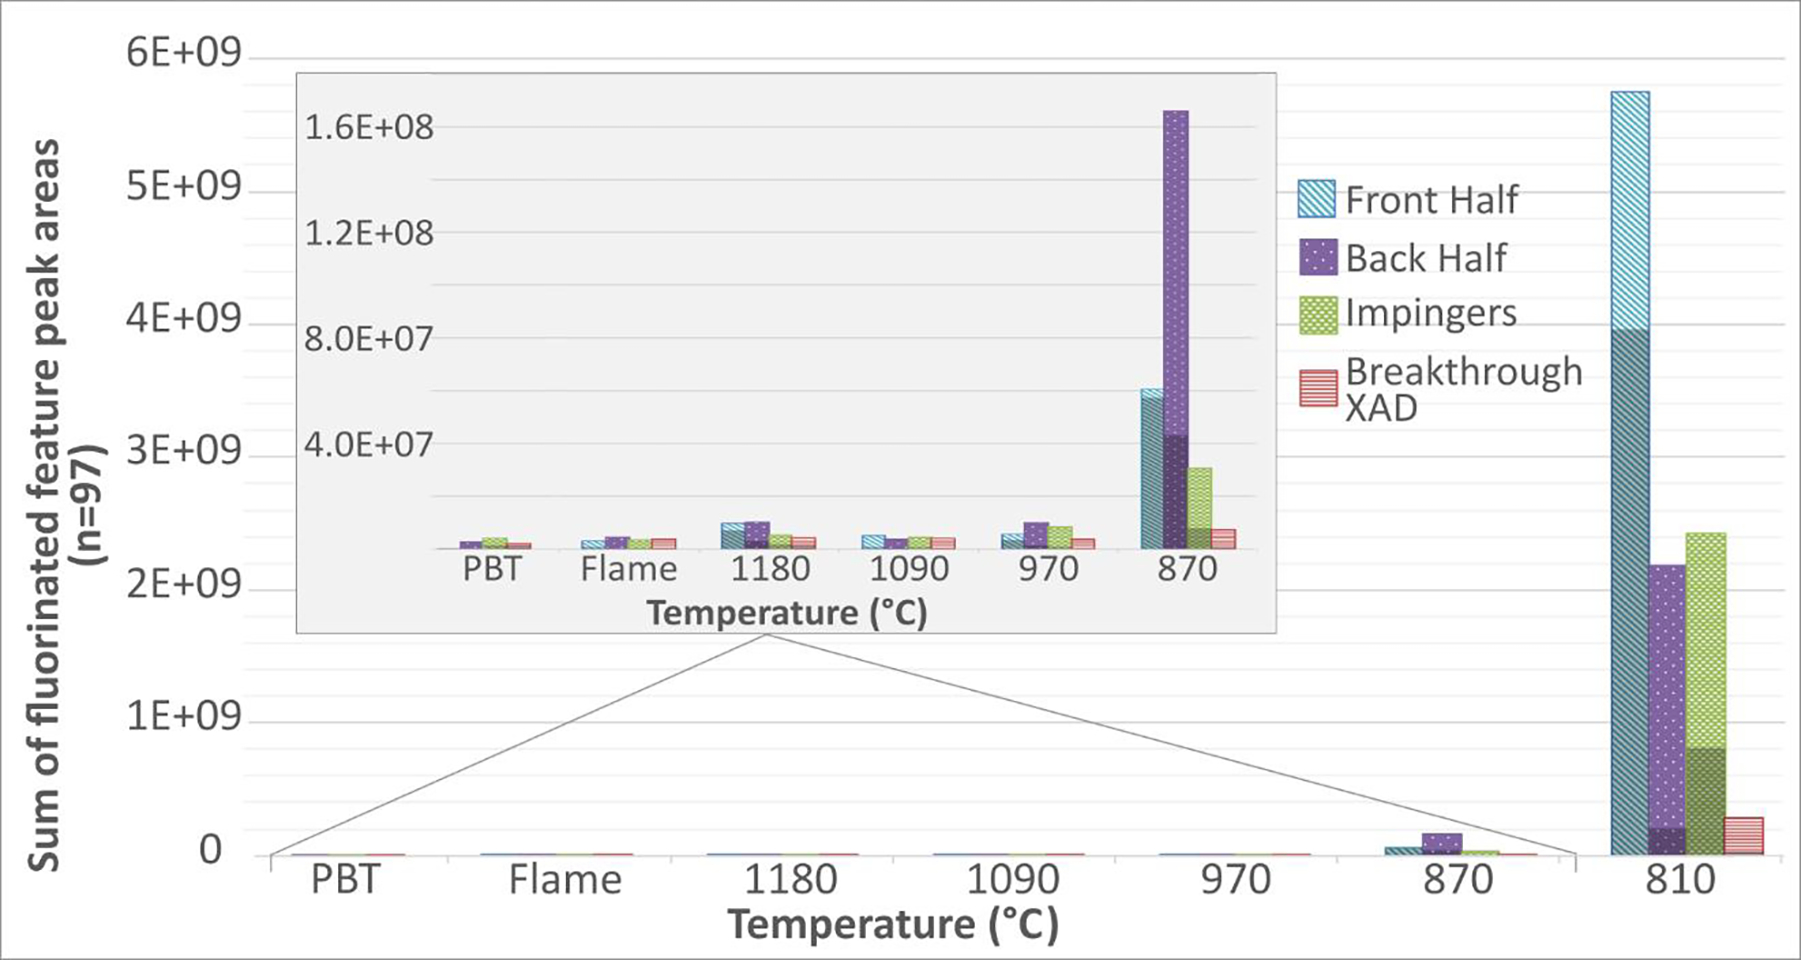
The sums of the peak areas of fluorinated features observed with nontargeted analyses of the OTM-45 extracts. Each fraction of the sampling train is shown for each temperature. The darkened portion of each bar is the sum of the targeted compounds’ peak areas, included to show how well the targeted list covers the observed PFAS.
Figure 2 presents these data on two linear scales. The larger plot includes the 810 °C experiment, and the insert excludes these data to allow better comparison of the other experimental results. NTA indicates additional unidentified semivolatile polar PFAS mass in addition to the 36 targeted PFAS in all sample fractions. However, like the volatile non-polar PIC measurements, injection temperatures >1000 °C do not result in NTA PFAS mass significantly above blank levels. Note that the NTA also shows the suspected hysteresis effect of performing the 1180 °C experiment after the 810 °C experiment. The NTA indicates increasing PFAS emissions at AFFF injection temperatures <1000 °C, and that unidentified PFAS comprise a portion of these emissions.
Conclusions
The functional groups of many PFAS, and perhaps many PFAS of industrial importance, can be removed at temperatures which do not fully mineralize the fluorinated chain. This would classily many industrial PFAS as Class 3 to Class 5 compounds on the U.S. EPA’s Thermal Stability Index, where Class 1 is the most stable and Class 7 compounds are the least stable45. Despite the ranking of parent PFAS, subsequent fluorinated PICs formed are stable57, and the simple use of DEs as the sole indicator of complete PFAS destruction may be misleading. For some PFAS, relatively low energies are needed to remove the polar functional group, with the first step being the loss of the terminal C or S likely through a lactone or sulfone intermediate, leaving a non-polar fluoroalkyl chain. If conditions prevent continuation of the destruction mechanisms, this may result in high DEs, >99.99%, but not necessarily the mineralization of the PFAS molecule. Here, complete destruction is defined as mineralization, which for a C, F, O, H system results in CO2, HF, and H2O. In these experiments, combustion conditions were examined that produced high DEs and measurable PICs. However, when AFFF was exposed to temperatures ≥1090 °C (including exposure to flames and near adiabatic flame temperatures) high DEs and near detection limit concentrations of relatively few vPFAS PICs were observed. Based on these experiments, high destruction of PFAS can be shown only by considering both high DEs and the absence of PICs.
Finally, note that these experiments focused on steady-state combustor operations. This was done to simplify the fluid dynamics and mixing behavior and allow focus on kinetic aspects. However, except for thermal oxidizers and some other steady-state liquid injection applications, HWIs (often rotary kilns) introduce wastes in multiple ways, including batch solids and contained liquids. These cause transient release of organics to the vapor phase that may temporarily overwhelm available oxygen and depress temperatures. For most HWIs, the afterburner is intended to dampen and smooth this transient behavior, but it is likely that the time dependent behavior of PFAS in HWIs and other batch fed systems will depend on the system’s ability to smooth these transients and maintain high temperatures. More research into rotary kiln systems and full-scale incinerators is needed.
Supplementary Material
Acknowledgements/Disclaimer
Portions of this work were sponsored under EPA contract 68HERC20F0377–001 with Jacobs Technology Inc. The authors are grateful to Josh Varga, Mike Tufts, Eric Squier, and Carl Ray for their assistance in the construction, maintenance, calibration, and operation of the experimental combustor, and sample collection and analyses. The research described in this article has been reviewed by the U.S. EPA Center for Environmental Measurement and Modeling and approved for publication. The contents of this article should not be construed to represent Agency policy nor does mention of trade names or commercial products constitute endorsement or recommendation for use. This research is part of the U. S. EPA’s contribution to SERDP project ER21–1288.
Footnotes
Supporting Information
The Supporting Information is available free of charge via the internet at https://pubs.acs.org/.
Additional combustor conditions, sampling setup, method information, analytical data, destruction efficiency calculation method, and analytical methods for non-targeted analysis
References
- 1.Lemal DM, Perspective on fluorocarbon chemistry. J Org Chem 2004, 69, (1), 1–11. DOI: 10.1021/jo0302556 [DOI] [PubMed] [Google Scholar]
- 2.Okazoe T, Overview on the history of organofluorine chemistry from the viewpoint of material industry. Proc Jpn Acad Ser B Phys Biol Sci 2009, 85, (8), 276–89. DOI: 10.2183/pjab.85.276 [DOI] [PMC free article] [PubMed] [Google Scholar]
- 3.Goldwhite H, The Manhattan Project. J. Fluor. Chem. 1986, 33, (1–4), 109–132. DOI: 10.1016/s0022-1139(00)85273-2 [DOI] [Google Scholar]
- 4.Zhu W; Khan K; Roakes H; Maker E; Underwood KL; Zemba S; Badireddy AR, Vermont-wide assessment of anthropogenic background concentrations of perfluoroalkyl substances in surface soils. J Hazard Mater 2022, 438, 129479. DOI: 10.1016/j.jhazmat.2022.129479 [DOI] [PubMed] [Google Scholar]
- 5.Thompson KA; Mortazavian S; Gonzalez DJ; Bott C; Hooper J; Schaefer CE; Dickenson ERV, Poly- and Perfluoroalkyl Substances in Municipal Wastewater Treatment Plants in the United States: Seasonal Patterns and Meta-Analysis of Long-Term Trends and Average Concentrations. ACS ES&T Water 2022. DOI: 10.1021/acsestwater.1c00377 [DOI] [Google Scholar]
- 6.Li J; Sun J; Li P, Exposure routes, bioaccumulation and toxic effects of per- and polyfluoroalkyl substances (PFASs) on plants: A critical review. Environ Int 2022, 158, 106891. DOI: 10.1016/j.envint.2021.106891 [DOI] [PubMed] [Google Scholar]
- 7.Nakayama SF; Yoshikane M; Onoda Y; Nishihama Y; Iwai-Shimada M; Takagi M; Kobayashi Y; Isobe T, Worldwide trends in tracing poly- and perfluoroalkyl substances (PFAS) in the environment. TrAC, Trends Anal. Chem. 2019, 121. DOI: 10.1016/j.trac.2019.02.011 [DOI] [Google Scholar]
- 8.Chang CJ; Barr DB; Ryan PB; Panuwet P; Smarr MM; Liu K; Kannan K; Yakimavets V; Tan Y; Ly V; Marsit CJ; Jones DP; Corwin EJ; Dunlop AL; Liang D, Per- and polyfluoroalkyl substance (PFAS) exposure, maternal metabolomic perturbation, and fetal growth in African American women: A meet-in-the-middle approach. Environ Int 2022, 158, 106964. DOI: 10.1016/j.envint.2021.106964 [DOI] [PMC free article] [PubMed] [Google Scholar]
- 9.Fenton SE; Ducatman A; Boobis A; DeWitt JC; Lau C; Ng C; Smith JS; Roberts SM, Per- and Polyfluoroalkyl Substance Toxicity and Human Health Review: Current State of Knowledge and Strategies for Informing Future Research. Environ Toxicol Chem 2021, 40, (3), 606–630. DOI: 10.1002/etc.4890 [DOI] [PMC free article] [PubMed] [Google Scholar]
- 10.Grandjean P; Andersen EW; Budtz-Jorgensen E; Nielsen F; Molbak K; Weihe P; Heilmann C, Serum vaccine antibody concentrations in children exposed to perfluorinated compounds. JAMA 2012, 307, (4), 391–7. DOI: 10.1001/jama.2011.2034 [DOI] [PMC free article] [PubMed] [Google Scholar]
- 11.Zhang Y; Pan C; Ren Y; Wang Z; Luo J; Ding G; Vinturache A; Wang X; Shi R; Ouyang F; Zhang J; Li J; Gao Y; Tian Y; Shanghai Birth Cohort S, Association of maternal exposure to perfluoroalkyl and polyfluroalkyl substances with infant growth from birth to 12 months: A prospective cohort study. Sci Total Environ 2022, 806, (Pt 3), 151303. DOI: 10.1016/j.scitotenv.2021.151303 [DOI] [PubMed] [Google Scholar]
- 12.U.S. EPA, Lifetime Drinking Water Health Advisories for Four Perfluoroalkyl Substances. Federal Register, 2022; Vol. 87, pp 36848–36849, [Google Scholar]
- 13.Drinking Water Health Advisories for PFOA and PFOS. https://www.epa.gov/sdwa/drinking-water-health-advisories-pfoa-and-pfos, Accessed February 21, 2023, U.S. EPA; 2022 [DOI] [PubMed] [Google Scholar]
- 14.Cousins IT; Johansson JH; Salter ME; Sha B; Scheringer M, Outside the Safe Operating Space of a New Planetary Boundary for Per- and Polyfluoroalkyl Substances (PFAS). Environ Sci Technol 2022. DOI: 10.1021/acs.est.2c02765 [DOI] [PMC free article] [PubMed] [Google Scholar]
- 15.Oppelt ET, Incineration of hazardous waste. A critical review. J. Air Pollut. Control Assoc. 1987, 37, (5), 558–86. DOI: 10.1080/08940630.1987.10466245 [DOI] [PubMed] [Google Scholar]
- 16.A Citizen’s Guide to Incineration. https://www.epa.gov/sites/default/files/2015-04/documents/a_citizens_guide_to_incineration.pdf, Accessed September 12, 2022, U.S. EPA; 2012 [Google Scholar]
- 17.Dellinger B; Lamb CW; Kumar P; Lanza R; Wagner M, Theoretical Estimation of Incinerability of Halons and Hydrochlorofluorocarbons. Environ. Eng. Sci. 2010, 27, (7), 587–591. DOI: 10.1089/ees.2009.0393 [DOI] [Google Scholar]
- 18.Dellinger B; Taylor PH; Lee CC, Full-scale evaluation of the thermal stability-based hazardous organic waste incinerability ranking. Air Waste 1993, 43, (2), 203–7. DOI: 10.1080/1073161x.1993.10467126 [DOI] [PubMed] [Google Scholar]
- 19.What are the standards for hazardous waste incinerators that are effective until compliance with the standards under. https://www.ecfr.gov/current/title-40/chapter-I/subchapter-C/part-63/subpart-EEE/subject-group-ECFRd3294690f47e3c6/section-63.1203, Accessed September 13 2022, U.S. EPA; 2022 [Google Scholar]
- 20.Taylor PH; Dellinger B; Lee CC, Development of a thermal stability-based ranking of hazardous organic compound incinerability. Environ. Sci. Technol. 1990, 24, (3), 316–328. DOI: 10.1021/es00073a005 [DOI] [Google Scholar]
- 21.LaZerte JD; Hals LJ; Reid TS; Smith GH, Pyrolyses of the Salts of the Perfluoro Carboxylic Acids1. J. Am. Chem. Soc. 1953, 75, (18), 4525–4528. DOI: 10.1021/ja01114a040 [DOI] [Google Scholar]
- 22.Krusic PJ; Marchione AA; Roe DC, Gas-phase NMR studies of the thermolysis of perfluorooctanoic acid. J. Fluor. Chem. 2005, 126, (11–12), 1510–1516. DOI: 10.1016/j.jfluchem.2005.08.016 [DOI] [Google Scholar]
- 23.Krusic PJ; Roe DC, Gas-phase NMR technique for studying the thermolysis of materials: thermal decomposition of ammonium perfluorooctanoate. Anal Chem 2004, 76, (13), 3800–3. DOI: 10.1021/ac049667k [DOI] [PubMed] [Google Scholar]
- 24.Trang B; Li Y; Xue XS; Ateia M; Houk KN; Dichtel WR, Low-temperature mineralization of perfluorocarboxylic acids. Science 2022, 377, (6608), 839–845. DOI: 10.1126/science.abm8868 [DOI] [PubMed] [Google Scholar]
- 25.Wang Y; Pierce RD; Shi H; Li C; Huang Q, Electrochemical degradation of perfluoroalkyl acids by titanium suboxide anodes. Environ. Sci.: Water Res. Technol. 2020, 6, (1), 144–152. DOI: 10.1039/c9ew00759h [DOI] [Google Scholar]
- 26.Ivy DJ; Rigby M; Baasandorj M; Burkholder JB; Prinn RG, Global emission estimates and radiative impact of C4F10, C5F12, C6F14, C7F16 and C8F18. Atmos. Chem. Phys. 2012, 12, (16), 7635–7645. DOI: 10.5194/acp-12-7635-2012 [DOI] [Google Scholar]
- 27.Mühle J; Ganesan AL; Miller BR; Salameh PK; Harth CM; Greally BR; Rigby M; Porter LW; Steele LP; Trudinger CM; Krummel PB; O’Doherty S; Fraser PJ; Simmonds PG; Prinn RG; Weiss RF, Perfluorocarbons in the global atmosphere: tetrafluoromethane, hexafluoroethane, and octafluoropropane. Atmos. Chem. Phys. 2010, 10, (11), 5145–5164. DOI: 10.5194/acp-10-5145-2010 [DOI] [Google Scholar]
- 28.Ellis DA; Martin JW; De Silva AO; Mabury SA; Hurley MD; Sulbaek Andersen MP; Wallington TJ, Degradation of fluorotelomer alcohols: a likely atmospheric source of perfluorinated carboxylic acids. Environ Sci Technol 2004, 38, (12), 3316–21. DOI: 10.1021/es049860w [DOI] [PubMed] [Google Scholar]
- 29.Giraud RJ; Taylor PH; Huang C. p., Combustion operating conditions for municipal Waste-to-Energy facilities in the U.S. Waste Management 2021, 132, 124–132. DOI: 10.1016/j.wasman.2021.07.015 [DOI] [PubMed] [Google Scholar]
- 30.Krug JD; Lemieux PM; Lee CW; Ryan JV; Kariher PH; Shields EP; Wickersham LC; Denison MK; Davis KA; Swensen DA; Burnette RP; Wendt JOL; Linak WP, Combustion of C1 and C2 PFAS: Kinetic modeling and experiments. J Air Waste Manag Assoc 2022, 72, (3), 256–270. DOI: 10.1080/10962247.2021.2021317 [DOI] [PubMed] [Google Scholar]
- 31.Yoo JI; Shinagawa T; Wood JP; Linak WP; Santoianni DA; King CJ; Seo YC; Wendt JO, High-temperature sorption of cesium and strontium on dispersed kaolinite powders. Environ Sci Technol 2005, 39, (13), 5087–94. DOI: 10.1021/es048064n [DOI] [PubMed] [Google Scholar]
- 32.Linak WP; Miller CA; Wood JP; Shinagawa T; Yoo J-I; Santoianni DA; King CJ; Wendt JOL; Seo Y-C, High Temperature Interactions Between Residual Oil Ash and Dispersed Kaolinite Powders. Aerosol Sci. Technol. 2004, 38, (9), 900–913. DOI: 10.1080/027868290500805 [DOI] [Google Scholar]
- 33.Method 533 - Determination of Per- and Polyfluoroalkyl Substances in Drinking Water by Isotope Dilution Anion Exchange Solid Phase Extraction and Liquid Chromatography/Tandem Mass Spectrometry. https://www.epa.gov/sites/default/files/2019-12/documents/method-533-815b19020.pdf, Accessed September 13, 2022, U.S. EPA; 2019 [Google Scholar]
- 34.Linak WP; Srivastava RK; Wendt JOL, Metal Aerosol Formation in a Laboratory Swirl Flame Incinerator. Combust. Sci. Technol. 1994, 101, (1–6), 7–27. DOI: 10.1080/00102209408951863 [DOI] [Google Scholar]
- 35.Other Test Method 45 (OTM-45) Measurement of Selected Per- and Polyfluorinated Alkyl Substances from Stationary Sources. https://www.epa.gov/sites/default/files/2021-01/documents/otm_45_semivolatile_pfas_1-13-21.pdf, Accessed September 8, 2022, U.S. EPA; 2021 [Google Scholar]
- 36.Method 19 - Determination of Sulfur Dioxide Removal Efficiency and Particulate, Sulfur Dioxide, and Nitrogen Oxide Emission Rates. https://www.epa.gov/sites/default/files/2017-08/documents/method_19.pdf, Accessed September 13, 2022, U.S. EPA; 2017 [Google Scholar]
- 37.McCord J; Strynar M, Identification of Per- and Polyfluoroalkyl Substances in the Cape Fear River by High Resolution Mass Spectrometry and Nontargeted Screening. Environ Sci Technol 2019, 53, (9), 4717–4727. DOI: 10.1021/acs.est.8b06017 [DOI] [PMC free article] [PubMed] [Google Scholar]
- 38.McCord JP; Strynar MJ; Washington JW; Bergman EL; Goodrow SM, Emerging Chlorinated Polyfluorinated Polyether Compounds Impacting the Waters of Southwestern New Jersey Identified by Use of Nontargeted Analysis. Environ Sci Technol Lett 2020, 7, (12), 903–908. DOI: 10.1021/acs.estlett.0c00640 [DOI] [PMC free article] [PubMed] [Google Scholar]
- 39.Wu B; Hao S; Choi Y; Higgins CP; Deeb R; Strathmann TJ, Rapid Destruction and Defluorination of Perfluorooctanesulfonate by Alkaline Hydrothermal Reaction. Environ. Sci. Technol. Lett. 2019, 6, (10), 630–636. DOI: 10.1021/acs.estlett.9b00506 [DOI] [Google Scholar]
- 40.Sasi PC; Alinezhad A; Yao B; Kubatova A; Golovko SA; Golovko MY; Xiao F, Effect of granular activated carbon and other porous materials on thermal decomposition of per- and polyfluoroalkyl substances: Mechanisms and implications for water purification. Water Res 2021, 200, 117271. DOI: 10.1016/j.watres.2021.117271 [DOI] [PubMed] [Google Scholar]
- 41.Singh RK; Fernando S; Baygi SF; Multari N; Thagard SM; Holsen TM, Breakdown Products from Perfluorinated Alkyl Substances (PFAS) Degradation in a Plasma-Based Water Treatment Process. Environ Sci Technol 2019, 53, (5), 2731–2738. DOI: 10.1021/acs.est.8b07031 [DOI] [PubMed] [Google Scholar]
- 42.Feng M; Qu R; Wei Z; Wang L; Sun P; Wang Z, Characterization of the thermolysis products of Nafion membrane: A potential source of perfluorinated compounds in the environment. Sci Rep 2015, 5, 9859. DOI: 10.1038/srep09859 [DOI] [PMC free article] [PubMed] [Google Scholar]
- 43.Altarawneh M, A chemical kinetic model for the decomposition of perfluorinated sulfonic acids. Chemosphere 2021, 263, 128256. DOI: 10.1016/j.chemosphere.2020.128256 [DOI] [PubMed] [Google Scholar]
- 44.Altarawneh M; Almatarneh MH; Dlugogorski BZ, Thermal decomposition of perfluorinated carboxylic acids: Kinetic model and theoretical requirements for PFAS incineration. Chemosphere 2022, 286, (Pt 2), 131685. DOI: 10.1016/j.chemosphere.2021.131685 [DOI] [PubMed] [Google Scholar]
- 45.Blotevogel J; Giraud RJ; Rappé AK, Incinerability of PFOA and HFPO-DA: Mechanisms, kinetics, and thermal stability ranking. Chem. Eng. J. 2023, 457, 141235. DOI: 10.1016/j.cej.2022.141235 [DOI] [Google Scholar]
- 46.Khan MY; So S; da Silva G, Decomposition kinetics of perfluorinated sulfonic acids. Chemosphere 2020, 238, 124615. DOI: 10.1016/j.chemosphere.2019.124615 [DOI] [PubMed] [Google Scholar]
- 47.Alinezhad A; Challa Sasi P; Zhang P; Yao B; Kubátová A; Golovko SA; Golovko MY; Xiao F, An Investigation of Thermal Air Degradation and Pyrolysis of Per- and Polyfluoroalkyl Substances and Aqueous Film-Forming Foams in Soil. ACS ES&T Engineering 2022. DOI: 10.1021/acsestengg.1c00335 [DOI] [Google Scholar]
- 48.Altarawneh M, A theoretical study on the pyrolysis of perfluorobutanoic acid as a model compound for perfluoroalkyl acids. Tetrahedron Lett. 2012, 53, (32), 4070–4073. DOI: 10.1016/j.tetlet.2012.05.109 [DOI] [Google Scholar]
- 49.Xiao F; Sasi PC; Alinezhad A; Golovko SA; Golovko MY; Spoto A, Thermal Decomposition of Anionic, Zwitterionic, and Cationic Polyfluoroalkyl Substances in Aqueous Film-Forming Foams. Environ Sci Technol 2021, 55, (14), 9885–9894. DOI: 10.1021/acs.est.1c02125 [DOI] [PubMed] [Google Scholar]
- 50.Yao B; Sun R; Alinezhad A; Kubátová A; Simcik MF; Guan X; Xiao F, The first quantitative investigation of compounds generated from PFAS, PFAS-containing aqueous film-forming foams and commercial fluorosurfactants in pyrolytic processes. J. Hazard. Mater. 2022, 436, 129313. DOI: 10.1016/j.jhazmat.2022.129313 [DOI] [PubMed] [Google Scholar]
- 51.Weber NH; Delva CS; Stockenhuber SP; Grimison CC; Lucas JA; Mackie JC; Stockenhuber M; Kennedy EM, Thermal Decomposition of Perfluorooctanesulfonic Acid (PFOS) in the Presence of Water Vapor. Ind. Eng. Chem. Res. 2022, 61, (41), 15146–15155. DOI: 10.1021/acs.iecr.2c02463 [DOI] [Google Scholar]
- 52.Duchesne AL; Brown JK; Patch DJ; Major D; Weber KP; Gerhard JI, Remediation of PFAS-Contaminated Soil and Granular Activated Carbon by Smoldering Combustion. Environ Sci Technol 2020, 54, (19), 12631–12640. DOI: 10.1021/acs.est.0c03058 [DOI] [PubMed] [Google Scholar]
- 53.Weber NH; Delva CS; Stockenhuber SP; Grimison CC; Lucas JA; Mackie JC; Stockenhuber M; Kennedy EM, Thermal Mineralization of Perfluorooctanesulfonic Acid (PFOS) to HF, CO2, and SO2. Ind. Eng. Chem. Res. 2023, Ahead of Print. DOI: 10.1021/acs.iecr.2c03197 [DOI] [Google Scholar]
- 54.Lyon R Method for the Reduction of the Concentration of NO in Combustion Effluents Using Ammonia. US 3,900,554, Aug. 19, 1975. [Google Scholar]
- 55.Arand JK; Muzio LJ; Sotter JG Urea Reduction of NOx in Combustion Effluents. US 4,208,386, Jun. 17, 1980. [Google Scholar]
- 56.Lyon RK, Thermal DeNOx Controlling nitrogen oxides emissions by a noncatalytic process. Environ. Sci. Technol. 1987, 21, (3), 231–236. DOI: 10.1021/es00157a002 [DOI] [PubMed] [Google Scholar]
- 57.Tsang W; Burgess DR; Babushok V, On the Incinerability of Highly Fluorinated Organic Compounds. Combust. Sci. Technol. 1998, 139, (1), 385–402. DOI: 10.1080/00102209808952095 [DOI] [Google Scholar]
Associated Data
This section collects any data citations, data availability statements, or supplementary materials included in this article.