Abstract
Heterogeneity at biological and transcriptomic levels poses a challenge in defining and typing low-grade glioma (LGG), leading to a critical need for specific molecular signatures to enhance diagnosis, therapy, and prognostic evaluation of LGG. This study focused on fatty acid metabolism (FAM) related genes and prognostic features to investigate the mechanisms and treatment strategies for LGG cell metastasis and invasion. By screening 158 FAM-related genes and clustering 512 LGG samples into two subtypes (C1 and C2), differential gene expression analysis and functional enrichment were performed. The immune cell scores and prognosis were compared between the two subtypes, with C1 showing poorer outcomes and higher immune scores. A four-gene signature (PHEX, SHANK2, HOPX, and LGALS1) was identified and validated across different datasets, demonstrating a stable predictive effect. Cellular experiments confirmed the roles of LGALS1 and HOPX in promoting tumor cell proliferation, migration, and invasion, while SHANK2 exhibited a suppressive effect. This four-gene signature based on FAM-related genes offers valuable insights for understanding the pathogenesis and clinical management of LGG.
Keywords: Tumor immunology, LGG, fatty acid metabolism, prognostic features, PHEX, SHANK2, HOPX, and LGALS1
Introduction
Gliomas are the most common primary central nervous system (CNS) tumors originating from glial cells, including astrocytes and oligodendrocytes, with an estimated annual incidence of 6.6 per 100,000 individuals in the USA [1,2]. In addition to histological tumor typing, each tumor is assigned a histological grade based on the degree of anaplasia, from World Health Organization (WHO) grade I to IV [3]. The WHO classification of tumours of the CNS divides gliomas into circumscribed gliomas (WHO grade I), low-grade gliomas (LGG; WHO grade II-III), and glioblastomas (GBM; WHO grade IV) based on integrated classic histological features and molecular biomarkers such as cytological atypia, anaplasia, mitotic activity, microvascular proliferation, and necrosis [4,5]. LGG is lowly aggressive and shows a relatively better prognosis than GBM [6,7].
Low-grade gliomas (LGG) are typically indolent CNS tumors that can be distinguished by specific histopathologic features [8]. The most common LGG are astrocytomas, oligodendrogliomas, and mixed oligoastrocytic tumors [9,10]. According to IDH mutation and 1p/19q co-deletion status, LGG is classified into three subclasses with distinct diagnostic and prognostic characteristics [3,11]. Tumors with IDH mutation and 1p/19q co-deletion have the best prognosis, followed by tumors with IDH mutation and no 1p/19q co-deletion and by tumors with IDH wild-type tumors [11]. A recent study reported that not all IDH wild-type LGG have a low survival rate, and there is some controversy over the definition and classification of LGG [12]. The biological and transcriptomic heterogeneity of LGG needs further exploration.
Fatty acid metabolism (FAM) includes the anabolic and catabolic processes essential for energy homeostasis, the formation of metabolic intermediates required to maintain cell membrane structure and function, cell signaling, and storage of energy [13]. Many studies have shown that changes in fatty acid metabolism are cancer cells’ markers and metabolic phenotypes [14-16]. In LGG, the expression levels of Sterol regulatory element binding protein 1 (SREBP-1) and fatty acid synthase (FAS) are increased. In contrast, the expression levels of liver X receptor (LXR), a nuclear receptor that regulates the metabolism of fatty acids and cholesterol, and SREBP-2 are decreased [17]. SREBP-1c and ChREBP are transcription factors that regulate the expression of fatty acid synthesis-related genes, including acetyl-CoA carboxylase (ACCs) and fatty acid synthase (FAS) [18]. LXR cooperates with SREBP-1c to form one of the main pathways of lipid synthesis. SREBP-1c and SREBP-2 are the main regulators of cholesterol synthesis, controlling cholesterol synthesis by regulating gene expression in the cholesterol biosynthesis pathway [19]. LXR is a nuclear receptor that cooperates with SREBP-1c and ChREBP to regulate lipid metabolism [18]. Besides, blocking the supply of lipids to cancer cells has essential effects on the bioenergetics, membrane biosynthesis, and intracellular signal transduction of cancer cells [20,21]. The study of changes in the microenvironment metabolism of glioma may provide a new marker or therapeutic target to improve the prognosis and treatment of glioma [22,23]. In recent years, inhibiting fatty acid synthesis has attracted attention as a potential cancer treatment strategy but has not yet been implemented in clinical practice [24,25]. Moreover, the prognostic value of FAM and the correlation between FAM and the tumor microenvironment (TME) in LGG remain unknown.
Our study investigated the expression and significance of FAM-characteristic genes in LGG. The molecular subtypes of the LGG model were constructed based on FAM characteristic gene set and identified two subtypes based on consistent cluster analysis. Subsequently, we evaluated the two subtypes and their prognostic and clinical features. By univariate Cox regression analysis of DEGs, we screened a four-gene signature (PHEX, SHANK2, HOPX, LGALS1) prognostic risk model for two LGG subtypes. We established a new index, FAM RiskScore (FAMR) based on the expression and significance of FAM-related genes, to predict the efficacy and prognosis of LGG therapeutic interventions. We validated it using the Chinese Glioma Genome Atlas (CGGA) gene expression dataset. We found that the constructed four-gene prognostic markers and FAMR showed good performance, indicating that the constructed four-gene characteristics provide new evidence and ideas for the classification of the prognosis of LGG patients and the determination of new LGG therapeutic targets.
Materials and methods
Data acquisition and preprocessing
The tissue expression data and clinical follow-up information of LGG patients were downloaded from The Cancer Genome Atlas (TCGA, https://www.cancer.gov/about-nci/organization/ccg/research/structural-genomics/tcga) public database. The data underwent the following processing steps: (1) Exclusion of samples lacking clinical follow-up information. (2) Conversion of the data into gene symbols. (3) Selection of the maximum expression value in cases where multiple gene symbols were present.
Downloaded the tissue expression data of LGG patients from the CGGA database (CGGA, www.cgga.org.cn/). The processing steps of RNA-Seq data were as follows: (1) Samples without clinical follow-up information were removed. (2) Samples without expression profile data were removed.
After being screened, 512 samples, 159 samples, 172 samples, and 420 samples were obtained from TCGA-LGG, CGCA-mRNA-array_301, CGCA-mRNAseq_325, and CGCA-mRNAseq_693 databases (Table 1).
Table 1.
Cohorts information
| Clinical features | TCGA-LGG | CGCA-mRNAseq_693 | CGCA-mRNAseq_325 | CGCA-mRNA-array_301 |
|---|---|---|---|---|
| OS | ||||
| 0 | 386 | 224 | 82 | 85 |
| 1 | 126 | 197 | 30 | 74 |
| DFS | ||||
| 0 | 308 | |||
| 1 | 165 | |||
| Grade | ||||
| G2 | 248 | |||
| G3 | 263 | |||
| IDH mutation | ||||
| WT | 293 | |||
| Mut | 127 | |||
| Gender | ||||
| Male | 285 | |||
| Female | 227 | |||
| Age | ||||
| ≥ 60 | 69 | |||
| < 60 | 443 | |||
| Recurrence | ||||
| Yes | 165 | |||
| No | 310 |
A total of 158 FAM-related genes (HALLMARK_FATTY_ACID_METABOLISM) were collected from MSigDB (Molecular Signature Database v7.0).
This work has been reported in line with the REMARK criteria.
Consistent cluster analysis
The TCGA expression profile data was filtered to remove genes with expression levels less than 1 in over 50% of samples. Then univariate COX analysis was conducted with a significance threshold of P < 0.05 to identify prognostic-related FAM genes. ConsensusClusterPlus was utilized to perform uniform clustering of TCGA samples (V1.48; Parameters: pFeature = 1, rep = 100, distance = “spearman”, pItem = 0.8) using D2 and euclidean distance as clustering algorithms and measures. The limma package was utilized to evaluate molecular subtype discrepancies and perform functional enrichment analysis. DAVID was implemented to investigate significantly enriched pathways, encompassing KEGG and GO pathways, across distinct LGG groups. Enriched pathways were selected based on a P-value threshold of less than 0.05 and a false discovery rate (FDR) lower than 0.25.
Division of training set and verification set
A total of 512 samples from the TCGA dataset were randomly divided into a training set and a test set in a 1:1 ratio. The selection of samples for each set was based on ensuring similarity in gender, age distribution, follow-up time, and mortality ratio of patients. Additionally, cluster analysis was used to ensure that the number of binary samples in both groups was similar. This resulted in a training set of 256 samples and a test set of 256 samples.
Lasso cox regression analysis
Lasso regression was employed to identify prognostic genes and streamline the risk model by shrinking coefficients and selecting only relevant variables. This technique effectively addresses multicollinearity in the data by penalizing coefficients and encouraging sparsity. The glmnet R-package was utilized for lasso Cox regression analysis, allowing for the selection of the optimal model through five-fold cross-validation and determination of the number of target genes based on confidence intervals at each lambda value.
Cell transfection
To perform cell transfection, we utilized specific small interfering RNA (siRNA) molecules synthesized by GenePharma (Shanghai, China). The siRNAs used were as follows: si LGALS1-Homo-438, 5’-GGUGACUUCAAGAUCAAAUTT-3’; si LGALS1-Homo-370, 5’-CAGAUGGAUACGAAUUCAATT-3’; si SHANK2-Homo-519, 5’-CGGAUCCUGUGUACAUUAATT-3’; si SHANK2-Homo-5899, 5’-GGUCAUCAAAGCUCUCAAATT-3’; si PHEX-Homo-1877, 5’-CUGCCUCAAUGGGACAAAUTT-3’; si PHEX-Homo-1499, 5’-GUGCUCAGAUUGGAAAUUATT-3’; si HOPX-Homo-136, 5’-CUGGGCUGUUACAGAAGAATT-3’; si HOPX-Homo-313, 5’-GAGACCCAGAAAUGGUUUATT-3’. These siRNAs targeted negative control (NC-siRNA), LGALS1, SHANK2, PHEX, and HOPX genes, respectively. The transfection process was conducted using Hieff Trans Liposomal Transfection Reagent obtained from Yeasen Biotechnology (Shanghai), following the manufacturer’s instructions.
MTT and CCK-8 assays
Cell proliferation assays were conducted on SW1088 cells cultured in a 96-well plate format. The initial seeding density was 3,000 cells per well in 100 μl of DMEM supplemented with 10% FBS. To assess cell proliferation via the Cell Counting Kit-8 (CCK-8) method, the original medium in each well was substituted with 100 μl of complete culture medium containing 10 μl of diluted CCK-8 solution, following the Biosharp protocol. After incubating for 1 hour at 37°C in the dark, the viable cell count was determined by measuring the absorbance at 450 nm. For MTT assays, 10 μl of MTT solution from Solarbio was introduced to each well after 48 hours of cell culture. Subsequent to a 2-hour incubation, the culture medium was removed, and the optical density was measured at 490 nm using a Microplate Reader.
Wound healing assay
The wound healing assay was performed by initially culturing SW1088 cells in a six-well plate until a confluent monolayer was established. A linear scratch was meticulously created using a 200-μl plastic pipette tip. Subsequently, the cells were washed three times with PBS to eliminate any cellular debris. Wound images were acquired at predetermined time points using a Leica Corporation IX71 inverted microscope and analyzed via ImageJ software. All experimental procedures were conducted in triplicate, adhering to the preestablished study protocol.
Transwell assay
Matrigel-coated transwell chambers were employed in the transwell assay to evaluate cell invasion capacity. Transfected cell lines were cultured and seeded in the upper chamber containing serum-free medium, while the lower chamber was supplemented with complete culture medium. Following incubation, non-invasive cells remaining in the upper chamber were removed, and the invaded cells present in the lower chamber were fixed and stained. The extent of cell invasion was quantified by counting the invaded cells in ten randomly selected fields. This assay facilitates the assessment of cell invasiveness and the investigation of how specific genes or experimental conditions can modulate cellular invasion capabilities.
Results
Workflow of this study
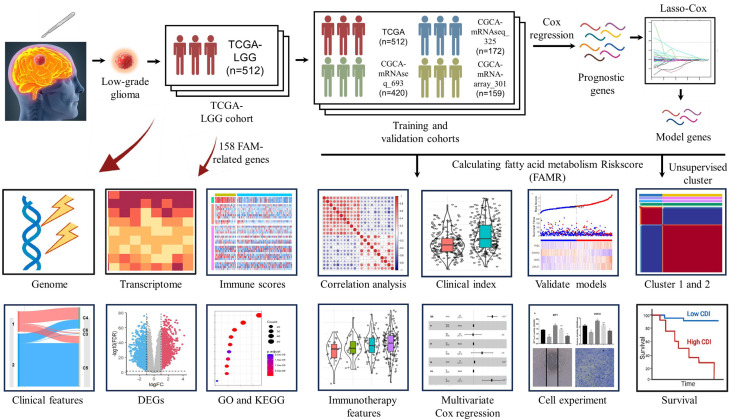
For training and validation cohorts, we identified 512 patients from TCGA-LGG, 420 patients from CGCA-mRNAseq_693, 172 patients from CGCA-mRNAseq_325, and 159 patients from CGCA-mRNA-array_301 databases. And, 158 Fatty acid metabolism-related genes were brought into the analysis. The flow diagram of this study is showed in the Figure 1.
Figure 1.
Flowchart for comprehensive analysis of fatty acid metabolism in postoperative patients with Low-grade gliomas (LGG).
Identification of molecular subtypes based on FAM-related gene
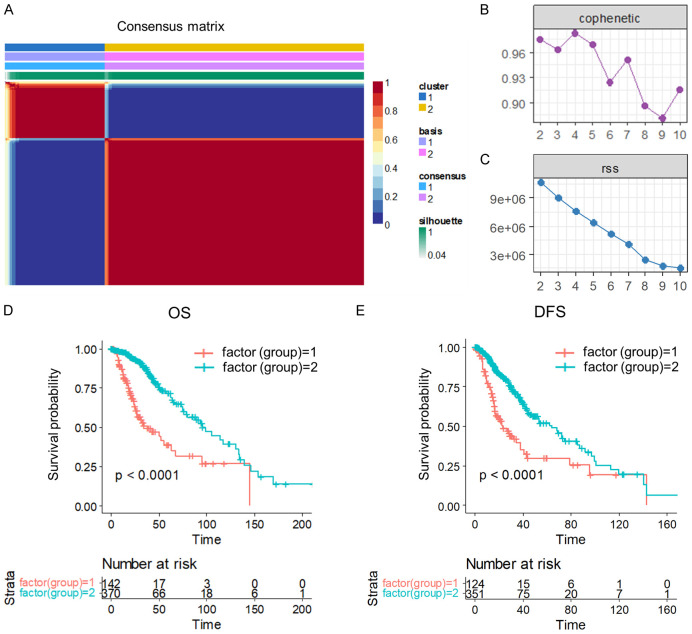
We initially extracted the expressions of 158 FAM-related genes from TCGA LGG data. Subsequently, we conducted univariate Cox analysis in R, leading to the identification of 67 genes that were significantly associated with LGG prognosis (Table S1) (P < 0.05). Utilizing non-negative matrix factorization (NMF), we clustered LGG samples based on the expression of these 67 genes. After evaluating the synthesis and residuals sum of squares, we determined that the optimal clustering was achieved at k = 2, with a cutoff for percent survival set at 50%, resulting in the classification of LGG samples into two molecular subtypes (C1 and C2) (Figure 2A-C). The stability of the clustering obtained by NMF was further evaluated through the distribution at rank = 2-10, with the resultant correlation reflecting the consistency matrix proposed by Brunet et al. This value, ranging from 0 to 1, indicates the stability of the clusters, with a higher value implying a more stable cluster (Figure 2B). Additionally, the residual sum of squares (RSS) was utilized to assess the clustering performance of the model, where a smaller value suggests better clustering. This analysis was crucial in determining the optimal clustering of LGG samples into molecular subtypes (Figure 2C).
Figure 2.
Molecular subtyping of LGG and prognostic survival analysis. (A) Consensus map of NMF clustering. (B) The resultant distribution at rank = 2-10. (C) The RSS distribution with rank = 2-10. (D, E) Overall survival (OS) prognostic survival curve (D) and disease-free survival (DFS) prognostic survival curve (E) of LGG molecular subtypes.
Further analysis of the prognosis between the two subtypes revealed significant differences in overall survival (OS) (Figure 2D) between C1 and C2, with C1 having a worse prognosis. Moreover, patients in the C2 group were more likely to have better disease-free survival (Figure 2E), indicating significant differences in survival rates between the two groups after surgery.
Comparison and analysis of clinical features between molecular subtypes
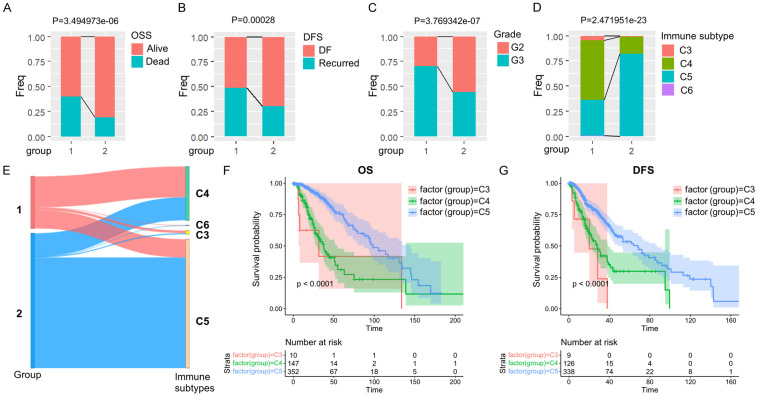
Subsequently, we conducted a thorough analysis and comparison of the clinical features of the two subtypes. Our findings revealed that the survival rate was significantly lower in the C1 group compared to the C2 group (Figure 3A), and the recurrence rate of tumors was higher in the C1 group (Figure 3B). Furthermore, there was a higher prevalence of poor prognosis G3 in the C1 group as opposed to the C2 group (Figure 3C).
Figure 3.
Comparison of clinical and molecular immune features in LGG subtypes. A-D. Comparison of the distribution of two subtypes in various clinical features and molecular immune subtypes in the TCGA dataset. E. Comparison of existing molecular immune subtypes with two subtypes. F, G. KM OS time and DFS time curves among existing immune molecule subtypes.
In human tumors, six types of immune infiltration have been identified, which include Cluster 1 (wound healing), Cluster 2 (INF-γ dominant), Cluster 3 (inflammatory), Cluster 4 (lymphocyte depleted), Cluster 5 (immunologically quiet), and Cluster 6 (TGF-β dominant) [26]. When comparing this classification method with the one used in our study, we observed that the C1 group had the highest proportion of Cluster 4. In contrast, Cluster 5 accounted for most of the C2 group (Figure 3D and 3E). Additional analysis of the prognosis between Cluster 4 and Cluster 5 showed significant disparities in overall survival (OS) (Figure 3F) and disease-free status (DFS) (Figure 3G) between the two clusters. It was observed that Cluster 4 had a poorer prognosis compared to Cluster 5, suggesting that FAM molecular subtype C1 consists of more immune subtypes with unfavorable outcomes.
Subtypes with poor prognosis had higher immune scores
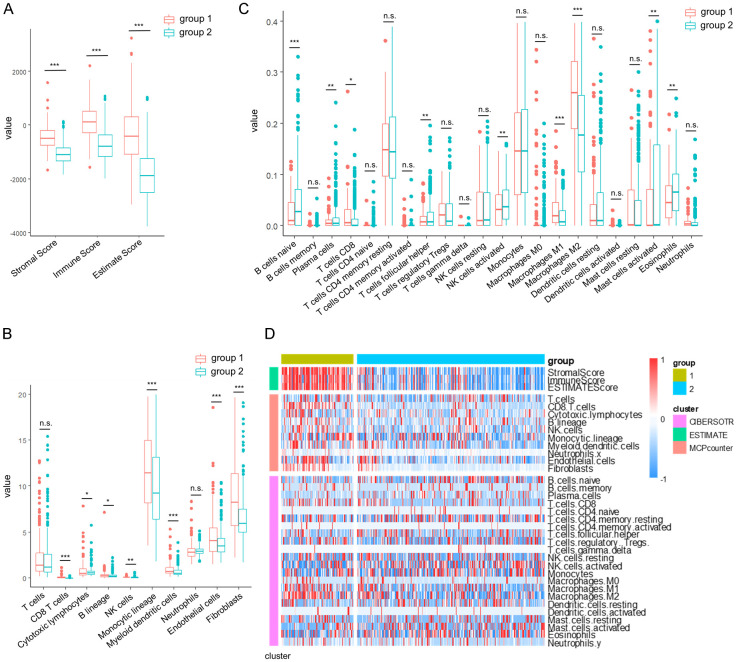
We utilized the R software package ESTIMATE to assess the StromalScore, ImmuneScore, and ESTIMATEScore of the C1 and C2 molecular subtypes. Our analysis revealed that the C1 subtype exhibited higher immune scores compared to the C2 subtype (Figure 4A). Subsequently, we employed the R software packages MCPcounter and CIBERSOTR to evaluate the scores of ten and twenty-two immune cells between C1 and C2. Our findings demonstrated that C1 had elevated immune cell scores in various cell types, including CD8 T cells, M1 macrophages, M2 macrophages, Monocytic lineage, Endothelial cells, and Fibroblasts (Figure 4B and 4C). Additionally, the heatmap of immune scores further supported that C1 had higher immune cell scores than C2 (Figure 4D).
Figure 4.
Comparison of immune scores in LGG molecular subtypes. (A-C) Comparison of Estimated immunity scores (A), MCPcounter immune scores (B), and CIBERSOTR immunity scores (C) between molecular subtypes in the TCGA dataset. (D) Heat map comparing immune scores between molecular subtypes in the TCGA data set by three immune software. The data in (A-C) are shown as the mean ± SEM. *P < 0.05; **P, 0.01; ***P, 0.001 (two-way ANOVA followed by Tukey’s multiple comparisons for A-C).
Identification of DEGs and functional analysis of pathways between subtypes
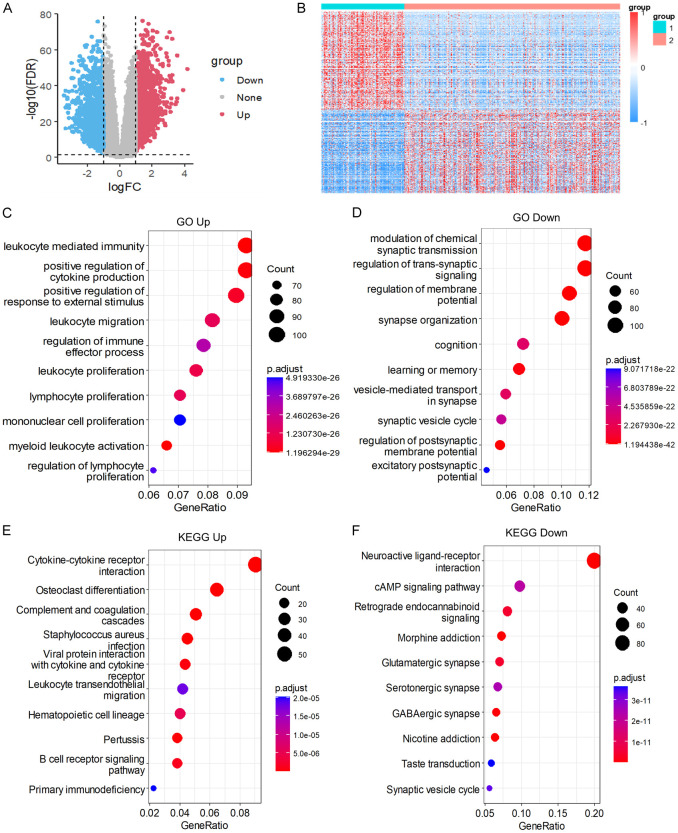
Using the limma package and applying a filter with the criteria of |log2FC| > 1 and FDR < 0.01, we identified a total of 2325 DEGs, with 1260 genes up-regulated and 1065 genes down-regulated (Figure 5A). The list of DEGs can be found in Table S2. Subsequently, we generated a heatmap visualizing all the differentially expressed genes (Figure 5B).
Figure 5.
Differential gene expression and pathway analysis in LGG molecular subtypes. (A) Volcanic map of differentially expressed genes in two groups. (B) Heat map of differentially expressed genes in two groups. (C, D) Biological processes (BP) of molecular subtypes differentially up-regulated genes (C), molecular subtypes differentially down-regulated genes (D). (E, F) KEGG of molecular subtypes differential up-regulation gene (E) and differential down-regulation gene (F).
Functional enrichment analysis of the 2325 DEGs was conducted using the Goplot R package. Our analysis revealed that the up-regulated pathways were primarily associated with leukocyte-mediated immunity, positive regulation of cytokine production, lymphocyte proliferation, and myeloid leukocyte activation (Figure 5C). In contrast, the down-regulated pathways included modulation of chemical synaptic transmission, regulation of membrane, learning or memory, and regulation of postsynaptic membrane potential (Figure 5D).
Furthermore, KEGG pathway enrichment analysis was performed specifically for the DEGs of the C1 subtype. The up-regulated pathways were mainly related to osteoclast differentiation, complement and coagulation cascades, cytokine-cytokine receptor interaction, and leukocyte transendothelial migration (Figure 5E). On the other hand, the down-regulated pathways encompassed neuroactive ligand-receptor interaction, morphine addiction, retrograde endocannabinoid signaling, glutamatergic synapse, cAMP signaling pathway, and synaptic vesicle cycle (Figure 5F).
Construction of a prognostic risk model
To construct the RiskScore model, a total of 512 patients were randomly divided into training and test sets, each consisting of 256 samples. Through univariate regression Cox risk model analysis of survival data, we identified 857 prognosis-associated genes, applying a threshold of P < 0.01 for filtering (Table S3).
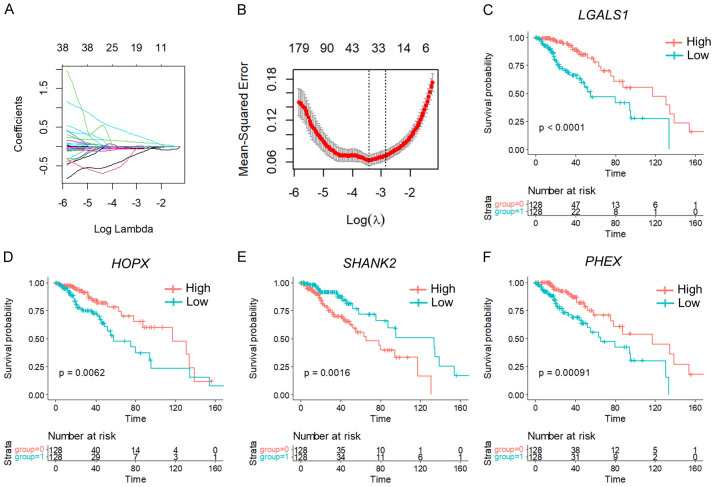
To refine the gene selection, we conducted lasso cox regression analysis using the R-package glmnet to investigate the trajectories of independent variables. The analysis revealed 33 target genes at lambda = 0.01554491, deemed suitable for the model (Figure 6A, 6B). Additionally, we employed the Akaike information criterion (AIC) method to further reduce the number of target genes, resulting in the selection of four genes (PHEX, SHANK2, HOPX, and LGALS1) from the initial 48 genes. Kaplan-Meier (KM) curves demonstrated that PHEX, HOPX, and LGALS1 were negatively associated with patient survival, while SHANK2 showed a positive correlation in the TCGA training set (Figure 6C-F).
Figure 6.
Trajectory analysis and gene prognostic significance in LGG. A. Independent variable trajectories: horizontal axis (representing the logarithm of the dependent variable) and vertical axis (representing the coefficient of the independent variable). B. Confidence intervals for each λ. C-F. KM Curves of 4 Genes in TCGA training set.
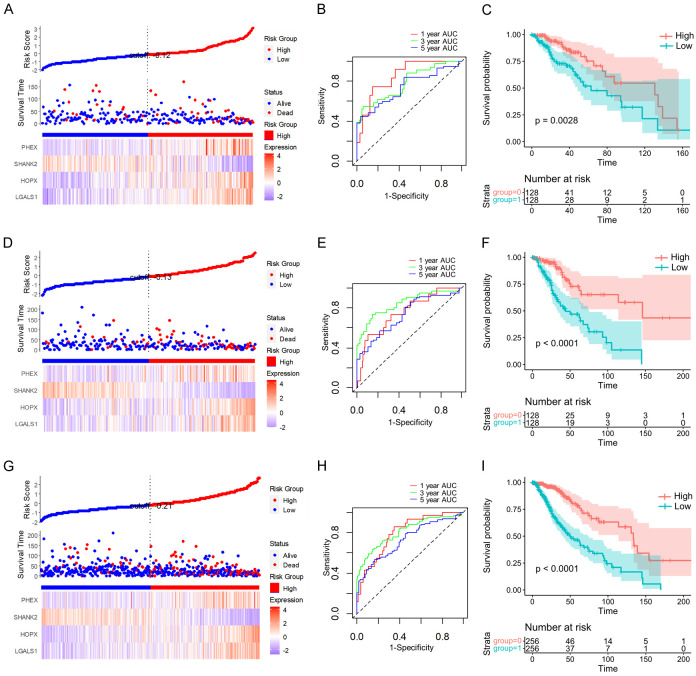
Using the four gene expression levels, the FAMR was calculated for each sample with the ggRISK package, where higher FAMR values indicated a poorer prognosis (Figure 7A). The prognostic prediction efficiency at 1 year, 3 years, and 5 years was evaluated using the R package timeROC, showing AUCs above 0.7 (Figure 7B). Furthermore, the KM curve based on the high and low FAMR groups illustrated a significantly worse prognosis for the high FAMR group (Figure 7C).
Figure 7.
Prognostic significance and classification performance of four genes in LGG. FAMR, survival time, survival state, and four gene expressions of the TCGA training set (A), the TCGA validation set (D), and the full TCGA dataset (G). ROC curve and AUCs of four gene features classification in TCGA training set (B), the TCGA validation set (E), and the full TCGA dataset (H). The KM survival curve distribution of four gene features in the TCGA training set (C), the TCGA validation set (F), and the full TCGA dataset (I).
Validation of risk models
To ensure the robustness of the model, we conducted identical model analyses on the TCGA test dataset. Moreover, the FAMR distribution of the TCGA test dataset indicated that higher FAMR is related to worse prognosis (Figure 7D). Furthermore, using R package timeROC to analyze the prognostic prediction efficiency at 1 year, 3 years, and 5 years, the result showed that the AUCs of the model were higher than 0.7 (Figure 7E). The KM curve indicated that the high FAMR group had a significantly worse prognosis in the TCGA test dataset (Figure 7F).
Subsequent analysis of the FAMR distribution across the entire TCGA dataset revealed that high FAMR levels in LGG patients were associated with a poorer prognosis (Figure 7G). Evaluation of the prognostic prediction efficiency indicated AUCs above 0.6 for the model (Figure 7H). Furthermore, the KM curve demonstrated a significantly worse prognosis for the high FAMR group among LGG patients (Figure 7I).
External datasets verified the robustness of the FAMR
To further validate the stability and generalizability of the four gene signatures we identified, we utilized three CGGA datasets (CGCA-mRNAseq_693, CGCA-mRNAseq_325, and CGCA-mRNA-array_301) to assess the FAMR.
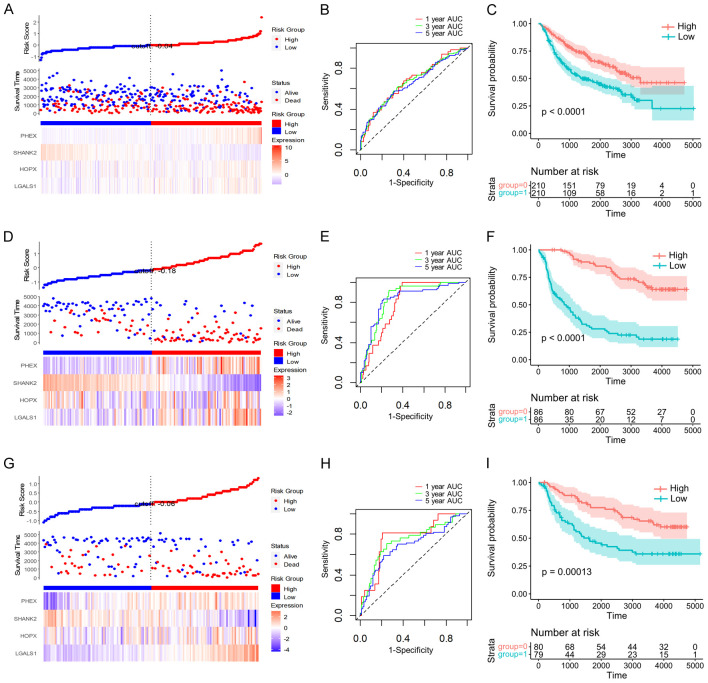
Consistent with our previous findings, higher FAMR levels were associated with a poorer prognosis in all three CGGA datasets (Figure 8A, 8D and 8G). The model’s AUCs were above 0.65, indicative of robust prognostic prediction efficiency (Figure 8B, 8E and 8H). Additionally, the KM curve illustrated a significantly worse prognosis for the high FAMR group among LGG patients in these datasets (Figure 8C, 8F and 8I).
Figure 8.
Prognostic significance and classification performance of four genes in multiple CGGA databases. FAMR, survival time, survival state, and four gene expressions of the CGGA-mRNA-array_301 database (A), the CGGA-mRNAseq_325 database (D), the CGGA-mRNAseq_693 database (G). ROC curve and AUCs of four gene feature classifications in the CGGA-mRNA-array_301 database (B), the CGGA-mRNAseq_325 database (E), the CGGA-mRNAseq_693 database (H). The KM survival curve distribution of four gene features in the CGGA-mRNA-array_301 database (C), the CGGA-mRNAseq_325 database (F), and the CGGA-mRNAseq_693 database (I).
Correlation analysis of risk model with clinical features and pathways
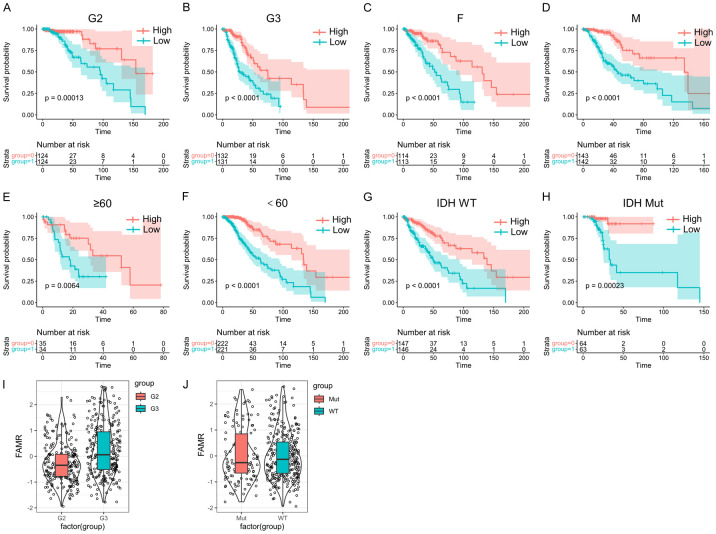
We conducted further analyses to explore the prognostic associations of LGG samples based on different clinical characteristics. Across various grade groups, gender-stage groups, age groups, and IDH mutation stage groups, it was consistently observed that the high FAMR group exhibited a worse prognosis (Figure 9A-H, P < 0.05), underscoring the strong predictive capability of the four-gene model. Notably, samples in the G3 stage displayed higher FAMR levels than those in the G2 stage, with a direct correlation between higher grade and elevated FAMR levels (Figure 9I and 9J, P < 0.05).
Figure 9.
Prognostic significance of Riskscore in LGGs stratified by clinical features. (A-H) According to FAMR, the patients in the G2 group (A), the patients in the G3 group (B), the patients in the female group (C), the patients in the male group (D), patients aged ≥ 60 groups (E), patients aged < 60 groups (F), patients in IDH WT group (G) and patients in IDH mutation group (H) were divided into two groups with significant prognosis. (I) FAMR in G2 and G3 of LGGs. (J) FAMR in IDH WT group and IDH mutation group of LGGs.
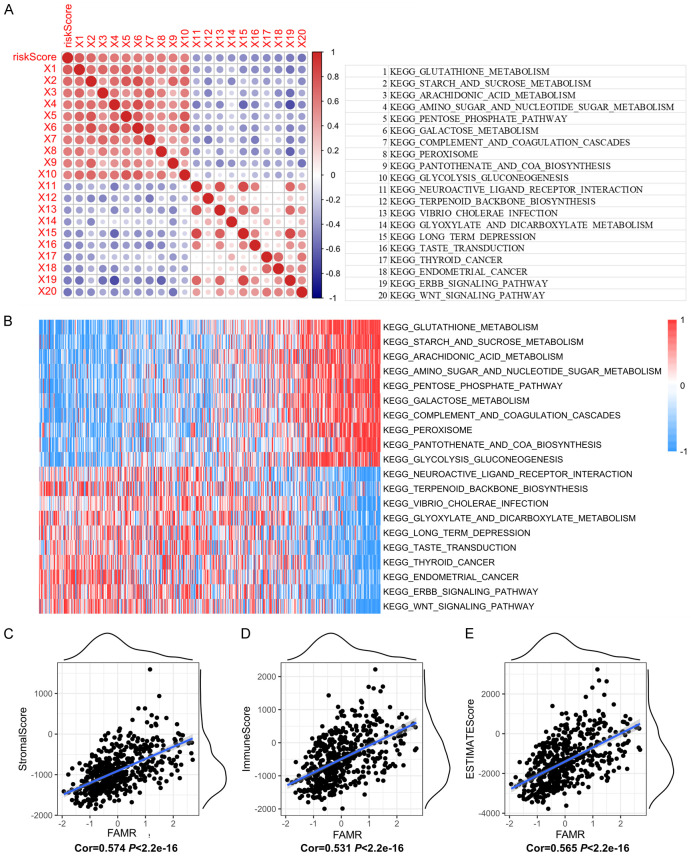
Furthermore, we performed single-sample GSEA to investigate the gene expression profiles of different samples and their biological functions in relation to FAMR. Analysis of the correlation between FAMR and KEGG pathways revealed the top 10 positively correlated pathways, which included ARACHIDONIC_ACID_METABOLISM, STARCH_AND_SUCROSE_METABOLISM, and GLUTATHIONE_METABOLISM. These pathways are associated with inflammatory processes, cardiovascular biology, carcinogenesis, and the regulation of reactive oxygen species (ROS) (Figure 10A and 10B). Conversely, the top 10 negatively correlated KEGG pathways, such as ENDOMETRIAL_CANCER, ERBB_SIGNALING_PATHWAY, and WNT_SIGNALING_PATHWAY, are linked to tumorigenesis, cell proliferation, cell migration, differentiation, apoptosis, embryonic development, tissue homeostasis, and cell determination and proliferation (Figure 9A and 9B).
Figure 10.
Association of FAMR with signaling pathways and immune/stromal scores in LGGs. (A) Correlation between FAMR and KEGG signaling pathway score. (B) Heat map of the KEGG signaling pathway. (C-E) The correlation between FAMR and StromalScore (C), ImmuneScore (D), and ESTIMATEScore (E).
Additionally, we assessed the correlation between immune scores and FAMR, revealing a positive correlation between StromalScore, ImmuneScore, ESTIMATEScore, and FAMR levels (Figure 10C-E).
FAMR as a potential prognosis signature for clinical outcome
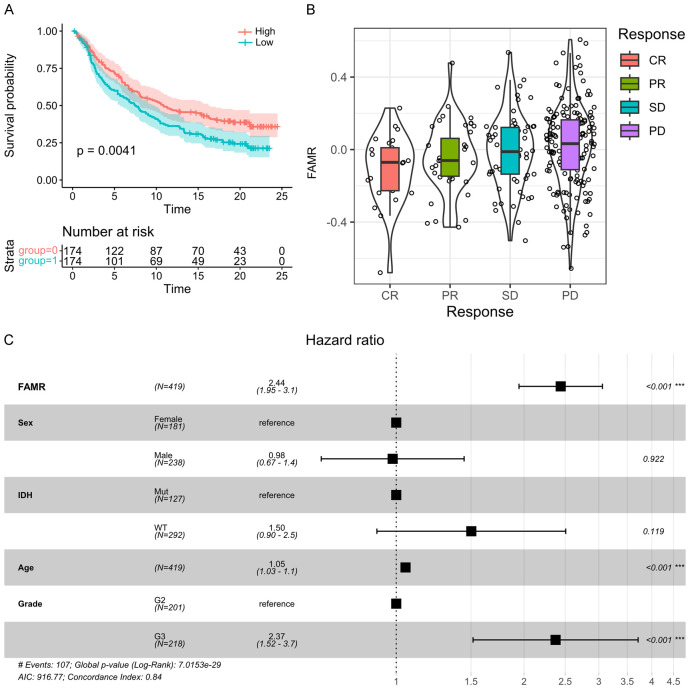
In LGG patients undergoing immunotherapy, higher FAMR values are associated with worse survival outcomes, as depicted by the KM curve (Figure 11A). Patients exhibiting stable disease (SD) or progressive disease (PD) were categorized as non-responders, while those achieving complete response (CR) or partial response (PR) were classified as responders. Upon comparison across different groups, responders displayed significantly lower FAMR levels than non-responders. Notably, a lower proportion of samples exhibited response to immunotherapy (CR+PR) in the high-risk group compared to the low-risk group (Figure 11B).
Figure 11.
Prognostic significance of FAMR in LGG patients receiving immunotherapy. A. The KM survival curve distribution of different FAMR groups in LGG patients receiving immunotherapy. B. FAMR in SD, PD, CR, and PR groups of LGG patients receiving immunotherapy. C. Forest map of multivariate cox regression analysis.
Furthermore, through multivariate COX regression analysis assessing the clinical independence of the four gene features in the TCGA dataset, it was observed that FAMR was significantly correlated with the survival rate (Figure 11C). These findings underscore the robust clinical predictive performance of our four-gene signature model.
Functions of LGALS1, SHANK2, PHEX and HOPX in migration, invasion and proliferation of LGG cells
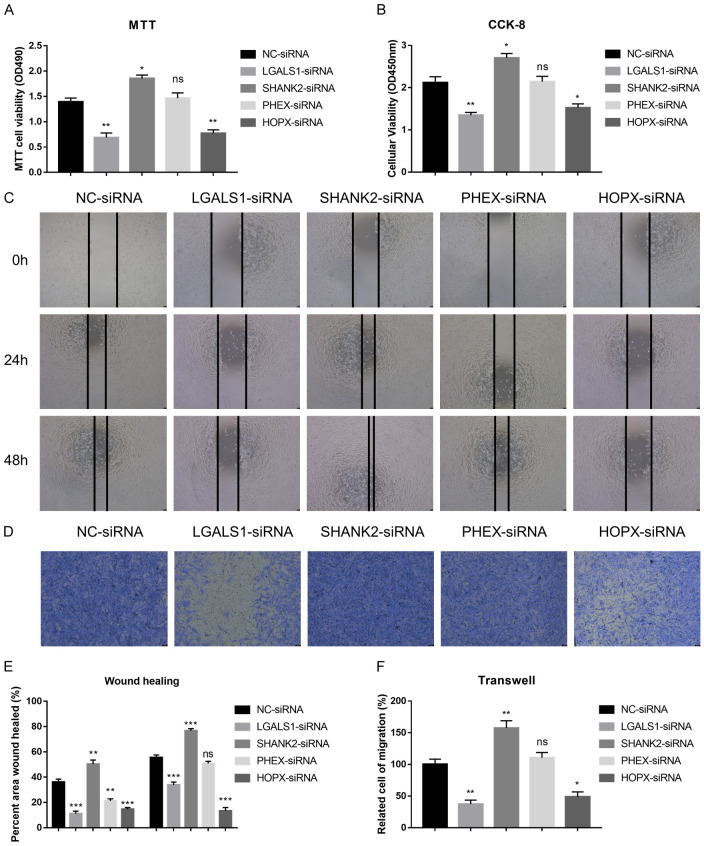
To explore the functional implications of LGALS1, SHANK2, PHEX, and HOPX in LGG, we conducted siRNA knockdown experiments targeting these genes to evaluate their impact on the proliferation, migration, and invasion abilities of LGG cell lines, specifically SW1088 cells. Through MTT and CCK-8 assays, we observed significant suppression of cell proliferation following knockdown of LGALS1 and HOPX, while SHANK2 knockdown notably enhanced cell proliferation compared to the control group. These results underscore the pivotal roles of these genes in modulating cell growth (Figure 12A and 12B).
Figure 12.
Illustrates the roles of PHEX, SHANK2, HOPX, and LGALS1 in the proliferation, migration, and invasion of LGG cells. (A) Impact of gene knockdown on cell proliferation in SW1088 cells assessed using the MTT assay. (B) Evaluation of cell proliferation after knockdown of the specified genes using the CCK-8 assay in SW1088 cells. (C) Assessment of cell migratory abilities following knockdown of the mentioned genes through wound healing assays in SW1088 cells. (D) Examination of cell invasive capacities upon knockdown of the indicated genes using transwell assays in SW1088 cells. (E) Statistical analysis of the wound healing assays mentioned in (C). (F) Statistical evaluation of the transwell assays as mentioned in (D).
Moreover, wound healing assays were performed to assess cell migration. Knockdown of LGALS1 and HOPX led to a marked reduction in cell migration compared to the control group, whereas SHANK2 knockdown resulted in increased cell migration capabilities (Figure 12C and 12E). Additionally, transwell assays were utilized to evaluate cell invasion. Knockdown of LGALS1 and HOPX significantly decreased cell invasiveness, indicating their roles in promoting cell invasion. In contrast, SHANK2 knockdown promoted cell invasive properties compared to the control group (Figure 12D and 12F).
In summary, our findings demonstrate that the knockdown of LGALS1 and HOPX suppresses cell proliferation, migration, and invasion in SW1088 cells, while silencing SHANK2 enhances these cellular processes. These results underscore the pivotal roles of LGALS1, HOPX, and SHANK2 in regulating the proliferative, migratory, and invasive capabilities of SW1088 cells. These observations suggest their potential as therapeutic targets for impeding tumor progression and metastatic dissemination.
Differential correlation of fatty acid metabolism-related 4 genes with PD-1 expression in LGG
We further substantiated the relationship between the expression of specific fatty acid metabolism-related genes and PDCD1 (PD-1) expression in low-grade glioma. As illustrated in the series of scatter plots, LGALS1 shows the highest positive correlation with PDCD1 expression among the four genes evaluated, consistent with our hypothesis about its role in modulating immune responses within the tumor microenvironment (Figure 13A). The correlation coefficients further reveal that PHEX and HOPX also positively correlate with PDCD1, albeit to a lesser extent than LGALS1 (Figure 13B and 13D). In contrast, SHANK2 exhibits a negative correlation with PDCD1 expression (Figure 13C), suggesting its unique role in potentially modulating immune checkpoints differently compared to the other three genes.
Figure 13.
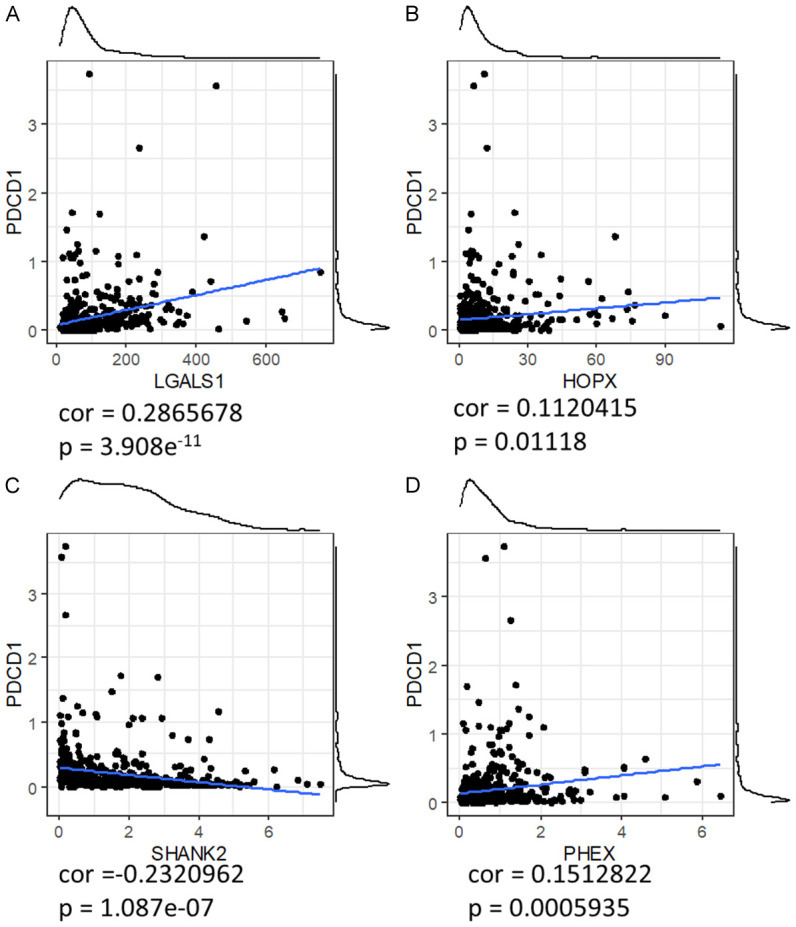
Correlation between FAM-Related 4 gene expression and PDCD1 expression in low-grade glioma. (A-D) Panels show scatter plots of gene expression (X-axis) versus PDCD1 expression (Y-axis) for each of the four genes: LGALS1 (A), HOPX (B), SHANK2 (C), and PHEX (D). Each dot represents an individual patient sample. Blue lines indicate the trend lines derived from linear regression analysis. Correlation coefficients (r) are as follows: LGALS1 (r = 0.323), HOPX (r = 0.152), SHANK2 (r = -0.232), and PHEX (r = 0.151). These results demonstrate the varying degrees of association between gene expression and PDCD1 levels, highlighting the potential regulatory roles of these genes in immune checkpoint pathways.
This differential association highlights the complex interplay between these genes and PD-1, which is crucial for understanding how alterations in fatty acid metabolism could influence immune evasion mechanisms and responsiveness to immunotherapy in low-grade glioma.
Discussion
With significant progress in surgical excision and chemotherapy, LGG patients have a better prognosis, while high-grade glioma (HGG) patients have a poor prognosis due to their aggressive nature [27,28]. Although 5-year overall survival (OS) is 85% for LGG patients, progression-free survival (PFS) is about 40% for those with unresectable/treatable residual disease, making the prognosis grim [29]. However, LGG is heterogeneous, and it is still controversial for the definition and typing of LGG [3,30]. Hence, the demand for precise and feasible molecular signatures is critical to facilitate accurate diagnosis, personalized therapy, and prognostic assessment of LGG.
There is increasing evidence that gliomas of different molecular subtypes differ in the tumor microenvironment. To improve the efficacy of current immunotherapy, we need to learn more about the tumor immune microenvironment of LGG [31,32]. Tumor molecular subtypes based on predictive prognosis and TME composition have become a hot topic in cancer research. However, few studies have fully understood the overall role of FAM in tumor molecular subtypes, especially in LGG [33]. This study developed a novel four-gene panel (PHEX, SHANK2, HOPX, and LGALS1) with strong prognostic potential derived from FAM-related genes. The prognostic value of these markers was validated in three additional independent databases.
PHEX (phosphate-regulating gene with homologies to endopeptidases located on the X chromosome) regulates phosphate homeostasis and skeletal mineralization [34,35]. PHEX is highly expressed in osteoblasts and odontoblasts, and there is substantial evidence that loss of PHEX function indirectly leads to the secretion of osteoblast-specific factors that inhibit renal phosphate processing and mineralization [36]. Some studies indicated that PHEX has a critical role in X-linked hypophosphatemia (XLH) and tumor-induced osteomalacia (TIO), both of which have proximal renal tubular dysfunction that leads to increased renal clearance of inorganic phosphorus and hypophosphatemia [37-39]. Raquel et al. reported that PHEX degradation (and thus inactivation) could influence the inappropriate processing of osteopontin (OPN) to promote tumor metabolism in squamous cell carcinoma (SCC) tumors [40]. Given the limited research on PHEX in other tumors, our findings suggest that PHEX can serve as a prognostic indicator for LGG, highlighting the need for further investigation into its role in LGG. Targeting PHEX could potentially inhibit LGG growth by restoring normal phosphate regulation. However, further research is needed to determine the effectiveness of this approach.
SHANK2 (SH3 and multiple ankyrin repeat domains protein 2) encodes scaffold proteins in the excitatory neurons’ postsynaptic membrane. These scaffold proteins play a vital role in the formation, homeostasis and stability of synapses, and thus are involved in the induction and maturation of dendritic spines [41]. Numerous studies have found that mutations in SHANK family genes, including SHANK2, are associated with autism spectrum disorders (ASDs) and other neuropsychiatric and neurodevelopmental disorders [42-44]. SHANK2 is an evolutionarily conserved regulatory of the Hippo pathway amplified frequently in human cancers. In vivo, SHANK2 promotes cell transformation and tumor formation [45]. We have screened that SHANK2 could be a prognostic marker for LGG. Since SHANK2 expression is primarily limited to the nervous system of normal adult tissues, SHANK2 may be an exciting target for the anticancer therapy of LGG. Targeting SHANK2 could potentially disrupt the signaling pathways that contribute to LGG growth.
HOPX (the homeodomain-only protein homeobox) is the smallest member of the homeodomain-containing protein family, but unlike other homeodomain proteins, the HOPX protein does not bind DNA directly [46]. HOPX is widely expressed in a variety of tissues and plays an essential role in cardiac and lung development [47], trophoblast differentiation [48], skeletal muscle differentiation [49], and late differentiation of lens fiber cells [50]. HOPX has low expression or high methylation levels in tumors, and epigenetic silencing of HOPX is common and specific [46]. The promoter methylation of HOPX is the primary mechanism of downregulation. The gene has been characterized as a tumor suppressor in colorectal cancer (CRC) [51], lung cancer [52], breast cancer [53], cutaneous squamous cell carcinomas (SCC) [54], nasopharyngeal carcinoma [55], gastric cancer [56] and acute myeloid leukemia [57]. We have screened HOPX as a prognostic marker for LGG, and its function in LGG is worth further study. Targeting HOPX could potentially inhibit LGG growth by promoting differentiation and reducing proliferation.
LGALS1 encodes the galectin-1 protein, a member of the beta-galactoside binding protein family [58]. LGALS1 is widely expressed in various immune and tumor cells, and is involved in immune system homeostasis, tumor cell growth, and cell-cell and cell-matrix interactions [59]. In pancreatic ductal adenocarcinoma, galectin-1 regulates the invasion, proliferation, and metastasis of tumor cells, and galectin-1 has been implicated in the progression of melanoma [60]. In addition, galectin-1 has also been reported to induce epithelial-mesenchymal transition (EMT) in the liver, ovarian, and other cancer [61,62]. Galectin-1 is highly expressed in various tumors and is involved in the negative regulation of immune response [63,64]. Inhibition of galectin-1 in tumors increased T cell activity, suggesting that galectin-1 is essential in regulating tumor immunity [65]. GBMs with high expression of LGALS1 have immunosuppressive characteristics. Knocking down the expression of LGALS1 can reshape the immunosuppressive microenvironment of GBM by down-regulating M2 macrophages and suppressing immunosuppressive cytokines [66]. LGG is also a type of glioma, and we found that LGALS1 can be used as a prognostic marker. Whether LGALS1 is involved in regulating the tumor immune microenvironment of LGG should be studied.
Metabolic reprogramming is a hallmark of malignancy and is associated with cancer initiation, progression and resistance to therapy [67]. In LGG, metabolic reprogramming has been observed in increased expression levels of SREBP-1 and FAS, while LXR and SREBP-2 expression levels are decreased. Metabolic reprogramming from glycolysis to fatty acid uptake and beta-oxidation has also been observed in cancer cells [68]. In our study, we constructed molecular subtypes of the LGG model based on FAM-associated genes and constructed a four-gene signature (PHEX, SHANK2, HOPX, and LGALS1) prognostic risk model using DEGs identified in the LGG molecular subtypes and validated it using the CGGA gene expression dataset. Our discovery of the close association between the four gene markers and the invasion, growth, and metastasis of LGG tumor cells indicates that these markers are reliable biomarkers for predicting the prognosis of LGG.
In our manuscript, we have identified a four-gene signature significantly associated with fatty acid metabolism (FAM) in low-grade glioma (LGG) and its potential implications for the immune microenvironment. A further analysis aimed to elucidate how these genes might interact with key immune checkpoints, specifically PD-1 (PDCD1), which plays a crucial role in the modulation of immune responses within the tumor milieu. Our extended analyses have demonstrated a notable correlation between our four-gene signature and PD-1 expression levels. Notably, LGALS1 emerged as a significant mediator within this context. This finding is consistent with the established roles of FAM in influencing the immune microenvironment through various mechanisms, including the modulation of lipid signaling pathways that can impact the proliferation and activation of immune cells.
Fatty acids and their metabolites are known to modulate immune responses by altering cell membrane compositions, signaling pathways, and gene expression profiles. These molecules can influence the behavior of various immune cells, including T cells, macrophages, and dendritic cells, which are pivotal in tumor immune surveillance and response. In the context of PD-1, fatty acids may affect the expression and function of this checkpoint, thereby modulating the efficacy of immune checkpoint blockade therapies. LGALS1, in particular, has shown a strong correlation with PD-1 expression, suggesting that its role in FAM might extend to regulating the activity of PD-1 expressing cells, such as T cells and NK cells. This could potentially explain the mechanisms by which alterations in FAM influence the immune escape of LGG cells, contributing to tumor progression and affecting patient prognosis.
These findings highlight the complex interplay between metabolism and immune regulation in the tumor microenvironment. They also underscore the potential of targeting metabolic pathways as a therapeutic strategy in conjunction with immune checkpoint inhibitors. By modulating FAM-related pathways, it may be possible to enhance the efficacy of PD-1 based therapies, thereby offering a dual approach to treating LGG by disrupting both metabolic and immune evasion strategies utilized by tumor cells. This in-depth exploration into the relationship between FAM, the immune microenvironment, and PD-1 provides a promising avenue for future research and therapeutic development. Further studies are necessary to validate these findings and to explore the therapeutic potential of combining FAM modulation with immune checkpoint inhibition in LGG and other cancers.
Although our results uncovered some exciting phenomena and genetic signatures, some limitations exist. Although our model built based on ATGC has been well verified in the CGGA database, data from more platforms are needed to further verify our model’s performance. Further cell experiments and animal studies are needed for the 4 genes identified in this study to explore their role in FAM and cancer.
Acknowledgements
This work was supported by the National Natural Science Foundation of China (82303238, 82373336); The Science and Technology Support Program of Sichuan Province (2024NSFSC1945, 2024NSFSC1761, 2023NSFSC0677, 2022YFQ0077), The Third People’s Hospital of Chengdu Scientific Research Project (2023PI18) and The Third People’s Hospital of Chengdu Clinical Research Program (CSY-YN-01-2023-013, CSY-YN-01-2023-025, CSY-YN-01-2023-005).
Disclosure of conflict of interest
None.
Table S1
Table S2
Table S3
References
- 1.Reifenberger G, Wirsching HG, Knobbe-Thomsen CB, Weller M. Advances in the molecular genetics of gliomas - implications for classification and therapy. Nat Rev Clin Oncol. 2017;14:434–452. doi: 10.1038/nrclinonc.2016.204. [DOI] [PubMed] [Google Scholar]
- 2.Finch A, Solomou G, Wykes V, Pohl U, Bardella C, Watts C. Advances in research of adult gliomas. Int J Mol Sci. 2021;22:924. doi: 10.3390/ijms22020924. [DOI] [PMC free article] [PubMed] [Google Scholar]
- 3.Bale TA, Rosenblum MK. The 2021 WHO Classification of Tumors of the Central Nervous System: an update on pediatric low-grade gliomas and glioneuronal tumors. Brain Pathol. 2022;32:e13060. doi: 10.1111/bpa.13060. [DOI] [PMC free article] [PubMed] [Google Scholar]
- 4.Horbinski C, Berger T, Packer RJ, Wen PY. Clinical implications of the 2021 edition of the WHO classification of central nervous system tumours. Nat Rev Neurol. 2022;18:515–529. doi: 10.1038/s41582-022-00679-w. [DOI] [PubMed] [Google Scholar]
- 5.Chen X, Deng R, Su D, Ma X, Han X, Wang S, Xia Y, Yang Z, Gong N, Jia Y, Gao X, Ren X. Visual genetic typing of glioma using proximity-anchored in situ spectral coding amplification. Exploration (Beijing) 2023;3:20220175. doi: 10.1002/EXP.20220175. [DOI] [PMC free article] [PubMed] [Google Scholar]
- 6.Lapointe S, Perry A, Butowski NA. Primary brain tumours in adults. Lancet. 2018;392:432–446. doi: 10.1016/S0140-6736(18)30990-5. [DOI] [PubMed] [Google Scholar]
- 7.Davis ME. Epidemiology and overview of gliomas. Semin Oncol Nurs. 2018;34:420–429. doi: 10.1016/j.soncn.2018.10.001. [DOI] [PubMed] [Google Scholar]
- 8.Haddad AF, Young JS, Oh JY, Okada H, Aghi MK. The immunology of low-grade gliomas. Neurosurg Focus. 2022;52:E2. doi: 10.3171/2021.11.FOCUS21587. [DOI] [PMC free article] [PubMed] [Google Scholar]
- 9.Forst DA, Nahed BV, Loeffler JS, Batchelor TT. Low-grade gliomas. Oncologist. 2014;19:403–413. doi: 10.1634/theoncologist.2013-0345. [DOI] [PMC free article] [PubMed] [Google Scholar]
- 10.Morshed RA, Young JS, Hervey-Jumper SL, Berger MS. The management of low-grade gliomas in adults. J Neurosurg Sci. 2019;63:450–457. doi: 10.23736/S0390-5616.19.04701-5. [DOI] [PubMed] [Google Scholar]
- 11.Louis DN, Perry A, Reifenberger G, von Deimling A, Figarella-Branger D, Cavenee WK, Ohgaki H, Wiestler OD, Kleihues P, Ellison DW. The 2016 World Health Organization Classification of Tumors of the Central Nervous System: a summary. Acta Neuropathol. 2016;131:803–820. doi: 10.1007/s00401-016-1545-1. [DOI] [PubMed] [Google Scholar]
- 12.Reuss DE, Kratz A, Sahm F, Capper D, Schrimpf D, Koelsche C, Hovestadt V, Bewerunge-Hudler M, Jones DT, Schittenhelm J, Mittelbronn M, Rushing E, Simon M, Westphal M, Unterberg A, Platten M, Paulus W, Reifenberger G, Tonn JC, Aldape K, Pfister SM, Korshunov A, Weller M, Herold-Mende C, Wick W, Brandner S, von Deimling A. Adult IDH wild type astrocytomas biologically and clinically resolve into other tumor entities. Acta Neuropathol. 2015;130:407–417. doi: 10.1007/s00401-015-1454-8. [DOI] [PubMed] [Google Scholar]
- 13.Currie E, Schulze A, Zechner R, Walther TC, Farese RV Jr. Cellular fatty acid metabolism and cancer. Cell Metab. 2013;18:153–161. doi: 10.1016/j.cmet.2013.05.017. [DOI] [PMC free article] [PubMed] [Google Scholar]
- 14.Li Z, Zhang H. Reprogramming of glucose, fatty acid and amino acid metabolism for cancer progression. Cell Mol Life Sci. 2016;73:377–392. doi: 10.1007/s00018-015-2070-4. [DOI] [PMC free article] [PubMed] [Google Scholar]
- 15.Koundouros N, Poulogiannis G. Reprogramming of fatty acid metabolism in cancer. Br J Cancer. 2020;122:4–22. doi: 10.1038/s41416-019-0650-z. [DOI] [PMC free article] [PubMed] [Google Scholar]
- 16.Jin Z, Chai YD, Hu S. Fatty acid metabolism and cancer. Adv Exp Med Biol. 2021;1280:231–241. doi: 10.1007/978-3-030-51652-9_16. [DOI] [PubMed] [Google Scholar]
- 17.Rong S, Cortés VA, Rashid S, Anderson NN, McDonald JG, Liang G, Moon YA, Hammer RE, Horton JD. Expression of SREBP-1c requires SREBP-2-mediated generation of a sterol ligand for LXR in livers of mice. Elife. 2017;6:e25015. doi: 10.7554/eLife.25015. [DOI] [PMC free article] [PubMed] [Google Scholar]
- 18.Redman TA, Gibson N, Finn JC, Bremner AP, Valentine J, Thickbroom GW. Upper limb corticomotor projections and physiological changes that occur with botulinum toxin-A therapy in children with hemiplegic cerebral palsy. Eur J Neurol. 2008;15:787–791. doi: 10.1111/j.1468-1331.2008.02194.x. [DOI] [PubMed] [Google Scholar]
- 19.Eberlé D, Hegarty B, Bossard P, Ferré P, Foufelle F. SREBP transcription factors: master regulators of lipid homeostasis. Biochimie. 2004;86:839–848. doi: 10.1016/j.biochi.2004.09.018. [DOI] [PubMed] [Google Scholar]
- 20.Luo Y, Wang H, Liu B, Wei J. Fatty acid metabolism and cancer immunotherapy. Curr Oncol Rep. 2022;24:659–670. doi: 10.1007/s11912-022-01223-1. [DOI] [PubMed] [Google Scholar]
- 21.Maan M, Peters JM, Dutta M, Patterson AD. Lipid metabolism and lipophagy in cancer. Biochem Biophys Res Commun. 2018;504:582–589. doi: 10.1016/j.bbrc.2018.02.097. [DOI] [PMC free article] [PubMed] [Google Scholar]
- 22.Bao JH, Lu WC, Duan H, Ye YQ, Li JB, Liao WT, Li YC, Sun YP. Identification of a novel cuproptosis-related gene signature and integrative analyses in patients with lower-grade gliomas. Front Immunol. 2022;13:933973. doi: 10.3389/fimmu.2022.933973. [DOI] [PMC free article] [PubMed] [Google Scholar]
- 23.Wu F, Li GZ, Liu HJ, Zhao Z, Chai RC, Liu YQ, Jiang HY, Zhai Y, Feng YM, Li RP, Zhang W. Molecular subtyping reveals immune alterations in IDH wild-type lower-grade diffuse glioma. J Pathol. 2020;251:272–283. doi: 10.1002/path.5468. [DOI] [PubMed] [Google Scholar]
- 24.Yang S, Sun B, Li W, Yang H, Li N, Zhang X. Fatty acid metabolism is related to the immune microenvironment changes of gastric cancer and RGS2 is a new tumor biomarker. Front Immunol. 2022;13:1065927. doi: 10.3389/fimmu.2022.1065927. [DOI] [PMC free article] [PubMed] [Google Scholar]
- 25.Xu Y, Chen Y, Jiang W, Yin X, Chen D, Chi Y, Wang Y, Zhang J, Zhang Q, Han Y. Identification of fatty acid metabolism-related molecular subtype biomarkers and their correlation with immune checkpoints in cutaneous melanoma. Front Immunol. 2022;13:967277. doi: 10.3389/fimmu.2022.967277. [DOI] [PMC free article] [PubMed] [Google Scholar]
- 26.Thorsson V, Gibbs DL, Brown SD, Wolf D, Bortone DS, Ou Yang TH, Porta-Pardo E, Gao GF, Plaisier CL, Eddy JA, Ziv E, Culhane AC, Paull EO, Sivakumar IKA, Gentles AJ, Malhotra R, Farshidfar F, Colaprico A, Parker JS, Mose LE, Vo NS, Liu J, Liu Y, Rader J, Dhankani V, Reynolds SM, Bowlby R, Califano A, Cherniack AD, Anastassiou D, Bedognetti D, Mokrab Y, Newman AM, Rao A, Chen K, Krasnitz A, Hu H, Malta TM, Noushmehr H, Pedamallu CS, Bullman S, Ojesina AI, Lamb A, Zhou W, Shen H, Choueiri TK, Weinstein JN, Guinney J, Saltz J, Holt RA, Rabkin CS Cancer Genome Atlas Research Network. Lazar AJ, Serody JS, Demicco EG, Disis ML, Vincent BG, Shmulevich I. The immune landscape of cancer. Immunity. 2018;48:812–830. e814. doi: 10.1016/j.immuni.2018.03.023. [DOI] [PMC free article] [PubMed] [Google Scholar]
- 27.Wang TJC, Mehta MP. Low-grade glioma radiotherapy treatment and trials. Neurosurg Clin N Am. 2019;30:111–118. doi: 10.1016/j.nec.2018.08.008. [DOI] [PubMed] [Google Scholar]
- 28.Kumthekar P, Raizer J, Singh S. Low-grade glioma. Cancer Treat Res. 2015;163:75–87. doi: 10.1007/978-3-319-12048-5_5. [DOI] [PubMed] [Google Scholar]
- 29.Ater JL, Zhou T, Holmes E, Mazewski CM, Booth TN, Freyer DR, Lazarus KH, Packer RJ, Prados M, Sposto R, Vezina G, Wisoff JH, Pollack IF. Randomized study of two chemotherapy regimens for treatment of low-grade glioma in young children: a report from the Children’s Oncology Group. J. Clin. Oncol. 2012;30:2641–2647. doi: 10.1200/JCO.2011.36.6054. [DOI] [PMC free article] [PubMed] [Google Scholar]
- 30.Youssef G, Miller JJ. Lower grade gliomas. Curr Neurol Neurosci Rep. 2020;20:21. doi: 10.1007/s11910-020-01040-8. [DOI] [PMC free article] [PubMed] [Google Scholar]
- 31.Chen Z, Hambardzumyan D. Immune microenvironment in glioblastoma subtypes. Front Immunol. 2018;9:1004. doi: 10.3389/fimmu.2018.01004. [DOI] [PMC free article] [PubMed] [Google Scholar]
- 32.Zhang B, Shen R, Cheng S, Feng L. Immune microenvironments differ in immune characteristics and outcome of glioblastoma multiforme. Cancer Med. 2019;8:2897–2907. doi: 10.1002/cam4.2192. [DOI] [PMC free article] [PubMed] [Google Scholar]
- 33.Qi Y, Chen D, Lu Q, Yao Y, Ji C. Bioinformatic profiling identifies a fatty acid metabolism-related gene risk signature for malignancy, prognosis, and immune phenotype of glioma. Dis Markers. 2019;2019:3917040. doi: 10.1155/2019/3917040. [DOI] [PMC free article] [PubMed] [Google Scholar]
- 34.Quarles LD. FGF23, PHEX, and MEPE regulation of phosphate homeostasis and skeletal mineralization. Am J Physiol Endocrinol Metab. 2003;285:E1–9. doi: 10.1152/ajpendo.00016.2003. [DOI] [PubMed] [Google Scholar]
- 35.Strom TM, Jüppner H. PHEX, FGF23, DMP1 and beyond. Curr Opin Nephrol Hypertens. 2008;17:357–362. doi: 10.1097/MNH.0b013e3282fd6e5b. [DOI] [PubMed] [Google Scholar]
- 36.Rowe PS. The wrickkened pathways of FGF23, MEPE and PHEX. Crit Rev Oral Biol Med. 2004;15:264–281. doi: 10.1177/154411130401500503. [DOI] [PMC free article] [PubMed] [Google Scholar]
- 37.El Hakam C, Parenté A, Baraige F, Magnol L, Forestier L, Di Meo F, Blanquet V. PHEX(L222P) mutation increases phex expression in a new ENU mouse model for XLH disease. Genes (Basel) 2022;13:1356. doi: 10.3390/genes13081356. [DOI] [PMC free article] [PubMed] [Google Scholar]
- 38.Gan YM, Zhang YP, Ruan DD, Huang JB, Zhu YB, Lin XF, Xiao XP, Cheng Q, Geng ZB, Liao LS, Tang FQ, Luo JW. Function of PHEX mutations p.Glu145* and p.Trp749Arg in families with X-linked hypophosphatemic rickets by the negative regulation mechanism on FGF23 promoter transcription. Cell Death Dis. 2022;13:518. doi: 10.1038/s41419-022-04969-5. [DOI] [PMC free article] [PubMed] [Google Scholar]
- 39.Fukumoto S, Yamashita T. Fibroblast growth factor-23 is the phosphaturic factor in tumor-induced osteomalacia and may be phosphatonin. Curr Opin Nephrol Hypertens. 2002;11:385–389. doi: 10.1097/00041552-200207000-00003. [DOI] [PubMed] [Google Scholar]
- 40.Neves RL, Chiarantin GMD, Nascimento FD, Pesquero JB, Nader HB, Tersariol ILS, McKee MD, Carmona AK, Barros NMT. Expression and inactivation of osteopontin-degrading PHEX enzyme in squamous cell carcinoma. Int J Biochem Cell Biol. 2016;77:155–164. doi: 10.1016/j.biocel.2016.05.016. [DOI] [PubMed] [Google Scholar]
- 41.Caumes R, Smol T, Thuillier C, Balerdi M, Lestienne-Roche C, Manouvrier-Hanu S, Ghoumid J. Phenotypic spectrum of SHANK2-related neurodevelopmental disorder. Eur J Med Genet. 2020;63:104072. doi: 10.1016/j.ejmg.2020.104072. [DOI] [PubMed] [Google Scholar]
- 42.Monteiro P, Feng G. SHANK proteins: roles at the synapse and in autism spectrum disorder. Nat Rev Neurosci. 2017;18:147–157. doi: 10.1038/nrn.2016.183. [DOI] [PubMed] [Google Scholar]
- 43.Peykov S, Berkel S, Degenhardt F, Rietschel M, Nöthen MM, Rappold GA. Rare SHANK2 variants in schizophrenia. Mol Psychiatry. 2015;20:1487–1488. doi: 10.1038/mp.2015.122. [DOI] [PMC free article] [PubMed] [Google Scholar]
- 44.Zaslavsky K, Zhang WB, McCready FP, Rodrigues DC, Deneault E, Loo C, Zhao M, Ross PJ, El Hajjar J, Romm A, Thompson T, Piekna A, Wei W, Wang Z, Khattak S, Mufteev M, Pasceri P, Scherer SW, Salter MW, Ellis J. SHANK2 mutations associated with autism spectrum disorder cause hyperconnectivity of human neurons. Nat Neurosci. 2019;22:556–564. doi: 10.1038/s41593-019-0365-8. [DOI] [PMC free article] [PubMed] [Google Scholar]
- 45.Xu L, Li P, Hao X, Lu Y, Liu M, Song W, Shan L, Yu J, Ding H, Chen S, Yang A, Zeng YA, Zhang L, Jiang H. SHANK2 is a frequently amplified oncogene with evolutionarily conserved roles in regulating Hippo signaling. Protein Cell. 2021;12:174–193. doi: 10.1007/s13238-020-00742-6. [DOI] [PMC free article] [PubMed] [Google Scholar]
- 46.Liu Y, Zhang W. The role of HOPX in normal tissues and tumor progression. Biosci Rep. 2020;40:BSR20191953. doi: 10.1042/BSR20191953. [DOI] [PMC free article] [PubMed] [Google Scholar]
- 47.Chen F, Kook H, Milewski R, Gitler AD, Lu MM, Li J, Nazarian R, Schnepp R, Jen K, Biben C, Runke G, Mackay JP, Novotny J, Schwartz RJ, Harvey RP, Mullins MC, Epstein JA. Hop is an unusual homeobox gene that modulates cardiac development. Cell. 2002;110:713–723. doi: 10.1016/s0092-8674(02)00932-7. [DOI] [PubMed] [Google Scholar]
- 48.Asanoma K, Kato H, Inoue T, Matsuda T, Wake N. Analysis of a candidate gene associated with growth suppression of choriocarcinoma and differentiation of trophoblasts. J Reprod Med. 2004;49:617–626. [PubMed] [Google Scholar]
- 49.Kee HJ, Kim JR, Nam KI, Park HY, Shin S, Kim JC, Shimono Y, Takahashi M, Jeong MH, Kim N, Kim KK, Kook H. Enhancer of polycomb1, a novel homeodomain only protein-binding partner, induces skeletal muscle differentiation. J Biol Chem. 2007;282:7700–7709. doi: 10.1074/jbc.M611198200. [DOI] [PubMed] [Google Scholar]
- 50.Vasiliev O, Rhodes SJ, Beebe DC. Identification and expression of Hop, an atypical homeobox gene expressed late in lens fiber cell terminal differentiation. Mol Vis. 2007;13:114–124. [PMC free article] [PubMed] [Google Scholar]
- 51.Katoh H, Yamashita K, Waraya M, Margalit O, Ooki A, Tamaki H, Sakagami H, Kokubo K, Sidransky D, Watanabe M. Epigenetic silencing of HOPX promotes cancer progression in colorectal cancer. Neoplasia. 2012;14:559–571. doi: 10.1593/neo.12330. [DOI] [PMC free article] [PubMed] [Google Scholar]
- 52.Chen Y, Yang L, Cui T, Pacyna-Gengelbach M, Petersen I. HOPX is methylated and exerts tumour-suppressive function through Ras-induced senescence in human lung cancer. J Pathol. 2015;235:397–407. doi: 10.1002/path.4469. [DOI] [PubMed] [Google Scholar]
- 53.Kikuchi M, Katoh H, Waraya M, Tanaka Y, Ishii S, Tanaka T, Nishizawa N, Yokoi K, Minatani N, Ema A, Kosaka Y, Tanino H, Yamashita K, Watanabe M. Epigenetic silencing of HOPX contributes to cancer aggressiveness in breast cancer. Cancer Lett. 2017;384:70–78. doi: 10.1016/j.canlet.2016.10.017. [DOI] [PubMed] [Google Scholar]
- 54.Pavlova O, Lefort K, Mariotto A, Huber M, Hohl D. HOPX exhibits oncogenic activity during squamous skin carcinogenesis. J Invest Dermatol. 2021;141:2354–2368. doi: 10.1016/j.jid.2020.04.034. [DOI] [PubMed] [Google Scholar]
- 55.Ren X, Yang X, Cheng B, Chen X, Zhang T, He Q, Li B, Li Y, Tang X, Wen X, Zhong Q, Kang T, Zeng M, Liu N, Ma J. HOPX hypermethylation promotes metastasis via activating SNAIL transcription in nasopharyngeal carcinoma. Nat Commun. 2017;8:14053. doi: 10.1038/ncomms14053. [DOI] [PMC free article] [PubMed] [Google Scholar]
- 56.Ooki A, Yamashita K, Kikuchi S, Sakuramoto S, Katada N, Kokubo K, Kobayashi H, Kim MS, Sidransky D, Watanabe M. Potential utility of HOP homeobox gene promoter methylation as a marker of tumor aggressiveness in gastric cancer. Oncogene. 2010;29:3263–3275. doi: 10.1038/onc.2010.76. [DOI] [PubMed] [Google Scholar]
- 57.Lin CC, Hsu YC, Li YH, Kuo YY, Hou HA, Lan KH, Chen TC, Tzeng YS, Kuo YY, Kao CJ, Chuang PH, Tseng MH, Chiu YC, Chou WC, Tien HF. Higher HOPX expression is associated with distinct clinical and biological features and predicts poor prognosis in de novo acute myeloid leukemia. Haematologica. 2017;102:1044–1053. doi: 10.3324/haematol.2016.161257. [DOI] [PMC free article] [PubMed] [Google Scholar]
- 58.Wang L, Zhao Y, Wang Y, Wu X. The role of galectins in cervical cancer biology and progression. Biomed Res Int. 2018;2018:2175927. doi: 10.1155/2018/2175927. [DOI] [PMC free article] [PubMed] [Google Scholar]
- 59.Elola MT, Wolfenstein-Todel C, Troncoso MF, Vasta GR, Rabinovich GA. Galectins: matricellular glycan-binding proteins linking cell adhesion, migration, and survival. Cell Mol Life Sci. 2007;64:1679–1700. doi: 10.1007/s00018-007-7044-8. [DOI] [PMC free article] [PubMed] [Google Scholar]
- 60.Rizzolio S, Corso S, Giordano S, Tamagnone L. Autocrine signaling of NRP1 ligand galectin-1 elicits resistance to BRAF-targeted therapy in melanoma cells. Cancers (Basel) 2020;12:2218. doi: 10.3390/cancers12082218. [DOI] [PMC free article] [PubMed] [Google Scholar]
- 61.Zhang PF, Li KS, Shen YH, Gao PT, Dong ZR, Cai JB, Zhang C, Huang XY, Tian MX, Hu ZQ, Gao DM, Fan J, Ke AW, Shi GM. Galectin-1 induces hepatocellular carcinoma EMT and sorafenib resistance by activating FAK/PI3K/AKT signaling. Cell Death Dis. 2016;7:e2201. doi: 10.1038/cddis.2015.324. [DOI] [PMC free article] [PubMed] [Google Scholar]
- 62.Zhu J, Zheng Y, Zhang H, Liu Y, Sun H, Zhang P. Galectin-1 induces metastasis and epithelial-mesenchymal transition (EMT) in human ovarian cancer cells via activation of the MAPK JNK/p38 signalling pathway. Am J Transl Res. 2019;11:3862–3878. [PMC free article] [PubMed] [Google Scholar]
- 63.Astorgues-Xerri L, Riveiro ME, Tijeras-Raballand A, Serova M, Neuzillet C, Albert S, Raymond E, Faivre S. Unraveling galectin-1 as a novel therapeutic target for cancer. Cancer Treat Rev. 2014;40:307–319. doi: 10.1016/j.ctrv.2013.07.007. [DOI] [PubMed] [Google Scholar]
- 64.Vespa GN, Lewis LA, Kozak KR, Moran M, Nguyen JT, Baum LG, Miceli MC. Galectin-1 specifically modulates TCR signals to enhance TCR apoptosis but inhibit IL-2 production and proliferation. J Immunol. 1999;162:799–806. [PubMed] [Google Scholar]
- 65.Rubinstein N, Alvarez M, Zwirner NW, Toscano MA, Ilarregui JM, Bravo A, Mordoh J, Fainboim L, Podhajcer OL, Rabinovich GA. Targeted inhibition of galectin-1 gene expression in tumor cells results in heightened T cell-mediated rejection; A potential mechanism of tumor-immune privilege. Cancer Cell. 2004;5:241–251. doi: 10.1016/s1535-6108(04)00024-8. [DOI] [PubMed] [Google Scholar]
- 66.Chen Q, Han B, Meng X, Duan C, Yang C, Wu Z, Magafurov D, Zhao S, Safin S, Jiang C, Cai J. Immunogenomic analysis reveals LGALS1 contributes to the immune heterogeneity and immunosuppression in glioma. Int J Cancer. 2019;145:517–530. doi: 10.1002/ijc.32102. [DOI] [PubMed] [Google Scholar]
- 67.Faubert B, Solmonson A, DeBerardinis RJ. Metabolic reprogramming and cancer progression. Science. 2020;368:eaaw5473. doi: 10.1126/science.aaw5473. [DOI] [PMC free article] [PubMed] [Google Scholar]
- 68.Tan Y, Li J, Zhao G, Huang KC, Cardenas H, Wang Y, Matei D, Cheng JX. Metabolic reprogramming from glycolysis to fatty acid uptake and beta-oxidation in platinum-resistant cancer cells. Nat Commun. 2022;13:4554. doi: 10.1038/s41467-022-32101-w. [DOI] [PMC free article] [PubMed] [Google Scholar]
Associated Data
This section collects any data citations, data availability statements, or supplementary materials included in this article.


