

Abstract
Cancer is the leading cause of death worldwide. The World Health Organization (WHO) estimates that 10 million fatalities occurred in 2023. Breast cancer (BC) ranked first among malignancies with 2.26 million cases, lung cancer (LC) second with 2.21 million cases, and colon and rectum cancers (CC, CRC) third with 1.93 million cases. These results highlight the importance of investigating novel cancer prognoses and anti-cancer markers. In this study, we investigated the potential effects of alpha-2 macroglobulin and its receptor, LRP1, on the outcomes of breast, lung, and colorectal malignancies. Immunohistochemical staining was used to analyze the expression patterns of A2M and LRP1 in 545 cases of invasive ductal breast carcinoma (IDC) and 51 cases of mastopathies/fibrocystic breast disease (FBD); 256 cases of non-small cell lung carcinomas (NSCLCs) and 45 cases of non-malignant lung tissue (NMLT); and 108 cases of CRC and 25 cases of non-malignant colorectal tissue (NMCT). A2M and LRP1 expression levels were also investigated in breast (MCF-7, BT-474, SK-BR-3, T47D, MDA-MB-231, and MDA-MB-231/BO2), lung (NCI-H1703, NCI-H522, and A549), and colon (LS 180, Caco-2, HT-29, and LoVo) cancer cell lines. Based on our findings, A2M and LRP1 exhibited various expression patterns in the examined malignancies, which were related to one another. Additionally, the stroma of lung and colorectal cancer has increased levels of A2M/LRP1 areas, which explains the significance of the stroma in the development and maintenance of tumor homeostasis. A2M expression was shown to be downregulated in all types of malignancies under study and was positively linked with an increase in cell line aggressiveness. Although more invasive cells had higher levels of A2M expression, an IHC analysis showed the opposite results. This might be because exogenous alpha-2-macroglobulin is present, which has an inhibitory effect on several cancerous enzymes and receptor-dependent signaling pathways. Additionally, siRNA-induced suppression of the transcripts for A2M and LRPP1 revealed their connection, which provides fresh information on the function of the LRP1 receptor in A2M recurrence in cancer. Further studies on different forms of cancer may corroborate the fact that both A2M and LRP1 have high potential as innovative therapeutic agents.
Keywords: Breast cancer, IDC, lung cancer, NSCLC, colorectal cancer, CC, alpha-2-macroglobulin, A2M, low-density lipoprotein receptor-related protein-1, LRP1
Introduction
Cancer is caused by many changes in various genes. All cancers are very different from one another at the molecular level, but some have the same mutations. Most malignancies originate from an accumulation of mutations that result in morphological and phenotypic alterations. These changes in DNA may result from environmental, biological, or chemical factors. Normal cell genes involved in homeostasis that regulate the cell cycle, proliferation, and apoptosis must change for cancer to form. This causes the activation of oncogenes, anti-apoptotic and pro-proliferating genes, and the inhibition of tumor suppressor genes. After eluding the typical cell cycle and evading programmed cell death, cancer cells must overcome the barrier of replicative senescence to achieve immortality. Establishing effective nutrition and oxygen uptake by cancer cells is the last phase of their growth. This step is necessary to support high levels of cellular metabolic and proliferative activity. Scientists from all around the world are working to pinpoint certain key elements and indicators that could serve as a common denominator of cancer development to better understand the molecular mechanisms underlying the genetic modifications responsible for carcinogenesis.
One of the most promising approaches in cancer biology is pan-cancer analysis. The major goal of pan-cancer research is to identify commonly altered genes and the molecular mechanisms that are shared by a variety of cancer forms, regardless of tumorigenesis. As a result, a variety of potent technologies are being utilized alongside more conventional technologies, including next-generation sequencing (NGS); pyrosequencing; and RNA, miRNA, and proteome sequencing. Greater cancer detection and therapy are made possible by greater knowledge of the real nature of cancer mutations and their effects. Therefore, it is crucial to identify novel potential cancer markers.
Tumors are often categorized based on the organ or tissue from which they originate, their specific kind, the WHO grading system, and their dissemination based on the tumor-node-metastasis (TNM) staging system. There are many different types of cancer that can appear anywhere in the body and at practically any age. Hematologic (blood) malignancies and solid tumor cancers are the two main categories of tumors. They all share many characteristics, but their main differences lie in how they develop, proliferate, disseminate, and react to therapy. Although different forms of cancer vary, they differ from those of normal cells. For instance, cancer cells can proliferate even in the absence of signaling molecules (growth factors), avoid signals that would otherwise cause them to stop and undergo apoptosis, invade nearby tissues, start angiogenesis to obtain sufficient nutrients and oxygen, evade the immune system, and coerce immune cells to support their survival in an organism. Therefore, the most desirable cancer indicators have a strong relationship with the characteristics listed above. Targeting markers that are unique to cancer and not to normal cells will result in a greater response to therapy with a lower likelihood of adverse effects in practice. Globally, scientists are working hard to develop treatments that specifically target the aberrant characteristics of tumor cells.
It is estimated that approximately 43% of all cancer-specific genetic aberrations are shared by most cancer types [1-3]. This is a very high number that supports a modern approach that focuses on multiple cancer-associated markers. Modern anti-cancer treatments are based on the origin of the cancer, which sometimes prevents similarities between various types of malignancies. The molecular and clinical significance of multiple cancer-associated markers is still uncertain; therefore, it is important to provide more experimental data on the mutational landscapes of different cancers. Various cancers share the same risk factors, both genetic and environmental for example, mutations in genes such as BRCA1 (Breast Cancer Type 1 Susceptibility Protein), EGFR1 (Epidermal Growth Factor Receptor 1), TP53 (Tumor Protein P53), KRAS (KRAS Proto-Oncogene, GTPase), TERT (Telomerase Reverse Transcriptase), and MYC (Myc Proto-Oncogene) [4-9]. Of the almost 30,000 genes present in the human genome, only a few are associated with cancer progression; however, this number is sufficient for cancer cells to change the hemostasis of the whole body. As mentioned above, many cancer-specific mutations are typical of cancerous cells and not present in healthy cells. Therefore, it is important to define those that are shared by the largest number of cancer types. In this study, we aimed to determine whether alpha-2-macroglobulin (A2M) and its receptor LRP1 (CD91, A2MR) can be considered as multiple cancer-associated markers in breast, lung, and colorectal cancers.
A2M and LRP1 in homeostasis
Alpha-2-macroglobulin (A2M), also known as ovostatin, is a large plasma glycoprotein that acts as a proteinase inhibitor. It was first described in 1946 [10]. In humans, A2M is located on chromosome 12p13.31, which encodes a functional homotetramer (720 kDa) linked to 180 kDa subunits composed of 1474 amino acid residues. A2M belongs to the thioester-containing protein (TEP) family. It undergoes proteolytic processing as part of its role in immune defense mechanisms. All of the members of the TEP family have been classified as belonging to the alpha-2-macroglobulin family, including A2M, PZP (Pregnancy Zone Protein), α1I3, CPAMD8 (C3- and PZP-like alpha-2-macroglobulin domain-containing protein 8), and CD109 (C3- and PZP-like alpha-2-macroglobulin domain-containing protein 7), as well as their C3 subunit structural “lookalikes” C4 and C5 [11-15]. The most recognized and highly conserved motif of A2M forms a hyperactive thioester bond (C-X-E-Q; X for L or G) [16-19].
Although the expression of macroglobulin is strongly linked to liver tissue, it has also been discovered to be released by the reproductive tract, the brain, and the heart [20-23]. The most important functions in maintaining homeostasis are to actively bind and transport cytokines, hormones, apolipoproteins, growth factors, and misfolded proteins to suppress enzyme cascades and the kallikrein-kinin system, regulate blood coagulation processes and fibrinolysis, and initiate inflammatory reactions [22,24]. In blood and cerebral fluid, A2M levels oscillate between 1.5 and 2 mg mL-1 and 1.0 and 3.6 µg mL-1, respectively [17,25]. The presence of A2M in the blood at this concentration is driven by the facilitation of access to all parts of the body. Because of the presence of a bait region containing a large number of proteinase cleavage sites, A2M appears to be a very common protein partner for a wide range of diverse proteases. A2M bait region cleavage results in the covalent deceiving of proteins within a steric half-cage [26]. This mechanism requires conformational changes, resulting in compact tetrameric structure formation and unveiling the binding site for low-density lipoprotein receptor-related protein-1 (LRP1) [12,18,21,27].
LRP1 (CD91) binds to the C-terminal RBD domain region of alpha-2-macroglobulin after induction by peptidases. The low-density lipoprotein receptor-related protein is a 600 kDa membrane-bound receptor and an important member of the LDL receptor family, including the apolipoprotein E receptor 2/LRP8, megalin/LRP2, and the VLDL receptor. It has been proven that all LDL receptors are characterized by the ability to overlap each other’s functions under specific physiological circumstances [28]. CD91 is expressed in various types of cells as a single-chain precursor that, during post-translational maturation, is arranged into a 515 kDa α-chain and an 85 kDa transmembrane β-chain that are covalently bound together [29,30]. The α-chain of CD91 is formed of four clusters of 2, 8, 10, and 11 complement-like repeats (CRs) limited by β-propeller modules and epidermal growth factor-type repeats [31]. It has been proven that A2M binds to LRP1 with a very high affinity, mostly via cluster 2 containing eight CRs, where hydrophobic interactions between RAP and CR complexes are most crucial. The RBD region of macroglobulin exposes lysines K1393 and K1397, revealing a conserved ΨKXΨK motif, where Ψ is hydrophobic and X is an amino acid residue [32]. The dissociation of ligand-receptor complexes is essential for receptor recycling and function. In a neutral pH environment, ligands actively interact with the LRP1 binding site and are then released into the endosomes at pH 6.0.
It has been proven that LRP1 subcellular localization is highly dependent on the presence of lipid rafts. Nevertheless, the receptor can migrate into the clathrin-coated regions of the plasma membrane, where it can be successfully endocytosed [33-35]. Additionally, CD91’s ligands can undergo transcytosis in endothelial cells [36,37]. The first LRP1 ligand is apolipoprotein E [38]. Then, LRP1 was proven to be an effector receptor for activated A2M [39,40]. Diverse proteases, protease inhibitors, viral proteins, and toxins have been identified as CD91 ligands [28]. There is growing evidence for abundant interactions and the role of LRP1 in maintaining homeostasis. It can interact with diverse plasma membrane proteins, such as Plxdc 1/TEM-7, whose functions are associated with angiogenesis, Fe65-promoting APP endocytosis, N-methyl-D-aspartate the PSD-95 co-ligand, and the urokinase receptor uPAR [41-47]. Moreover, CD91 functions are associated with antigen presentation and stimulation of CD8+ T cells, mostly through the mediation of heat shock proteins (HSPs) [48].
Additionally, LRP1 expression levels increase during hypoxia, which is typical for tumor formation. Both alpha-2-macroglobulin and LRP1 are associated with inflammatory processes, not only in the context of injuries, infections, or arteriosclerosis, but also in the context of cancer progression. Therefore, further investigation of their role in tumorigenesis is warranted.
Role of A2M and LRP1 in cancer progression
For decades, proteases have been associated with tumor progression, invasion, and metastasis, mostly because of their ability to degrade the extracellular matrix. Recent studies have demonstrated that proteases are involved in the early stages of cancer initiation and progression, especially in cancer cell growth. Cancer cells show incredible abilities to interact with and influence not only other cancer cells but also stromal cells and the extracellular matrix by controlling protease activity. One of the possibilities for protease control is the use of specific inhibitors. A major proteinase inhibitor in mammals is A2M, which can irreversibly inactivate a wide spectrum of proteins, regardless of their catalytic mechanism and substrate specificity. High plasma levels of A2M are unquestionable; nevertheless, they differ in various types of cancer [49-53].
Unfortunately, there is a small amount of knowledge regarding the expression patterns and role of A2M in cancer progression, limited to prostate and bladder cancers, breast cancer, leukemia, and astrocytoma. Researchers have demonstrated the potential role of A2M in prostate cancer patients, where it can interact with the serine protease prostate-specific antigen (PSA) [54]. In prostate cancer patients, A2M plasma levels can be elevated even above 4.4 µg/mL, simultaneously forming PSA-A2M complexes. Moreover, A2M plasma levels decrease with tumor grade. This could be due to the fact that the overproduction and oversecretion of PSA overwhelm the production of macroglobulin inhibitors by the liver, or even because prostate cancer cells produce factors that affect A2M levels. Additionally, a statistically significant correlation was observed between the increasing levels of A2M and IL-6 (interleukin 6), which can be explained by alpha-2-macroglobulin’s carrier role. Artificially decreasing A2M levels resulted in a decrease in TGF-β1 (transforming growth factor-beta 1) levels and altered cancer cell growth kinetics. PSA-A2M serum activity can be actively suppressed by peptide-based boronic acid inhibitors of PSA [55]. Additionally, it has been proven that A2M binds to prostate cancer cells via direct interaction with immunoglobulin protein GRP78 (Heat Shock 70 kDa Protein 5) and activates the insulin response [56]. A2M acts as a growth factor, increasing the proliferation rate. Therefore, constructing an antibody against GRP78 may be a successful tool in modern therapy for prostate cancer. A2M can not only interact with the LRP1 receptor on T cells but can also be expressed on the B cell surface, although the true nature of this observation requires further investigation.
A2M has been identified as an antigen-causing aggregation of IgG in lymphocytic leukemia. These IgG-antigen aggregates occur on the surface of malignant B cells as well as on free detached complexes.
Analysis of plasma samples from bladder cancer patients revealed that, among other protein markers, A2M levels differed from those observed in the control group. Similar to prostate cancer patients, alpha-2-macroglobulin levels were also significantly increased in our study, which can be used in future clinical practice [57].
It has been proven that AS1-A2M, the antisense A2M, is upregulated in breast cancer patients compared to control samples. AS1-A2M is highly associated with ER-negative breast cancer, resulting in worse progression-free and metastasis-free survival [52,53]. AS1-A2M successfully enhanced breast cancer cell proliferation, migration, and invasion-regulating cell adhesion molecule pathways, such as CD2, CD8A, and selectin L (SELL), which can serve as a potential prognostic marker of BC.
In astrocytomas, the transformation-associated isoform A2M (A2M*) interacts with LRP1 to target cancer cell growth, invasion, and migration. Interestingly, native A2M does not show affinity for LRP1, suggesting that only A2M* has strong tumor-suppressive features [58]. It can also effectively bind to GRP78, resulting in the inhibition of cell proliferation and the creation of an antiapoptotic milieu [59,60]. It has been postulated that the A2M*/LRP1 axis may regulate cancer cell growth by interfering with the Wnt/β-catenin signaling pathway. Overexpression of LRP1 in astrocytoma cells opens a path for A2M* to influence Wnt/β-catenin signaling by relocating β-catenin to the plasma membrane and further upregulating LRP1 and FZD [58]. Moreover, decreased plasma levels of A2M* at higher ages may be linked to carcinogenesis.
Compared to alpha-2-macrogolublin, LRP1’s influence on tumor growth and invasiveness is well acknowledged [61]. This could be caused mainly by the fact that LRP1 can interact not only with A2M but also with various biological ligands, such as viruses, growth factors, lipoproteins, matrix compounds, and proteinase inhibitors. Specific LRP1 membrane-anchored complexes have been shown to be associated with the aggressiveness of various cancer types [62-66]. Interestingly, there is no shortage of opposite observations, where exogenously added LRP1 antagonist RAP resulted in decreased invasiveness of breast cancer cells [67-69]. Moreover, the abolition of LRP1 expression in human thyroid carcinoma leads to increased MMP-2 (Matrix Metallopeptidase 2) and uPA (Urokinase-Type Plasminogen Activator) levels in the extracellular space. LRP1 promotes the mediated endocytic uptake of TIMP-2-free pro-MMP-2 [70-72]. Therefore, silencing LRP1 induces a reduction in tumor cell migration and invasiveness.
Most published data indicate the procancerous abilities of LRP1. For example, an increase in the T allele of C766T in LRP1 is responsible for an increased risk of breast cancer [73]. The same overexpression was observed in high-grade astrocytomas [74]. Increased levels of LRP1 mRNA and protein are observed in the majority of endometrial carcinomas, suggesting its role in endometrial cancer formation [75,76]. Similar to A2M, LRP1 has been shown to regulate MMP-2 and Matrix Metallopeptidase 9 (MMP-9), promoting cell migration and invasion in glioblastoma [77]. Knockdown of LRP1 in the U87 cell line resulted in decreased migration and invasiveness of cancer cells. This could occur via the ERK-dependent signaling pathway [77-79]. Another type of LRP1 involvement in cancer cell physiology is the promotion of cell invasion through ERK (Mitogen-Activated Protein Kinase 1) activation and inhibition of the JNK (Mitogen-Activated Protein Kinase 8) signaling pathway [80]. This could be due to the direct binding of LRP1 to PDGFR-β in endosomes [81,82]. In glioblastoma multiforme, LRP1 forms signaling complexes with eHsp90, regulating the activation of EphA2 receptor tyrosine kinase, thereby simulating cell migration and invasion [83].
In addition to the pro-invasive and pro-proliferative abilities of LRP1, it has also been proven that this LDL receptor is involved in apoptosis. Successful knockdown of LRP1 resulted in a significant decrease in Caspase-3 levels, IR signaling, AKT (AKT Serine/Threonine Kinase 1) phosphorylation, and induction of apoptosis [84]. LRP1 can activate A2M by direct binding, leading to the activation of the AKT signaling pathway in Schwann cells [82]. However, the precise nature of these mechanisms remains unclear.
Current knowledge regarding the role of A2M and the CD91 receptors in cancer progression is still very limited. Therefore, in this study, we demonstrate for the first time the expression patterns and correlations of A2M and LRP1 in breast, lung, and colorectal cancers.
Materials and methods
Patients and clinical samples
The presented experiments were conducted using archival paraffin blocks, as follows:
● Invasive ductal breast carcinomas (n = 545) and fibrocystic breast disease (FBD) (n = 51) were obtained during surgical resection in 2010-2016 at the Polish Mother’s Memorial Hospital Research Institute in Lodz.
● Non-small cell lung carcinomas (n = 256) and non-malignant lung tissue (NMLT) (n = 45) were obtained during surgical resection between 2007 and 2019 at the Lower Silesian Center of Lung Diseases in Wroclaw.
● Colorectal carcinomas (n = 108) and non-cancerous colorectal tissue (NMCT) (n = 25) were obtained from patients treated at the Lower Silesian Oncology Center in Wroclaw, Poland, from 2013 to 2018.
Paraffin sections of the cancerous samples were stained with hematoxylin and eosin (H&E) to verify the appropriateness of the immunohistochemical (IHC) analyses. Clinical data were derived from hospital archives and are summarized in Tables 1, 2 and 3.
Table 1.
Clinicopathological data of the studied cases of invasive ductal breast carcinoma
| Characteristic | No. (%) of patients (n = 495) |
|---|---|
| Tumor size | |
| T1 (<2 cm) | 190 (38.0) |
| T2 (2-5 cm) | 129 (26.0) |
| T3 (>5 cm) | 130 (26.0) |
| T4 | 46 (9.0) |
| Tumor stage - pT | |
| 1 | 313 (63.23) |
| 2 | 152 (30.71) |
| 3 | 19 (3.84) |
| 4 | 11 (2.22) |
| Grading | |
| I | 92 (18.59) |
| II | 312 (63.03) |
| III | 91 (18.38) |
| Nodal status - pN | |
| N0 | 298 (60.20) |
| N1 | 167 (33.74) |
| N2 | 18 (3.64) |
| N3 | 12 (2.42) |
| ER status | |
| Positive | 324 (65.45) |
| Negative | 171 (34.55) |
| PR status | |
| Positive | 312 (63.03) |
| Negative | 183 (36.97) |
| HER2 status | |
| Positive | 311 (62.83) |
| Negative | 184 (37.17) |
| Triple-negative status | |
| Positive | 40 (8.08) |
| Negative | 455 (91.92) |
Table 2.
Clinicopathological data of the studied cases of non-small cell lung colon cancer
| Characteristic | No. (%) of patients (n = 256) |
|---|---|
| Age (years) | |
| Mean | 67 ± 7.64 |
| Range | 45-84 |
| Gender | |
| Male | 150 (59.0) |
| Female | 106 (41.0) |
| Histology | |
| Adenocarcinoma | 116 (45.0) |
| Squamous | 140 (55.0) |
| Tumor size | |
| T1 (<2 cm) | 61 (23.83) |
| T2 (2-5 cm) | 121 (47.27) |
| T3 (>5 cm) | 46 (17.97) |
| T4 | 28 (10.94) |
| Lymph nodes | |
| N0 | 140 (54.69) |
| N1, N2, N3 | 116 (45.31) |
| pTNM | |
| 1A | 42 (16.41) |
| 1B | 49 (19.14) |
| 2A | 30 (11.72) |
| 2B | 29 (11.33) |
| 3A | 37 (14.45) |
| 3B | 42 (16.41) |
| 4 | 27 (10.56) |
| Grade | |
| G1 | 55 (21.48) |
| G2 | 130 (50.78) |
| G3 | 71 (27.73) |
Table 3.
Clinicopathological data of the studied cases of invasive ductal breast carcinoma
| Characteristic | No. (%) of patients (n = 108) |
|---|---|
| Age (years) | |
| Mean | 68.65 ± 10.87 |
| Range | 42-91 |
| Gender | |
| Male | 69 (63.89) |
| Female | 39 (36.11) |
| Location | |
| Proximal colon | 49 (45.37) |
| Distal colon | 59 (54.63) |
| Dukes’ | |
| A | 2 (1.85) |
| B1 | 20 (18.52) |
| B2 | 35 (32.41) |
| C1 | 5 (4.63) |
| C2 | 35 (32.41) |
| C3 | 3 (2.78) |
| D | 8 (7.41) |
| Grade | |
| G1 | 7 (6.48) |
| G2 | 81 (75.00) |
| G3 | 20 (18.52) |
| Treatment | |
| RT | |
| Yes | 64 (59.26) |
| No | 44 (40.74) |
| Adjuvant 5-FU-based chemotherapy | |
| Yes | 73 (67.59) |
| No | 35 (32.41) |
Histopathological analysis of IHC reactions
The immunocytochemical expression of A2M and LRP1 was studied using the ImmunoReactive Score (IRS) according to Remmele and Stenger, which considers both the intensity of the color (staining) of the reaction and the percentage of positively stained cells (Table 4). The final score ranged from 0 to 12. Statistical analysis was performed using the Mann-Whitney U-test, the ANOVA Kruskal-Wallis test, and the Spearman test. Differences were considered statistically significant at P<0.05.
Table 4.
Evaluation of immunohistochemical reactions with the use of the ImmunoReactive Score (IRS)
| % positive cells | Intensity of reaction | IRS |
|---|---|---|
| 0 = no positive cells | 0 = no color reaction | 0-1 = negative |
| 1 ≤10% positive cells | 1 = mild reaction | 2-3 = mild |
| 2 = 10-50% positive cells | 2 = moderate reaction | 4-8 = moderate |
| 3 = 51-80% positive cells | 3 = strong reaction | 9-12 = strong |
| 4 ≥81% positive cells |
Cell lines
For our experiments, the following cell lines were used:
● Breast carcinoma cell lines MCF-7, T-47D, MDA-MB-231 (obtained from American Type Culture Collection ATCC, Manassas, VA, USA), SK-BR-3, BT-474 (from the Cell Lines Collection of the Ludwik Hirszfeld Institute of Immunology and Experimental Therapy of the Polish Academy of Science, Wroclaw, Poland), and MDA-MB-231/BO2 (courtesy of Dr. Philippe Clezardin, INSERM U664, France), as well as immortalized normal breast cells hTERT-HME1 (ME16C) from ATCC. The breast cancer cell lines were cultured in α-MEM medium supplemented with 2 mM L-glutamine (Lonza, Basel, Switzerland), 10% fetal calf serum (FCS; Invitrogen Carlsbad, CA, USA), and antibiotics. The ME16C cell line was cultured in the MEGM Bulletkit medium (Lonza, Basel, Switzerland). All media were supplemented with FBS (Sigma) to a final concentration of 10%. The cell lines were cultured at 37°C in 5% CO2.
● The lung cancer cell lines NCI-H1703, NCI-H522, and A549, together with the normal lung fibroblast cell line IMR-90 (obtained from American Type Culture Collection (ATCC)). The NCI-H1703 and NCI-H522 cell lines were cultured in RPMI-1640 growth medium with the addition of 2 mM L-glutamine. The A549 cell line was cultured in high-glucose DMEM with 2 mM L-glutamine, whereas the IMR-90 fibroblastic cell line was cultured in MEM. All media were supplemented with FBS (Sigma) to a final concentration of 10%. The cell lines were cultured at 37°C in 5% CO2.
● Colorectal cell lines LS 180, Caco-2, HT-29, and LoVo were obtained from the American Type Culture Collection (ATCC). The LS 180 cell line was cultured in Eagle’s Minimum Medium, and CaCo-2 with EMEM (Lonza, Basel, Switzerland) with 1% sodium propionate, 1% non-essential amino acids, and 20% FBS (all from Sigma-Aldrich®, St. Louis, MO, USA). The HT-29 cells were cultured in McCoy’s 5A medium, and the LoVo cells were cultured in F12-K medium. The cell lines were cultured at 37°C and 5% CO2. All the studied cell lines were arranged according to their aggressiveness potential, from the lowest to the highest.
Immunohistochemistry (IHC)
For IHC reactions, we used cancerous and non-cacerous tissue samples fixed in 10% buffered formalin and embedded in paraffin. Immunohistochemical analysis of A2M and LRP1 was performed using mouse monoclonal antibodies against A2M (1:200; 66126-I-Ig; ProteinTech, Rosemont, IL, USA) and LRP1 (SM1729P; OriGene, Rockville, MD, USA). IHC was performed using Autostainer Link 48 (DakoCytomation, Glostrup, Denmark) to provide reliable and repeatable conditions.
RNA extraction, cDNA synthesis, and real-time PCR reactions
Total RNA was extracted using the RNeasy Mini Kit (Qiagen, Hilden, Germany) and transcribed to cDNA using the iScript cDNA Synthesis Kit (Bio-Rad Laboratories, Hercules, CA, USA) according to the manufacturer’s protocol. RT-qPCR was conducted in 20 µL volumes using the iTaq Universal Probes Supermix (Bio-Rad Laboratories, Hercules, CA, USA) on a 7500 real-time PCR system. The TaqMan-specific probes used in the experiment (Hs00929971_m1 for A2M, Hs00233856_m1 for LRP1, and Hs 99999903_m1 for ACTB as a reference gene) were also obtained from Applied Biosystems. All the above-mentioned reactions were performed in triplicate under the following conditions: activation of polymerase at 50°C for 2 min, initial denaturation at 94°C for 10 min followed by 40 cycles of denaturation at 94°C for 15 s, and annealing and elongation at 60°C for 1 min. The relative mRNA expression of the studied markers was calculated using the ΔΔCt method.
SDS-PAGE and Western blotting
The cell lines were lysed on ice in Cell Lysis Buffer (Thermo Fisher Scientific, Waltham, MA, USA) with a cocktail of inhibitors (Sigma, St. Louis, MO, USA), 250 units of Benzonase® (Merck Millipore, Bedford, MA, USA), and 2 mM PMSF (phenylmethanesulfonyl fluoride). Lysates containing 30 µg of total proteins were combined with 4x SDS-PAGE gel-loading buffer (200 mM Tris-HCl, pH 6.8, 400 mM DTT, 8% SDS, 0.4% bromophenol blue, and 40% glycerol), loaded onto 10% acrylamide gels, and separated by SDS-PAGE under reducing conditions before being transferred to PVDF membranes. Following the protein transfer, the membranes were incubated for 1 hour at room temperature in a blocker solution (4% BSA in TBST buffer), followed by an overnight incubation at 4°C with anti-A2M (1:400) and anti-LRP1 (1:500) antibodies. The membranes were then washed with TBST buffer and incubated for 1 h at room temperature with HRP-conjugated anti-rabbit and anti-mouse secondary antibodies, diluted 1:3000 (709-035-149 and 715035-150, respectively; Jackson ImmunoResearch, Mill Valley, CA, USA), then washed and treated with the Immun-Star HRP Chemiluminescence Kit (Bio-Rad). Rabbit anti-human β-actin monoclonal antibody (#4970; Cell Signaling Technology, Danvers, MA, USA), diluted 1:1000, was used as an internal control. Western blot results were analyzed using the ChemiDoc MP system (Bio-Rad).
siRNA transfection
Ambion pre-designed siRNAs (GAPDH siRNA was used as a positive control and scrambled sequence siRNA as a negative control) were used in this study. The siRNAs used were s820 (siRNA1/A2M) and s821 (siRNA2/A2M) for A2M, and 106762 (siRNA1/LRP1) and 106763 (siRNA2/LRP1) for LRP1 (Thermo Fisher Scientific). MCF-7 and A549 cells were cultured in 6-well plates, as previously described. The concentration of siRNA and the amount of transfection reagent were measured experimentally. Before transfection, cells were trypsinized, spun at 1000 rpm for 5 min at 4°C, and resuspended in fresh medium. Ambion’s siPORT NeoFX (4 l/well) lipid-based transfection reagent and siRNAs (50 nM final concentration) were independently diluted in OptiMEM before being combined. Transfection complexes were overlaid with 2 × 10⁵ cells/well after 10 min. Silencing of A2M and LRP1 was confirmed using RT-qPCR and WB.
Immunofluorescence (IF)
For microculture, 600 μL of a 5 × 10⁴ cells/mL suspension of cells was set up on slides with Millicell EZ 8-well glass slides (Merck) and placed in an incubator at 37°C for 24 h. After incubation, cells were fixed with 4% formaldehyde for 12 min at RT and permeabilized using 0.2% Triton X-100 for 10 min. The slices were incubated at 4°C overnight with primary-specific polyclonal mouse anti-A2M (1:400 dilution; ProteinTech) and primary-specific polyclonal rabbit anti-LRP-1 (1:200; Abcam). Next, the preparations were incubated for 1 h with donkey anti-mouse secondary Alexa Fluor 568 conjugated antibodies or donkey anti-rabbit secondary Alexa Fluor 488 conjugated antibodies (1:2000 dilution; Invitrogen, Carlsbad, CA, USA) and mounted using Prolong DAPI Mounting Medium (Invitrogen, United States). Observations were made at objective 40 using a Fluoview FV3000 laser scanning confocal microscope (Olympus) coupled with Cell Sense software (Olympus).
Statistical analysis
The Shapiro-Wilk test was used to evaluate the normality assumption of the groups examined. The Wilcoxon signed-rank test was used to compare the differences between the LSCC and NMLT groups. Additionally, Spearman correlation test was performed to analyze the existing correlations. All statistical analyses were performed using Prism 8.1.0 (GraphPad, La Jolla, CA, USA). The results were considered statistically significant at P<0.05.
Results
Immunohistochemistry
We observed variable expression patterns of both A2M and LRP1 and their corresponding non-cancerous tissues in breast samples (Figure 1A-D), lung (Figure 3A-D) and colorectal cancer (Figure 5A-D). A2M and LRP1 expression levels were observed in cancer and stromal cells. Additionally, we observed the expression of the LRP1 receptor in lung immune cells, most likely in macrophages.
Figure 1.
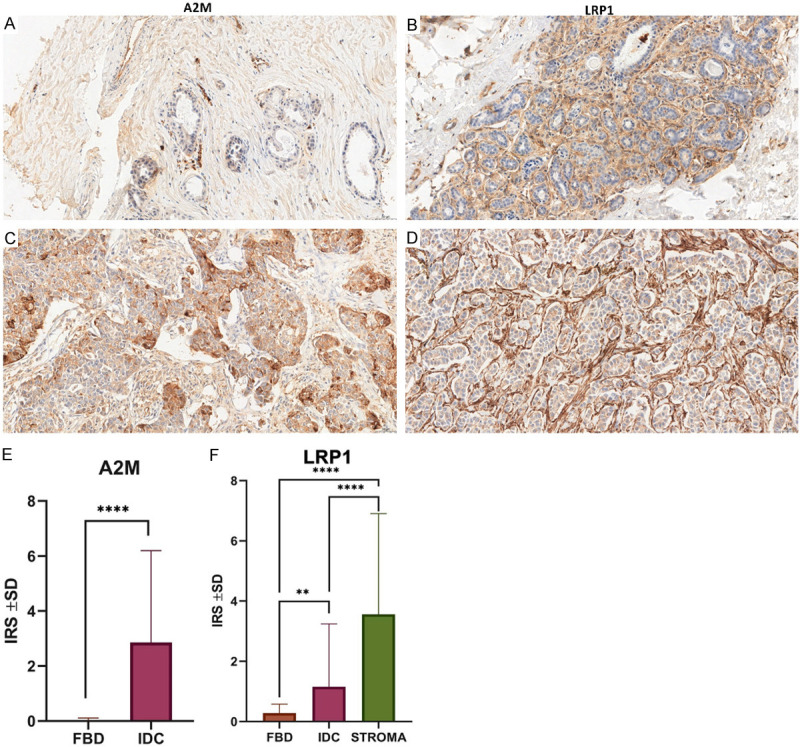
Differentiated expression patterns of A2M and LRP1 in cancer cells and control tissues. Immunohistochemical analysis of A2M and LRP1 in cancer cells of IDC (C, D) compared to corresponding non-malignant tissues (FBD) (A, B). Original magnification: × 400. Statistical analysis of A2M and LRP1 IHC reactions in FBD (n = 51) and IDC (n = 545) cases. A2M’s significantly higher expression level between IDC and FBD samples (P<0.0001, Mann-Whitney test) (E). LRP1’s membranous expression in FBD and IDC with regard to stroma (F). A significantly higher expression was seen in IDC compared to FBD (P = 0.0027, Mann-Whitney test) and in stroma compared to FBD (P<0.0001, Mann-Whitney test) and IDC (P<0.0001, Mann-Whitney test).
Figure 3.
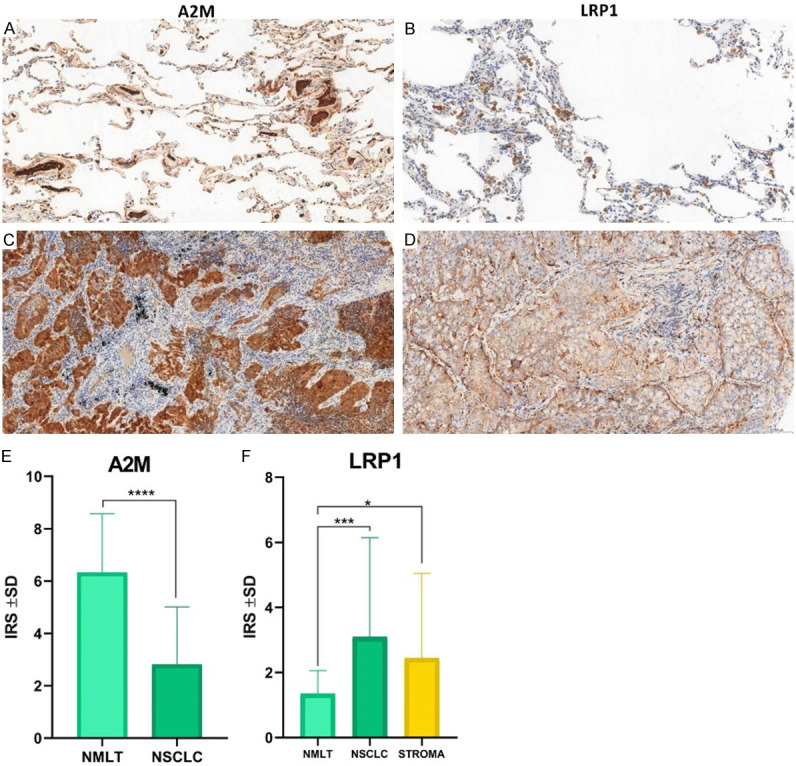
Immunohistochemical analysis of A2M and LRP1 in cancer cells of NSCLC (C, D) compared to corresponding non-malignant lung tissues (NMLT) (A, B). IHC analysis of A2M and LRP1 expression patterns in NMLT (n = 25) and NSCLC (n = 108) cases (E, F). A2M showed significantly higher expression levels in NMLT compared to lung cancer cells (P<0.0001, Mann-Whitney test) (E), while higher LRP1’s membranous expressions were noticed in NSCLC (P = 0.0003, Mann-Whitney test) and stroma (P = 0.0365, Mann-Whitney test) compared to NMLT (F).
Figure 5.
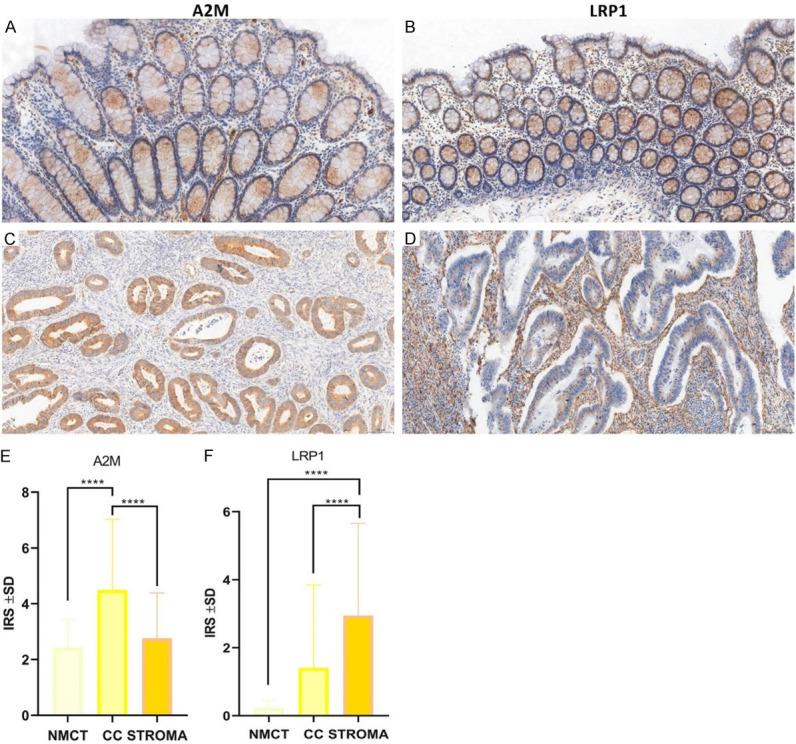
Immunohistochemical analysis of A2M and LRP1 in cancer cells of CC (C, D) compared to corresponding non-malignant colon tissues (NMCT) (A, B). IHC analysis of A2M and LRP1 expression patterns in NMCT (n = 45) and NSCLC (n = 256) cases (E, F). Both A2M and LRP1 expression patterns were significantly higher in CC (P<0.0001, Mann-Whitney test) (E) compared to NMCT, and LRP1 was elevated in stroma compared to CC (P<0.0001, Mann-Whitney test) and NMCT (P<0.0001, Mann-Whitney test) (F).
Breast cancer (IDC)
The clinicopathological features of 545 patients with invasive ductal breast carcinoma were analyzed. A2M and LRP1 expression levels were measured using immunohistochemistry. The correlation between A2M/LRP1 expression levels and the clinicopathological features and prognosis was assessed. Using IHC, we determined the cellular localization and expression levels of A2M and the membranous and stromal expression patterns of LRP1 in 51 cases of FBD and 495 cases of IDC. Cytoplasmic expression of A2M was observed in 415 (76.15%) IDC samples, compared to 5 (9.80%) in the FBD samples. Membranous expression of LRP1 was observed in 198 (36.33%) samples compared to 41 (80.40%) in the FBD samples, and stromal LRP1 expression was observed in 415 (76.15%) IDC samples.
A statistical analysis showed that A2M cytoplasmic expression level was significantly higher in the IDC samples than in the FBD samples (IRS 2.7666 ± 3.2376 vs. 0.02 ± 0.2820, respectively, P<0.0001, Mann-Whitney test) (Figure 1E), and LRP1 expression levels were also significantly higher in both IDC and stromal tissues compared to the FBD samples (IRS 1.1539 ± 2.6456 vs. 3.76686 ± 3.7812 vs. 0.2802 ± 4.4387, respectively, P<0.0001, Mann-Whitney test) (Figure 1F). Moreover, statistically higher expression levels of A2M were observed when comparing the histological grades of IDC (G1 vs. G2, P = 0.0132; G1 vs. G3, P = 0.0003; G2 vs. G3, P = 0.0146; Mann-Whitney test) (Figure 2A). Statistically significant differences in A2M expression levels were observed between TNM stages I and II (P = 0.0029, Mann-Whitney test) (Figure 2B).
Figure 2.
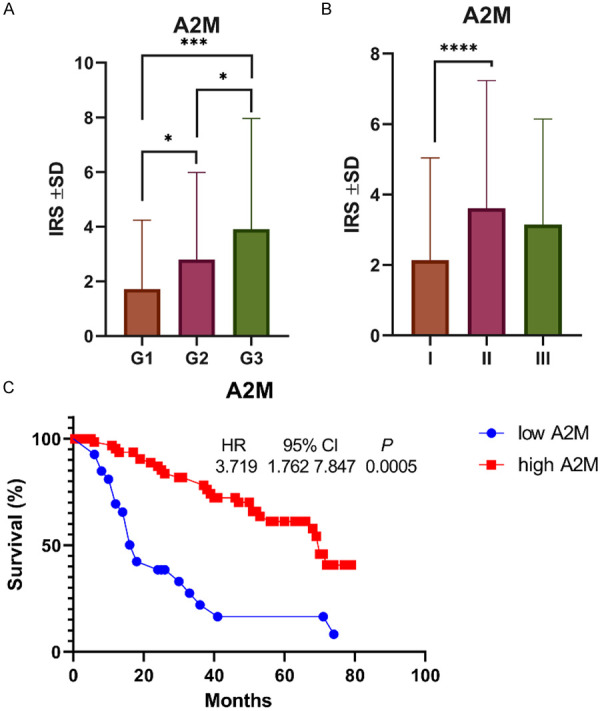
A2M expression in IDC with regard to malignancy grade (A) and TNM staging (B). A significantly higher expression was seen in G2 compared to G1 cases (P = 0.0132, Mann-Whitney test); in G3 compared to G1 (P = 0.0003, Mann-Whitney test) and G2 (P = 0.0146, Mann-Whitney test); and in TNM II compared to TNM I (P = 0.0029, Mann-Whitney test). Survival curve established by data obtained from KM-plot. (C) The survival time of IDC patients with high expression of A2M is higher than that of patients with low expression of A2M (P = 0.0005).
The Spearman correlation test revealed a high positive correlation between A2M and LRP1 membranous expression (r = 0.3425, P<0.0001), A2M and LRP1 stromal expression (r = 0.2131, P<0.0001), and LRP1 membranous and stromal expression (r = 0.2187, P<0.0001). Additionally, a statistical analysis showed a negative correlation between ER and PR status and A2M cytoplasmic expression (A2M vs. ER: r = -0.1541, P<0.0001; A2M vs. PR: r = -0.1686, P<0.0001).
We used Kaplan-Meier to analyze the effect of A2M and LRP1 on the overall survival time of patients with IDC. We observed that higher cytoplasmic A2M expression had a negative impact on the overall survival time compared to the group with lower A2M cytoplasmic expression (P = 0.0005, HR = 0.22, 95% CI = 0.096-0.522) (Figure 2C).
Lung cancer (NSCLC)
The clinicopathological characteristics of 255 patients with NSCLC were examined. In 45 cases of NMLT and 255 cases of NSCLC, we used IHC to identify the cellular localization and expression levels of A2M and the membranous and stromal expression patterns of LRP1. Compared with 45 (100%) NMLT samples, 251 (98.43%) NSCLC samples showed cytoplasmic A2M expression. LRP1 expression was detected in the membranes of 242 (94.90%) NSCLC samples, as opposed to 41 (80.40%) NMLT, and in the stroma of 194 (76.08%) NSCLC samples.
A statistical analysis showed that the A2M cytoplasmic expression level was significantly higher in the NMLT samples than in NSCLC (IRS 6.3314 ± 2.2191 vs. 2.81 ± 2.1950, respectively, P<0.0001, Mann-Whitney test) (Figure 3E), but the LRP1 expression level was significantly higher in the NSCLC cases and the stroma than in NMLT (IRS 3.0942 ± 3.0423 vs. 2.4418 ± 2.5968 vs. 1.3342 ± 0.7164, respectively, P<0.0001, Mann-Whitney test) (Figure 3F).
The Spearman correlation test revealed a high positive correlation between A2M and LRP1 membranous expression (r = 0.4383, P<0.0001), A2M and LRP1 stromal expression (r = 0.3135, P<0.0001), and LRP1 membranous and stromal expression (r = 0.4192, P<0.0001) (Figure 4).
Figure 4.
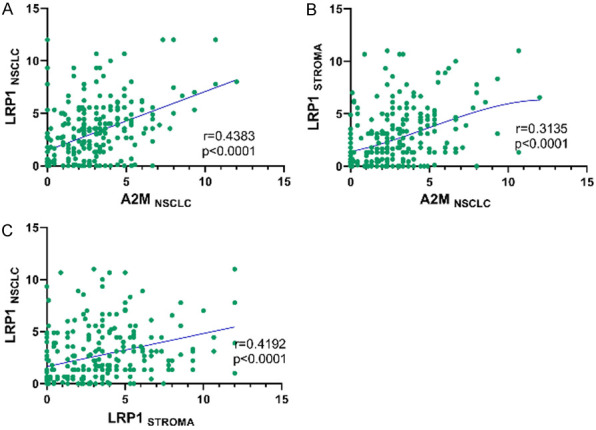
Spearman correlations of (A) A2MNSCLC and LRP1NSCLC (r = 0.4383; P<0.0001); (B) A2MNSCLC and LRP1STROMA (r = 0.3135; P<0.0001); and (C) LRP1STROMA and LRP1NSCLC (r = 0.4192; P<0.0001).
We found no evidence that A2M or LRP1 had any impact on the overall survival time of patients with NSCLC.
Colon cancer (CC)
In 25 cases of NMCT and 108 cases of CC, we used IHC to identify the cellular localization and expression levels of A2M and the membranous and stromal expression patterns of LRP1. A2M was detected in the cytoplasm of 106 (98.15%) CC samples as opposed to 25 (100%) NMCT samples. LRP1 expression was found in the membranes of 49 (45.37%) CC samples as opposed to 20 (80.00%) NMCT samples, as well as in the stroma of 91 (84.26%) CC samples.
A statistical analysis showed that the A2M cytoplasmic expression level was significantly higher in the CC samples than in NMCT (IRS 4.4897 ± 1.8874 vs. 2.4222 ± 0.2177, respectively, P<0.0001, Mann-Whitney test) (Figure 5E), and LRP1 expression levels were also significantly higher in the CC and stroma samples than in the NMCT samples (IRS 1.4022 ± 1.7608 vs. 2.9413 ± 2.2291 vs. 0.2177 ± 0.1895, respectively, P<0.0001, Mann-Whitney test) (Figure 5F).
The Spearman correlation test revealed a high positive correlation between A2M stromal levels and A2M cancer levels (r = 0.3208, P<0.0001) (Figure 6A); A2M and LRP1 cancer cell expression (r = 0.3387, P<0.0001) (Figure 6B); and LRP1 cellular and stromal expression (r = 0.3106, P<0.0001) (Figure 6C).
Figure 6.
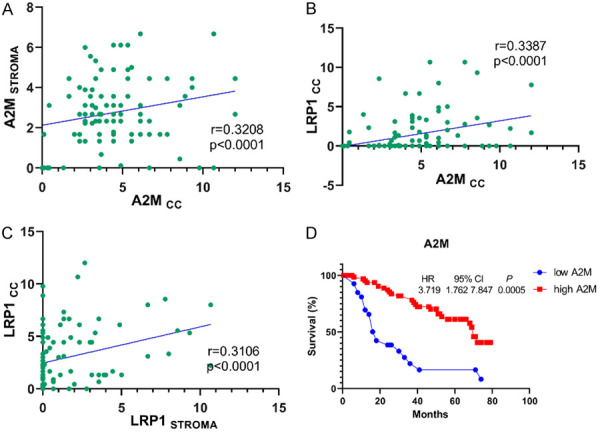
Spearman correlations of (A) A2MCC and A2MSTROMA (r = 0.3208; P<0.0001); (B) A2MCC and LRP1CC (r = 0.3387; P<0.0001); and (C) LRP1STROMA and LRP1CC (r = 0.3106; P<0.0001). (D) The survival time of CC patients with high expression of A2M is higher than that of patients with low expression of A2M (P = 0.0005).
A Kaplan-Meier curve analysis of A2M and LRP1 effects on the overall survival time of IDC patients showed a higher A2M cytoplasmic expression influence on a negative impact on the overall survival time compared to the group with a lower A2M cytoplasmic expression (P = 0.0005, HR = 3.719, 95% CI = 1.762 to 7.847) (Figure 6D).
A2M/LRP1 mRNA and protein expression levels in BC, NSCLC, and CC cell lines-RT-qPCR and WB
A real-time PCR gene expression analysis revealed that all studied breast cancer cell lines, as well as the normal breast cell line ME16C, showed significant A2M and LRP1 gene expression levels. Significantly higher expression levels of A2M were found in the MCF-7 (P<0.0001) and MDA-MB-231/BO2 (P<0.1) cell lines. On the other hand, significantly higher expression levels of LRP1 were observed in the SK-BR-3 (P<0.001), T-47D (P<0.1), and MDA-MB-231/BO2 (P<0.0001) cell lines, whereas lower expression was observed in the BT-474 (P<0.001) and MDA-MB-231 (P<0.0001) cell lines (Figure 7A and 7B). To confirm our RT-qPCR results, we performed a WB analysis of A2M and LRP1 protein expression levels (Figure 7E). Figure 7C shows that the expression levels of A2M were significantly lower in the Me16C cell line compared to the MCF-7 and MDA-MB-231/BO2 cell lines (P<0.0001). Additionally, Figure 7D shows that the expression levels of LRP1 were statistically higher in the Me16C cell line compared to the MCF-7 (P<0.01), SK-BR-3 (P<0.001), T-47D (P<0.01), and MDA-MB-231/BO2 (P<0.001) cell lines.
Figure 7.

Relative expression levels of A2M and LRP1 in breast cancer cell lines (A, B), lung cancer cell lines (F, G), and colorectal cancer cell lines (K, L). Data are the mean ± SD of triplicate determinants. Western blot analysis of A2M and LRP1 in breast cancer cell lines (C, D), lung cancer cell lines (H, I), and colorectal cancer cell lines (M, N). As an internal control, a β-actin protein was used (E, J, O). Data show the average standard deviation of three independent experiments. *P<0.1; **P<0.01; ***P<0.001; ****P<0.0001.
In contrast to breast cancer cell lines, lung cancer cells showed a statistically significant decrease in A2M and LRP1 mRNA levels in all studied cell lines. Compared to the reference IMR-90 cell line, A2M and LRP1 reductions in the NCI-H1703 (P<0.0001, P<0.0001), NCI-H522 (P<0.0001, P<0.001), and A549 (P<0.0001, P<0.001) cell lines were observed (Figure 7F and 7G). A WB analysis confirmed gene expression, showing that a statistical decrease in A2M protein could be seen in the NCI-H1703 (P<0.0001), NCI-H522 (P<0.0001), and A549 (P<0.0001) cell lines when compared to the lung fibroblast cell line IMR-90 (Figure 7H, 7J). Furthermore, compared to IMR-90 (Figure 7I), LRP1 was also shown to be decreased in NCI-H1703 (P<0.001) and A549 (P<0.001) cells.
Additionally, there was significant variation in the expression levels of both A2M and LRP1 mRNAs among all studied CC cell lines. Compared to the LS180 cell line, the least aggressive of all the CC cell lines used in the experiments, both Caco-2 (P<0.001) and HT-29 (P<0.1) cells showed statistically significant increases in A2M expression. LRP1 levels were significantly decreased in the Caco-2 (P<0.1) and LoVo (P<0.001) cell lines compared to LS180 cells (Figure 7K and 7L). As shown in Figure 7M and 7O, Western blot showed that the Caco-2 (P<0.0001), HT-29 (P<0.001), and LoVo (P<0.001) cell lines had statistically higher levels of A2M than LS180 cells. In addition, Figure 7N indicates that LRP1 significantly increased protein levels in HT-29 (P<0.01) and decreased them in Caco-2 (P<0.0001) and LoVo (P<0.1) in comparison to LS180 cells.
siRNA silencing of A2M and LRP1 genes in breast and lung cancer cell lines
To evaluate the effect of siRNA-mediated silencing of A2M and LRP1 mRNAs, specific siRNAs were transfected into the MCF-7 breast cancer and A549 lung cancer cell lines for 24 and 48 h. The analysis includes both negative and positive controls, as illustrated in Figure 8K. Transfection efficiency was measured by RT-qPCR and WB. As shown in Figure 8, we observed statistically significant downregulation of all silenced genes over the 24- and 48-hour periods.
Figure 8.

Relative levels of A2M and LRP1 mRNAs in MCF-7 IDC cell line and A549 NSCLC cell line transfected with siRNAs against A2M and LRP1. Cells were transfected with the siRNAs for A2M and LRP1 and incubated for 24 h and 48 h. Relative expression levels (RQs) of A2M in MCF-7 (A) and A549 (F) cells, and LRP1 mRNA after silencing in MCF-7 (B) and A549 (G) cells. (C and H) show protein expression analysis of A2M, whereas (D and I) show the analysis of LRP1 in MCF-7 and A549 cell lines. Western blot analysis measured the effects of siRNA-mediated knockdown of A2M and LRP1 in MCF-7 (E) and A549 (J) cell lines. GAPDH was used as an internal control (K). Data represent the mean and standard deviation of three independent experiments. Comparisons between groups were done using Student’s t-test: *P<0.1; **P<0.01; ***P<0.001; ****P<0.0001.
The downregulation of LRP1 in the MCF-7 and A549 (Figure 7) cell lines resulted in a statistically significant increase in A2M levels (in both gene and protein) in the MCF-7 cell line after 48 h (P<0.0001) and in the A549 cell line after 24 h (P<0.0001) and 48 h (P<0.0001) (Figure 8B, 8D and 8E). It is interesting to note that both siRNA molecules (Figure 8A and 8C) increased A2M mRNA and protein levels (P<0.0001) in the MCF-7 cell line after 48 hours of LRP1 silencing. A similar pattern was noticed in the A549 cell line after 24 h (P<0.0001) and 48 h (P<0.0001) of LRP1 silencing (Figure 8F, 8J). This may have happened because cancer cells responded to adverse downregulation of the LRP1 transcript. The knockdown of A2M revealed that A549 lung cancer cells responded by increasing LRP1 mRNA levels after 24 h (P<0.0001) and protein levels after 24 h (P<0.0001) and 48 h (P<0.0001) (Figure 8G and 8I).
Similar to RT-qPCR and WB expression analysis, siRNA mixtures for A2M and LRP1 were mixed with a transfection agent, incubated with the MCF-7 and A549 cell lines for 48 h, and stained for confocal microscopy analysis to evaluate the transfection efficiency. The results showed that the red fluorescence signal representing the A2M protein decreased after successful inhibition, both in the MCF-7 and A549 cell lines, and the level of LRP1 increased owing to the negative regulation of A2M. There was no evidence of LRP1 downregulation in the studied cell lines after 48 hours (Figures 9, 10). Despite this, the results were in accordance with those obtained from RT-qPCR, indicating an increase in LRP1 expression levels.
Figure 9.
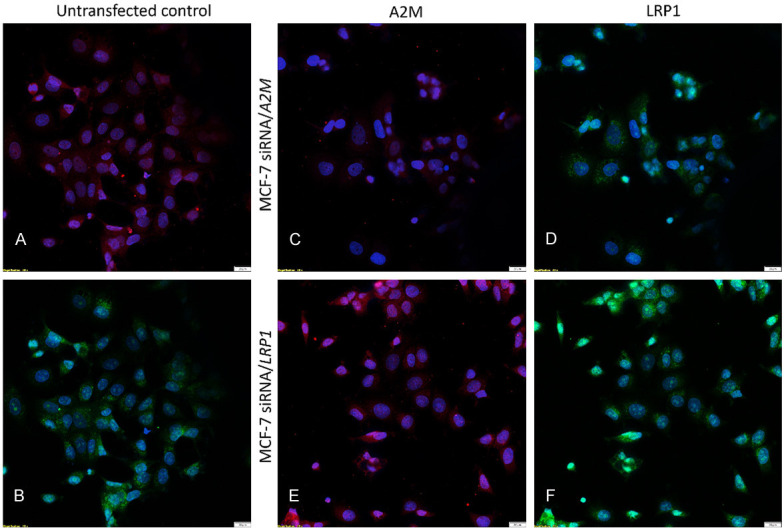
Inhibition of gene expression using siRNA transfection. Immunofluorescence staining of A2M and LRP1 proteins in human breast cancer cell line MCF-7 post-transfection. Protein reduction was sustained 48 h post-siRNA transfection. A2M was immunostained red, LRP1 was immunostained green, and nuclei were stained with DAPI (blue). Untransfected control labeled with A2M (A) and LRP1 (B) antibodies. MCF-7 siRNA/A2M cell line stained with A2M (C) and LRP1 (D). MCF-7 siRNA/LRP1 cell line stained with A2M (E) and LRP1 (F).
Figure 10.
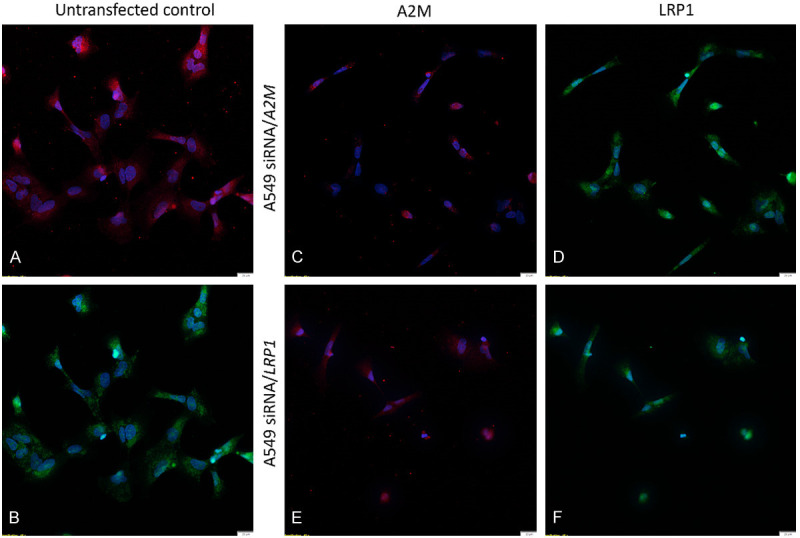
Inhibition of gene expression using siRNA transfection. Immunofluorescence staining of A2M and LRP1 proteins in human lung cancer cell line A549 post-transfection. Protein reduction was sustained 48 h post-siRNA transfection. A2M was immunostained red, LRP1 was immunostained green, and nuclei were stained with DAPI (blue). Untransfected control labeled with A2M (A) and LRP1 (B) antibodies. A549 siRNA/A2M cell line stained with A2M (C) and LRP1 (D). A549 siRNA/LRP1 cell line stained with A2M (E) and LRP1 (F).
Discussion
A2M, a 750 kDa molecule that acts as a strong protease inhibitor, is detected in serum and is mostly produced by the liver. This inhibitor can enter cells and bind to numerous cytokines, such as transforming tumor necrosis factor-alpha (TNF-α), growth factor-beta 1 (TGF-β1), TGF-β2, platelet-derived growth factor-BB, nerve growth factor-beta, and basic fibroblast growth factor, and act on all classes of endoproteases. Because of its capabilities, the level of A2M in human blood declines with age, which is increasingly linked to aging processes that increase the risk of cancer. By attaching to its receptor, low-density lipoprotein receptor-related protein 1 (LRP1, also known as CD91), the fast clearance of tethered peptides and proteins is mediated. G protein-activated pathways are initiated when A2M binds to the A2M receptor, LRP. For instance, the activation of A2M by methylamine induces macrophages to increase cellular and nuclear COX-2 (Cyclooxygenase-2) when it binds to LRP receptors [85]. A2M undergoes a significant conformational change upon binding proteinases, which causes the expression of previously unnoticed receptor-binding sites on its surface. Consequently, the so-called “transformed A2M” (A2M*) binds to the LRP1 receptor. Ligation of LRP1 causes A2M-proteinase complexes to be rapidly cleared from the blood and tissues through receptor-mediated mechanisms. Nevertheless, A2M’s precise role in the proliferation and metabolism of cancer cells has not yet been fully elucidated. It has been demonstrated that A2M levels in the blood and liver of long-living, cancer-resistant naked mole-rats are noticeably greater than those of humans and mice [86]. This may significantly contribute to the increased longevity and resistance to cancer in these animals and may also explain how progressive A2M deficiency may promote tumor growth, especially since most tumors grow slowly over 15 years [2-5]. We firmly believe that A2M plays an underestimated but crucial role in cancer biology because of its capacity to function as a signaling molecule, growth factor transporter, and modulator of protease activity.
It has been demonstrated that reducing A2M levels through exogenous protease injection can reduce TGF-β levels and alter the kinetics of tumor growth [87]. According to these findings, elevated blood levels of the PSA-A2M complex in patients with prostate cancer may change the concentrations of vital growth and survival variables that could influence prostate cancer progression. Changes in these protein levels may also affect certain signs and symptoms of advanced or terminal prostate cancer, including increased discomfort, cachexia, and exhaustion [54]. Reduced levels of total A2M and higher concentrations of PSA bound to A2M have the potential to interfere with blood protease clearance and inactivation, which may result in abnormalities in the complement and clotting-system protease cascades.
Our research on three different types of human cancers revealed that the expression of A2M and its binding receptor, LRP1, varies among cancer cells. Breast cancer cells show a decreasing trend in A2M expression, which is correlated with cancer cell aggressiveness. Similarly, the expression levels of A2M are much lower in lung cancer cells than in lung fibroblasts. Unfortunately, we did not examine serum levels of A2M, which would have greatly enhanced the findings of this study and brought us closer to understanding the role of A2M in the development of cancer. LRP1 levels are considerably lower in tumorous lung tissue than in non-malignant lung tissue. In a study group of 256 patients, lower LRP1 expression in lung adenocarcinoma was associated with a worse clinical prognosis.
It is noteworthy that A2M expression levels are higher in the tissues of CC patients, similar to those of IDC patients, compared to the corresponding non-malignant tissues. This finding contrasts with an analysis that linked a higher expression of A2M in cancerous tissue with a longer survival time for patients with IDC and CC. These findings demonstrate the extremely nuanced functions of A2M and its receptor, LRP1, in the development of cancer. An analysis of the relationships between A2M and LRP1 in breast, lung, and colorectal malignancies clearly showed that A2M should be regarded as a pan-endoprotease inhibitor implicated in a broad range of biological and physiological processes.
Moreover, the results of the siRNA knockdown experiments revealed that successful inhibition of LRP1 elevated A2M mRNA and protein levels. This may indicate that direct interactions between A2M and LRP1 receptors may be crucial in cancer physiology. Although the exact mechanism by which this finding was made is unknown, we hypothesized that it may have been caused by changes in the LRP1/A2M complex’s binding capacities and, therefore, changes in the endocytosis process. Nevertheless, further investigations are required to fully understand this mechanism.
A2M has a significant impact on aging and cancer development. A2M blood levels in humans are adversely associated with aging, falling from 4 mg/mL at birth to 1.5 mg/mL in the elderly [88]. Thus, its role in maintaining blood homeostasis and preventing diseases associated with aging is clinically important. In conclusion, our findings provide further evidence that A2M and LRP1 play a role in cancer development. It is crucial to investigate A2M’s role and potential binding partners and receptors that may be involved in carcinogenesis because, in human blood and tissues, it can bind and inhibit the activities of most proteinases, as well as numerous growth factors, hormones, and cytokines.
Conclusions
Our findings support the relevance of A2M and its receptor, LRP1 (CD91), in cancer development and tumor-stroma communication, which leads to the control of cancer growth, cancer cell death, and the anti-inflammatory cytokine signaling response. Our findings emphasize the diagnostic utility of A2M and LRP1 in patients with BC, NSCLC, and CC. Nonetheless, further research is needed to determine the precise mechanisms of the direct interaction between A2M and LRP1 that underlies the pathophysiology of human malignancies. Restoring A2M homeostasis in the tumor to that found in healthy tissues may impair the ability of the tumor to evade immune control. Confirmation of A2M’s significance in cancer treatment may contribute to the development of novel anti-cancer treatments based on A2M.
Acknowledgements
The authors would like to thank Agnieszka Baranska, Elzbieta Polejko, and Bozena Przygodzka for their technical support in the preparation of the histological slides. We would like to express our sincere gratitude to Francisco Jose Vare Alvarez for his exceptional editorial work. This research was funded by the Wroclaw Medical University, ID No. SUB.A350.21.052.
Disclosure of conflict of interest
None.
References
- 1.Heim D, Budczies J, Stenzinger A, Treue D, Hufnagl P, Denkert C, Dietel M, Klauschen F. Cancer beyond organ and tissue specificity: next-generation-sequencing gene mutation data reveal complex genetic similarities across major cancers. Int J Cancer. 2014;135:2362–2369. doi: 10.1002/ijc.28882. [DOI] [PubMed] [Google Scholar]
- 2.Newton Y, Novak AM, Swatloski T, McColl DC, Chopra S, Graim K, Weinstein AS, Baertsch R, Salama SR, Ellrott K, Chopra M, Goldstein TC, Haussler D, Morozova O, Stuart JM. TumorMap: exploring the molecular similarities of cancer samples in an interactive portal. Cancer Res. 2017;77:e111–e114. doi: 10.1158/0008-5472.CAN-17-0580. [DOI] [PMC free article] [PubMed] [Google Scholar]
- 3.Yang X, Sun X. Meta-analysis of several gene lists for distinct types of cancer: a simple way to reveal common prognostic markers. BMC Bioinformatics. 2007;8:118. doi: 10.1186/1471-2105-8-118. [DOI] [PMC free article] [PubMed] [Google Scholar]
- 4.Lu Y, Yi Y, Liu P, Wen W, James M, Wang D, You M. Common human cancer genes discovered by integrated gene-expression analysis. PLoS One. 2007;2:e1149. doi: 10.1371/journal.pone.0001149. [DOI] [PMC free article] [PubMed] [Google Scholar]
- 5.Repana D, Nulsen J, Dressler L, Bortolomeazzi M, Venkata SK, Tourna A, Yakovleva A, Palmieri T, Ciccarelli FD. The Network of Cancer Genes (NCG): a comprehensive catalogue of known and candidate cancer genes from cancer sequencing screens. Genome Biol. 2019;20:1. doi: 10.1186/s13059-018-1612-0. [DOI] [PMC free article] [PubMed] [Google Scholar]
- 6.An O, Dall’Olio GM, Mourikis TP, Ciccarelli FD. NCG 5.0: updates of a manually curated repository of cancer genes and associated properties from cancer mutational screenings. Nucleic Acids Res. 2016;44:D992–999. doi: 10.1093/nar/gkv1123. [DOI] [PMC free article] [PubMed] [Google Scholar]
- 7.Schaefer MH, Serrano L. Cell type-specific properties and environment shape tissue specificity of cancer genes. Sci Rep. 2016;6:20707. doi: 10.1038/srep20707. [DOI] [PMC free article] [PubMed] [Google Scholar]
- 8.Iranzo J, Martincorena I, Koonin EV. Cancer-mutation network and the number and specificity of driver mutations. Proc Natl Acad Sci U S A. 2018;115:E6010–E6019. doi: 10.1073/pnas.1803155115. [DOI] [PMC free article] [PubMed] [Google Scholar]
- 9.Lawrence MS, Stojanov P, Mermel CH, Robinson JT, Garraway LA, Golub TR, Meyerson M, Gabriel SB, Lander ES, Getz G. Discovery and saturation analysis of cancer genes across 21 tumour types. Nature. 2014;505:495–501. doi: 10.1038/nature12912. [DOI] [PMC free article] [PubMed] [Google Scholar]
- 10.Cohn EJ, Strong LE, et al. Preparation and properties of serum and plasma proteins; a system for the separation into fractions of the protein and lipoprotein components of biological tissues and fluids. J Am Chem Soc. 1946;68:459–475. doi: 10.1021/ja01207a034. [DOI] [PubMed] [Google Scholar]
- 11.Sand O, Folkersen J, Westergaard JG, Sottrup-Jensen L. Characterization of human pregnancy zone protein. Comparison with human alpha 2-macroglobulin. J Biol Chem. 1985;260:15723–15735. [PubMed] [Google Scholar]
- 12.Kristensen T, Moestrup SK, Gliemann J, Bendtsen L, Sand O, Sottrup-Jensen L. Evidence that the newly cloned low-density-lipoprotein receptor related protein (LRP) is the alpha 2-macroglobulin receptor. FEBS Lett. 1990;276:151–155. doi: 10.1016/0014-5793(90)80530-v. [DOI] [PubMed] [Google Scholar]
- 13.Sekiguchi R, Fujito NT, Nonaka M. Evolution of the thioester-containing proteins (TEPs) of the arthropoda, revealed by molecular cloning of TEP genes from a spider, Hasarius adansoni. Dev Comp Immunol. 2012;36:483–489. doi: 10.1016/j.dci.2011.05.003. [DOI] [PubMed] [Google Scholar]
- 14.Fujito NT, Sugimoto S, Nonaka M. Evolution of thioester-containing proteins revealed by cloning and characterization of their genes from a cnidarian sea anemone, Haliplanella lineate. Dev Comp Immunol. 2010;34:775–784. doi: 10.1016/j.dci.2010.02.011. [DOI] [PubMed] [Google Scholar]
- 15.Baxter RH, Chang CI, Chelliah Y, Blandin S, Levashina EA, Deisenhofer J. Structural basis for conserved complement factor-like function in the antimalarial protein TEP1. Proc Natl Acad Sci U S A. 2007;104:11615–11620. doi: 10.1073/pnas.0704967104. [DOI] [PMC free article] [PubMed] [Google Scholar]
- 16.Sottrup-Jensen L, Stepanik TM, Kristensen T, Lonblad PB, Jones CM, Wierzbicki DM, Magnusson S, Domdey H, Wetsel RA, Lundwall A, et al. Common evolutionary origin of alpha 2-macroglobulin and complement components C3 and C4. Proc Natl Acad Sci U S A. 1985;82:9–13. doi: 10.1073/pnas.82.1.9. [DOI] [PMC free article] [PubMed] [Google Scholar]
- 17.Sottrup-Jensen L. Alpha-macroglobulins: structure, shape, and mechanism of proteinase complex formation. J Biol Chem. 1989;264:11539–11542. [PubMed] [Google Scholar]
- 18.Moestrup SK, Kaltoft K, Sottrup-Jensen L, Gliemann J. The human alpha 2-macroglobulin receptor contains high affinity calcium binding sites important for receptor conformation and ligand recognition. J Biol Chem. 1990;265:12623–12628. [PubMed] [Google Scholar]
- 19.Gliemann J, Davidsen O, Sottrup-Jensen L, Sonne O. Uptake of rat and human alpha 2-macroglobulin-trypsin complexes into rat and human cells. FEBS Lett. 1985;188:352–356. doi: 10.1016/0014-5793(85)80401-4. [DOI] [PubMed] [Google Scholar]
- 20.Tayade C, Esadeg S, Fang Y, Croy BA. Functions of alpha 2 macroglobulins in pregnancy. Mol Cell Endocrinol. 2005;245:60–66. doi: 10.1016/j.mce.2005.10.004. [DOI] [PubMed] [Google Scholar]
- 21.Komissarov AA, Florova G, Azghani A, Karandashova S, Kurdowska AK, Idell S. Active alpha-macroglobulin is a reservoir for urokinase after fibrinolytic therapy in rabbits with tetracycline-induced pleural injury and in human pleural fluids. Am J Physiol Lung Cell Mol Physiol. 2013;305:L682–692. doi: 10.1152/ajplung.00102.2013. [DOI] [PMC free article] [PubMed] [Google Scholar]
- 22.Chuang WH, Lee KK, Liu PC. Characterization of alpha-2-macroglobulin from groupers. Fish Shellfish Immunol. 2013;35:389–398. doi: 10.1016/j.fsi.2013.04.050. [DOI] [PubMed] [Google Scholar]
- 23.Ali SS, Zia MK, Siddiqui T, Ahsan H, Khan FH. Bilirubin binding affects the structure and function of alpha-2-macroglobulin. J Immunoassay Immunochem. 2020;41:841–851. doi: 10.1080/15321819.2020.1783290. [DOI] [PubMed] [Google Scholar]
- 24.Rehman AA, Ahsan H, Khan FH. alpha-2-Macroglobulin: a physiological guardian. J Cell Physiol. 2013;228:1665–1675. doi: 10.1002/jcp.24266. [DOI] [PubMed] [Google Scholar]
- 25.Garton MJ, Keir G, Lakshmi MV, Thompson EJ. Age-related changes in cerebrospinal fluid protein concentrations. J Neurol Sci. 1991;104:74–80. doi: 10.1016/0022-510x(91)90218-v. [DOI] [PubMed] [Google Scholar]
- 26.Barrett AJ, Starkey PM. The interaction of alpha 2-macroglobulin with proteinases. Characteristics and specificity of the reaction, and a hypothesis concerning its molecular mechanism. Biochem J. 1973;133:709–724. doi: 10.1042/bj1330709. [DOI] [PMC free article] [PubMed] [Google Scholar]
- 27.Ashcom JD, Tiller SE, Dickerson K, Cravens JL, Argraves WS, Strickland DK. The human alpha 2-macroglobulin receptor: identification of a 420-kD cell surface glycoprotein specific for the activated conformation of alpha 2-macroglobulin. J Cell Biol. 1990;110:1041–1048. doi: 10.1083/jcb.110.4.1041. [DOI] [PMC free article] [PubMed] [Google Scholar]
- 28.Strickland DK, Gonias SL, Argraves WS. Diverse roles for the LDL receptor family. Trends Endocrinol Metab. 2002;13:66–74. doi: 10.1016/s1043-2760(01)00526-4. [DOI] [PubMed] [Google Scholar]
- 29.Lillis AP, Van Duyn LB, Murphy-Ullrich JE, Strickland DK. LDL receptor-related protein 1: unique tissue-specific functions revealed by selective gene knockout studies. Physiol Rev. 2008;88:887–918. doi: 10.1152/physrev.00033.2007. [DOI] [PMC free article] [PubMed] [Google Scholar]
- 30.Lillis AP, Greenlee MC, Mikhailenko I, Pizzo SV, Tenner AJ, Strickland DK, Bohlson SS. Murine low-density lipoprotein receptor-related protein 1 (LRP) is required for phagocytosis of targets bearing LRP ligands but is not required for C1q-triggered enhancement of phagocytosis. J Immunol. 2008;181:364–373. doi: 10.4049/jimmunol.181.1.364. [DOI] [PMC free article] [PubMed] [Google Scholar]
- 31.Lebbink JH, Bertoldo C, Tibbelin G, Andersen JT, Duffner F, Antranikian G, Ladenstein R. Crystallization and preliminary X-ray crystallographic studies of the thermoactive pullulanase type I, hydrolyzing alpha-1,6 glycosidic linkages, from Fervidobacterium pennivorans Ven5. Acta Crystallogr D Biol Crystallogr. 2000;56:1470–1472. doi: 10.1107/s090744490001074x. [DOI] [PubMed] [Google Scholar]
- 32.Jensen GA, Andersen OM, Bonvin AM, Bjerrum-Bohr I, Etzerodt M, Thogersen HC, O’Shea C, Poulsen FM, Kragelund BB. Binding site structure of one LRP-RAP complex: implications for a common ligand-receptor binding motif. J Mol Biol. 2006;362:700–716. doi: 10.1016/j.jmb.2006.07.013. [DOI] [PubMed] [Google Scholar]
- 33.Wu L, Gonias SL. The low-density lipoprotein receptor-related protein-1 associates transiently with lipid rafts. J Cell Biochem. 2005;96:1021–1033. doi: 10.1002/jcb.20596. [DOI] [PubMed] [Google Scholar]
- 34.Van Leuven F, Cassiman JJ, Van Den Berghe H. Primary amines inhibit recycling of alpha 2M receptors in fibroblasts. Cell. 1980;20:37–43. doi: 10.1016/0092-8674(80)90232-9. [DOI] [PubMed] [Google Scholar]
- 35.Herz J, Kowal RC, Ho YK, Brown MS, Goldstein JL. Low density lipoprotein receptor-related protein mediates endocytosis of monoclonal antibodies in cultured cells and rabbit liver. J Biol Chem. 1990;265:21355–21362. [PubMed] [Google Scholar]
- 36.Benchenane K, Berezowski V, Fernandez-Monreal M, Brillault J, Valable S, Dehouck MP, Cecchelli R, Vivien D, Touzani O, Ali C. Oxygen glucose deprivation switches the transport of tPA across the blood-brain barrier from an LRP-dependent to an increased LRP-independent process. Stroke. 2005;36:1065–1070. doi: 10.1161/01.STR.0000163050.39122.4f. [DOI] [PubMed] [Google Scholar]
- 37.Pan W, Kastin AJ, Zankel TC, van Kerkhof P, Terasaki T, Bu G. Efficient transfer of receptor-associated protein (RAP) across the blood-brain barrier. J Cell Sci. 2004;117:5071–5078. doi: 10.1242/jcs.01381. [DOI] [PubMed] [Google Scholar]
- 38.Kowal RC, Herz J, Goldstein JL, Esser V, Brown MS. Low density lipoprotein receptor-related protein mediates uptake of cholesteryl esters derived from apoprotein E-enriched lipoproteins. Proc Natl Acad Sci U S A. 1989;86:5810–5814. doi: 10.1073/pnas.86.15.5810. [DOI] [PMC free article] [PubMed] [Google Scholar]
- 39.Gettins PG, Dolmer K. A proximal pair of positive charges provides the dominant ligand-binding contribution to complement-like domains from the LRP (low-density lipoprotein receptor-related protein) Biochem J. 2012;443:65–73. doi: 10.1042/BJ20111867. [DOI] [PMC free article] [PubMed] [Google Scholar]
- 40.Arandjelovic S, Hall BD, Gonias SL. Mutation of lysine 1370 in full-length human alpha2-macroglobulin blocks binding to the low density lipoprotein receptor-related protein-1. Arch Biochem Biophys. 2005;438:29–35. doi: 10.1016/j.abb.2005.03.019. [DOI] [PubMed] [Google Scholar]
- 41.Gonias SL, Wu L, Salicioni AM. Low density lipoprotein receptor-related protein: regulation of the plasma membrane proteome. Thromb Haemost. 2004;91:1056–1064. doi: 10.1160/TH04-01-0023. [DOI] [PubMed] [Google Scholar]
- 42.Gonias SL, Gaultier A, Jo M. Regulation of the urokinase receptor (uPAR) by LDL receptor-related protein-1 (LRP1) Curr Pharm Des. 2011;17:1962–1969. doi: 10.2174/138161211796718224. [DOI] [PubMed] [Google Scholar]
- 43.Gaultier A, Simon G, Niessen S, Dix M, Takimoto S, Cravatt BF 3rd, Gonias SL. LDL receptor-related protein 1 regulates the abundance of diverse cell-signaling proteins in the plasma membrane proteome. J Proteome Res. 2010;9:6689–6695. doi: 10.1021/pr1008288. [DOI] [PMC free article] [PubMed] [Google Scholar]
- 44.Ulery PG, Beers J, Mikhailenko I, Tanzi RE, Rebeck GW, Hyman BT, Strickland DK. Modulation of beta-amyloid precursor protein processing by the low density lipoprotein receptor-related protein (LRP). Evidence that LRP contributes to the pathogenesis of Alzheimer’s disease. J Biol Chem. 2000;275:7410–7415. doi: 10.1074/jbc.275.10.7410. [DOI] [PubMed] [Google Scholar]
- 45.Pietrzik CU, Yoon IS, Jaeger S, Busse T, Weggen S, Koo EH. FE65 constitutes the functional link between the low-density lipoprotein receptor-related protein and the amyloid precursor protein. J Neurosci. 2004;24:4259–4265. doi: 10.1523/JNEUROSCI.5451-03.2004. [DOI] [PMC free article] [PubMed] [Google Scholar]
- 46.May P, Rohlmann A, Bock HH, Zurhove K, Marth JD, Schomburg ED, Noebels JL, Beffert U, Sweatt JD, Weeber EJ, Herz J. Neuronal LRP1 functionally associates with postsynaptic proteins and is required for normal motor function in mice. Mol Cell Biol. 2004;24:8872–8883. doi: 10.1128/MCB.24.20.8872-8883.2004. [DOI] [PMC free article] [PubMed] [Google Scholar]
- 47.Warshawsky I, Broze GJ Jr, Schwartz AL. The low density lipoprotein receptor-related protein mediates the cellular degradation of tissue factor pathway inhibitor. Proc Natl Acad Sci U S A. 1994;91:6664–6668. doi: 10.1073/pnas.91.14.6664. [DOI] [PMC free article] [PubMed] [Google Scholar]
- 48.Basu S, Binder RJ, Ramalingam T, Srivastava PK. CD91 is a common receptor for heat shock proteins gp96, hsp90, hsp70, and calreticulin. Immunity. 2001;14:303–313. doi: 10.1016/s1074-7613(01)00111-x. [DOI] [PubMed] [Google Scholar]
- 49.Vasishta A, Baker PR, Preece PE, Wood RA, Cuschieri A. Serum proteinase-like peptidase activities and proteinase inhibitors in women with breast disease. Eur J Cancer Clin Oncol. 1984;20:197–202. doi: 10.1016/0277-5379(84)90184-6. [DOI] [PubMed] [Google Scholar]
- 50.Millan J, Lorenzo A, Gallurt P, Rodriguez P, Romero J, Lopez JJ, Senra A. ROC analysis of diagnostic performance utilizing serum antiproteases in cancer patients. Int J Biol Markers. 1988;3:203–205. doi: 10.1177/172460088800300310. [DOI] [PubMed] [Google Scholar]
- 51.Buamah PK, Skillen AW. Concentrations of protease and anti-protease in serum of patients with pancreatic cancer. Clin Chem. 1985;31:876–877. [PubMed] [Google Scholar]
- 52.Liu Y, Zhang Q, Wu J, Zhang H, Li X, Zheng Z, Luo M, Li L, Xiang Y, Yang F, Wu L. Long non-coding RNA A2M-AS1 promotes breast cancer progression by sponging microRNA-146b to upregulate MUC19. Int J Gen Med. 2020;13:1305–1316. doi: 10.2147/IJGM.S278564. [DOI] [PMC free article] [PubMed] [Google Scholar]
- 53.Fang K, Caixia H, Xiufen Z, Zijian G, Li L. Screening of a novel upregulated lncRNA, A2M-AS1, that promotes invasion and migration and signifies poor prognosis in breast cancer. Biomed Res Int. 2020;2020:9747826. doi: 10.1155/2020/9747826. [DOI] [PMC free article] [PubMed] [Google Scholar]
- 54.Kostova MB, Brennen WN, Lopez D, Anthony L, Wang H, Platz E, Denmeade SR. PSA-alpha-2-macroglobulin complex is enzymatically active in the serum of patients with advanced prostate cancer and can degrade circulating peptide hormones. Prostate. 2018;78:819–829. doi: 10.1002/pros.23539. [DOI] [PMC free article] [PubMed] [Google Scholar]
- 55.Kostova MB, Rosen DM, Chen Y, Mease RC, Denmeade SR. Structural optimization, biological evaluation, and application of peptidomimetic prostate specific antigen inhibitors. J Med Chem. 2013;56:4224–4235. doi: 10.1021/jm301718c. [DOI] [PMC free article] [PubMed] [Google Scholar]
- 56.Misra UK, Pizzo SV. Activated alpha2-macroglobulin binding to human prostate cancer cells triggers insulin-like responses. J Biol Chem. 2015;290:9571–9587. doi: 10.1074/jbc.M114.617837. [DOI] [PMC free article] [PubMed] [Google Scholar]
- 57.Lemanska-Perek A, Lis-Kuberka J, Lepczynski A, Dratwa-Chalupnik A, Tupikowski K, Katnik-Prastowska I, Ozgo M. Potential plasma biomarkers of bladder cancer identified by proteomic analysis: a pilot study. Adv Clin Exp Med. 2019;28:339–346. doi: 10.17219/acem/79296. [DOI] [PubMed] [Google Scholar]
- 58.Lindner I, Hemdan NY, Buchold M, Huse K, Bigl M, Oerlecke I, Ricken A, Gaunitz F, Sack U, Naumann A, Hollborn M, Thal D, Gebhardt R, Birkenmeier G. Alpha2-macroglobulin inhibits the malignant properties of astrocytoma cells by impeding beta-catenin signaling. Cancer Res. 2010;70:277–287. doi: 10.1158/0008-5472.CAN-09-1462. [DOI] [PubMed] [Google Scholar]
- 59.Misra UK, Sharma T, Pizzo SV. Ligation of cell surface-associated glucose-regulated protein 78 by receptor-recognized forms of alpha 2-macroglobulin: activation of p21-activated protein kinase-2-dependent signaling in murine peritoneal macrophages. J Immunol. 2005;175:2525–2533. doi: 10.4049/jimmunol.175.4.2525. [DOI] [PubMed] [Google Scholar]
- 60.Misra UK, Deedwania R, Pizzo SV. Activation and cross-talk between Akt, NF-kappaB, and unfolded protein response signaling in 1-LN prostate cancer cells consequent to ligation of cell surface-associated GRP78. J Biol Chem. 2006;281:13694–13707. doi: 10.1074/jbc.M511694200. [DOI] [PubMed] [Google Scholar]
- 61.Dedieu S, Langlois B, Devy J, Sid B, Henriet P, Sartelet H, Bellon G, Emonard H, Martiny L. LRP-1 silencing prevents malignant cell invasion despite increased pericellular proteolytic activities. Mol Cell Biol. 2008;28:2980–2995. doi: 10.1128/MCB.02238-07. [DOI] [PMC free article] [PubMed] [Google Scholar]
- 62.Desrosiers RR, Rivard ME, Grundy PE, Annabi B. Decrease in LDL receptor-related protein expression and function correlates with advanced stages of Wilms tumors. Pediatr Blood Cancer. 2006;46:40–49. doi: 10.1002/pbc.20566. [DOI] [PubMed] [Google Scholar]
- 63.Strickland DK, Ranganathan S. Diverse role of LDL receptor-related protein in the clearance of proteases and in signaling. J Thromb Haemost. 2003;1:1663–1670. doi: 10.1046/j.1538-7836.2003.00330.x. [DOI] [PubMed] [Google Scholar]
- 64.Sid B, Dedieu S, Delorme N, Sartelet H, Rath GM, Bellon G, Martiny L. Human thyroid carcinoma cell invasion is controlled by the low density lipoprotein receptor-related protein-mediated clearance of urokinase plasminogen activator. Int J Biochem Cell Biol. 2006;38:1729–1740. doi: 10.1016/j.biocel.2006.04.005. [DOI] [PubMed] [Google Scholar]
- 65.Kancha RK, Stearns ME, Hussain MM. Decreased expression of the low density lipoprotein receptor-related protein/alpha 2-macroglobulin receptor in invasive cell clones derived from human prostate and breast tumor cells. Oncol Res. 1994;6:365–372. [PubMed] [Google Scholar]
- 66.Foca C, Moses EK, Quinn MA, Rice GE. Differential expression of the alpha(2)-macroglobulin receptor and the receptor associated protein in normal human endometrium and endometrial carcinoma. Mol Hum Reprod. 2000;6:921–927. doi: 10.1093/molehr/6.10.921. [DOI] [PubMed] [Google Scholar]
- 67.Ma Z, Thomas KS, Webb DJ, Moravec R, Salicioni AM, Mars WM, Gonias SL. Regulation of Rac1 activation by the low density lipoprotein receptor-related protein. J Cell Biol. 2002;159:1061–1070. doi: 10.1083/jcb.200207070. [DOI] [PMC free article] [PubMed] [Google Scholar]
- 68.Wijnberg MJ, Quax PH, Nieuwenbroek NM, Verheijen JH. The migration of human smooth muscle cells in vitro is mediated by plasminogen activation and can be inhibited by alpha2-macroglobulin receptor associated protein. Thromb Haemost. 1997;78:880–886. [PubMed] [Google Scholar]
- 69.Li Y, Wood N, Grimsley P, Yellowlees D, Donnelly PK. In vitro invasiveness of human breast cancer cells is promoted by low density lipoprotein receptor-related protein. Invasion Metastasis. 1998;18:240–251. doi: 10.1159/000024517. [DOI] [PubMed] [Google Scholar]
- 70.Thevenard J, Verzeaux L, Devy J, Etique N, Jeanne A, Schneider C, Hachet C, Ferracci G, David M, Martiny L, Charpentier E, Khrestchatisky M, Rivera S, Dedieu S, Emonard H. Low-density lipoprotein receptor-related protein-1 mediates endocytic clearance of tissue inhibitor of metalloproteinases-1 and promotes its cytokine-like activities. PLoS One. 2014;9:e103839. doi: 10.1371/journal.pone.0103839. [DOI] [PMC free article] [PubMed] [Google Scholar]
- 71.Emonard H, Bellon G, Troeberg L, Berton A, Robinet A, Henriet P, Marbaix E, Kirkegaard K, Patthy L, Eeckhout Y, Nagase H, Hornebeck W, Courtoy PJ. Low density lipoprotein receptor-related protein mediates endocytic clearance of pro-MMP-2. TIMP-2 complex through a thrombospondin-independent mechanism. J Biol Chem. 2004;279:54944–54951. doi: 10.1074/jbc.M406792200. [DOI] [PubMed] [Google Scholar]
- 72.Yang Z, Strickland DK, Bornstein P. Extracellular matrix metalloproteinase 2 levels are regulated by the low density lipoprotein-related scavenger receptor and thrombospondin 2. J Biol Chem. 2001;276:8403–8408. doi: 10.1074/jbc.M008925200. [DOI] [PubMed] [Google Scholar]
- 73.Benes P, Jurajda M, Zaloudik J, Izakovicova-Holla L, Vacha J. C766T low-density lipoprotein receptor-related protein 1 (LRP1) gene polymorphism and susceptibility to breast cancer. Breast Cancer Res. 2003;5:R77–81. doi: 10.1186/bcr591. [DOI] [PMC free article] [PubMed] [Google Scholar]
- 74.Baum L, Dong ZY, Choy KW, Pang CP, Ng HK. Low density lipoprotein receptor related protein gene amplification and 766T polymorphism in astrocytomas. Neurosci Lett. 1998;256:5–8. doi: 10.1016/s0304-3940(98)00734-4. [DOI] [PubMed] [Google Scholar]
- 75.Liotta LA, Steeg PS, Stetler-Stevenson WG. Cancer metastasis and angiogenesis: an imbalance of positive and negative regulation. Cell. 1991;64:327–336. doi: 10.1016/0092-8674(91)90642-c. [DOI] [PubMed] [Google Scholar]
- 76.Catasus L, Llorente-Cortes V, Cuatrecasas M, Pons C, Espinosa I, Prat J. Low-density lipoprotein receptor-related protein 1 (LRP-1) is associated with highgrade, advanced stage and p53 and p16 alterations in endometrial carcinomas. Histopathology. 2011;59:567–571. doi: 10.1111/j.1365-2559.2011.03942.x. [DOI] [PubMed] [Google Scholar]
- 77.Song H, Li Y, Lee J, Schwartz AL, Bu G. Low-density lipoprotein receptor-related protein 1 promotes cancer cell migration and invasion by inducing the expression of matrix metalloproteinases 2 and 9. Cancer Res. 2009;69:879–886. doi: 10.1158/0008-5472.CAN-08-3379. [DOI] [PMC free article] [PubMed] [Google Scholar]
- 78.Fink K, Boratynski J. The role of metalloproteinases in modification of extracellular matrix in invasive tumor growth, metastasis and angiogenesis. Postepy Hig Med Dosw (Online) 2012;66:609–628. doi: 10.5604/17322693.1009705. [DOI] [PubMed] [Google Scholar]
- 79.Hu K, Yang J, Tanaka S, Gonias SL, Mars WM, Liu Y. Tissue-type plasminogen activator acts as a cytokine that triggers intracellular signal transduction and induces matrix metalloproteinase-9 gene expression. J Biol Chem. 2006;281:2120–2127. doi: 10.1074/jbc.M504988200. [DOI] [PubMed] [Google Scholar]
- 80.Langlois B, Perrot G, Schneider C, Henriet P, Emonard H, Martiny L, Dedieu S. LRP-1 promotes cancer cell invasion by supporting ERK and inhibiting JNK signaling pathways. PLoS One. 2010;5:e11584. doi: 10.1371/journal.pone.0011584. [DOI] [PMC free article] [PubMed] [Google Scholar]
- 81.Takayama Y, Takahashi H, Mizumachi K, Takezawa T. Low density lipoprotein receptor-related protein (LRP) is required for lactoferrin-enhanced collagen gel contractile activity of human fibroblasts. J Biol Chem. 2003;278:22112–22118. doi: 10.1074/jbc.M300894200. [DOI] [PubMed] [Google Scholar]
- 82.Mantuano E, Inoue G, Li X, Takahashi K, Gaultier A, Gonias SL, Campana WM. The hemopexin domain of matrix metalloproteinase-9 activates cell signaling and promotes migration of schwann cells by binding to low-density lipoprotein receptor-related protein. J Neurosci. 2008;28:11571–11582. doi: 10.1523/JNEUROSCI.3053-08.2008. [DOI] [PMC free article] [PubMed] [Google Scholar]
- 83.Gopal U, Bohonowych JE, Lema-Tome C, Liu A, Garrett-Mayer E, Wang B, Isaacs JS. A novel extracellular Hsp90 mediated co-receptor function for LRP1 regulates EphA2 dependent glioblastoma cell invasion. PLoS One. 2011;6:e17649. doi: 10.1371/journal.pone.0017649. [DOI] [PMC free article] [PubMed] [Google Scholar]
- 84.Fuentealba RA, Liu Q, Kanekiyo T, Zhang J, Bu G. Low density lipoprotein receptor-related protein 1 promotes anti-apoptotic signaling in neurons by activating Akt survival pathway. J Biol Chem. 2009;284:34045–34053. doi: 10.1074/jbc.M109.021030. [DOI] [PMC free article] [PubMed] [Google Scholar]
- 85.Misra UK, Pizzo SV. Induction of cyclooxygenase-2 synthesis by ligation of the macrophage alpha(2)-macroglobulin signalling receptor. Cell Signal. 2001;13:801–808. doi: 10.1016/s0898-6568(01)00202-9. [DOI] [PubMed] [Google Scholar]
- 86.Kurz S, Thieme R, Amberg R, Groth M, Jahnke HG, Pieroh P, Horn LC, Kolb M, Huse K, Platzer M, Volke D, Dehghani F, Buzdin A, Engel K, Robitzki A, Hoffmann R, Gockel I, Birkenmeier G. The anti-tumorigenic activity of A2M-A lesson from the naked mole-rat. PLoS One. 2017;12:e0189514. doi: 10.1371/journal.pone.0189514. [DOI] [PMC free article] [PubMed] [Google Scholar]
- 87.Lauer D, Muller R, Cott C, Otto A, Naumann M, Birkenmeier G. Modulation of growth factor binding properties of alpha2-macroglobulin by enzyme therapy. Cancer Chemother Pharmacol. 2001;47(Suppl):S4–9. doi: 10.1007/s002800170002. [DOI] [PubMed] [Google Scholar]
- 88.Birkenmeier G, Muller R, Huse K, Forberg J, Glaser C, Hedrich H, Nicklisch S, Reichenbach A. Human alpha2-macroglobulin: genotype-phenotype relation. Exp Neurol. 2003;184:153–161. doi: 10.1016/s0014-4886(03)00110-9. [DOI] [PubMed] [Google Scholar]