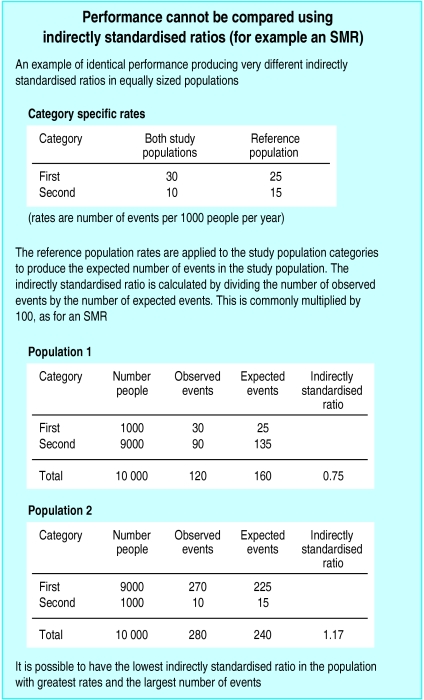
Valid performance league tables cannot be formed from indirectly standardised indices.1–5 However, this methodology has been adopted for most of the performance indicators for NHS trusts that relate to outcomes, effectiveness, and access. This includes all the clinical indicators.6 Indirect standardisation is also used to compare general practitioners' prescribing.7
As an illustration, the example in the box includes two study populations with identical category specific rates (these may be for age, ethnicity, or case mix, for example). Despite performing identically, they have two very different indirectly standardised ratios because of their different structures. 
The inappropriate comparison of performance using indirect standardisation arises because of a common misconception about the standard that is being used. For indirect standardisation the study population itself is the standard, as this is the population to which the category specific reference rates are applied. Consequently, a different standard is used for each population's indirectly standardised ratio.
In contrast, for direct standardisation each study population's category specific rates are applied to the same reference population. This provides a common standard through which the directly standardised rates can be compared. Identical performance produces an identical directly standardised rate.
Indirect standardisation can be used to make valid comparisons of performance in two situations.8 One is when each study population has an identical distribution. The second is when the rates in a study population are all the same multiple of the reference population's rates. Different populations may have a different multiple. A pragmatic view is that these conditions apply approximately to most situations where indirect standardisation for age and sex is used for health related data,4 as in the NHS performance indicators.
The following examples show that this assumption is not necessarily justified. The Department of Health publishes three year mortality figures relating to several indicators for health authorities in both direct and indirectly standardised form.9 Ranking for deaths from circulatory diseases for the 99 health authorities differ by up to 18 ranks between the two methods of standardisation. The average difference is 3.6 ranks, and if a threshold is drawn for the worst quarter on the basis of indirectly standardised ratios then three health authorities are incorrectly placed in this quarter.
The patterns for other health authority performance indicators are similar, and the magnitude and direction of the errors in ranking may be systematic. For circulatory disease and cancer mortality the errors are significantly correlated (Pearson's correlation coefficient 0.36, P<0.001). This suggests that using a basket of performance indicators may not solve the problem of using indirectly standardised indices.
The Department of Health does not publish the information to allow the assessment of the error in their league tables for NHS trusts. With these smaller populations, misclassification will occur more often because of the greater variability in the age and sex structure. The five year mortality figures for coronary heart disease for the 101 general practices in the Lincolnshire health authority area (unpublished data) show that the practices are incorrectly placed by up to 30 ranks when using indirectly standardised ratios. A fifth are misclassified by more than 10 ranks.
Direct standardisation is the simplest way to adjust for risk when comparing performance,1 but has its own disadvantages. Rates may not be stable from year to year, with small populations and low numbers of events. This applies to many NHS performance indicators, but using three or five year figures to stabilise rates does not suit political timetables. Information to calculate rates is not always collected, as in the case of the general practitioners' prescribing indices. Also, confidence intervals for directly standardised rates are relatively wider than confidence intervals for indirectly standardised rates.10
League tables are here to stay. There are many issues on how risk adjustment should be incorporated into them.11,12 The difficulties dealing with the wide overlapping confidence intervals around individual ranks are considerable, with the multiple comparisons inherent in league tables.12 Explaining these uncertainties to a wider public to aid the interpretation of the tables is equally problematic.
The crucial requirement for league tables is that they are based on a valid comparative measure of performance. The indirectly standardised indices currently used are fundamentally flawed in this respect. Organisations censured or not rewarded as a result of their use may be able to argue that the process has been arbitrary and unfair. If direct standardisation produces a different outcome then they can prove it.
References
- 1.Inskip H, Beral V, Fraser P, Haskey J. Methods for age-adjustments of rates. Stat Med. 1983;2:445–466. doi: 10.1002/sim.4780020404. [DOI] [PubMed] [Google Scholar]
- 2.Miettinen OS. Principles of occurrence research in medicine. New York: Wiley; 1985. pp. 270–271. [Google Scholar]
- 3.Hennekens CH, Buring JE. Epidemiology in medicine. 2nd ed. Boston: Little, Brown; 1987. pp. 84–85. [Google Scholar]
- 4.Macmahon B, Tichopoulos D. Epidemiology: principles and methods. 2nd ed. Boston: Little, Brown; 1996. p. 55. [Google Scholar]
- 5.Julios SA, Nicholl J, George S. Why do we continue to use standardized mortality ratios for small area comparisons? J Public Health Med. 2000;23:40–46. doi: 10.1093/pubmed/23.1.40. [DOI] [PubMed] [Google Scholar]
- 6. Department of Health. NHS performance indicators: February 2002. www.doh.gov.uk/nhsperformanceindicators/2002/ (accessed 7 Jun 2002).
- 7. Prescribing Support Unit. www.psu.co.uk/index.html⧣top (accessed 7 Jun 2002).
- 8.Rothman KJ, Greenland S. Modern epidemiology. 2nd ed. Philadelphia: Lippincott-Raven; 1998. p. 262. , 655-6. [Google Scholar]
- 9.Department of Health. Compendium of clinical and health indicators 2000. London: DoH/National Centre for Health Outcomes Development; 2001. . (CD Rom; Crown copyright.) [Google Scholar]
- 10.Armitage P, Berry G, Matthews JN. Statistical methods in medical research. 4th ed. Oxford: Blackwell Science; 2002. p. 666. [Google Scholar]
- 11.Burgess F, Christiansen C, Michalak S, Morris C. Medical profiling: improving standards and risk adjustments using hierarchical models. J Health Econ. 2000;19:291–309. doi: 10.1016/s0167-6296(99)00034-x. [DOI] [PubMed] [Google Scholar]
- 12.Goldstein H, Spiegelhalter D. League tables and their limitations: statistical issues in comparisons of institutional performance. J R Stat Soc. 1996;159:385–443. . (Part 3.) [Google Scholar]


